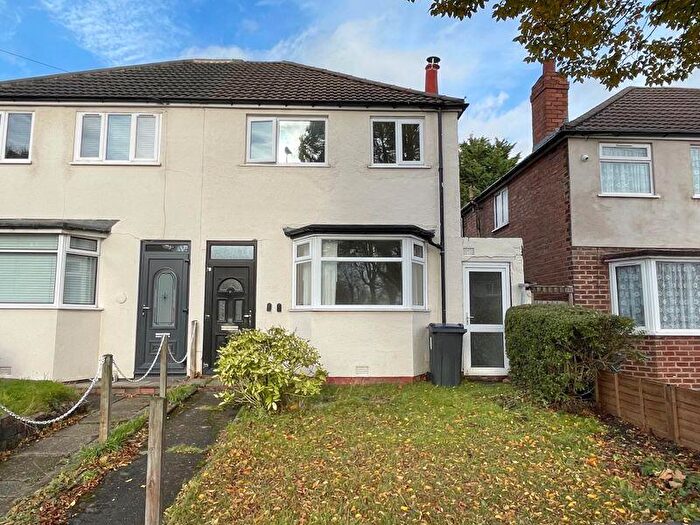
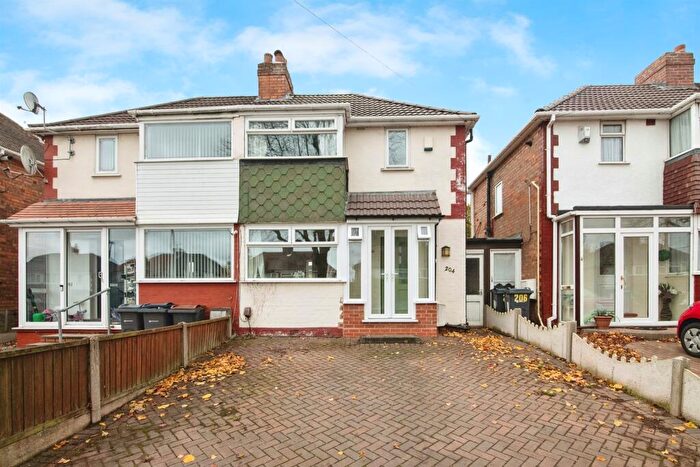
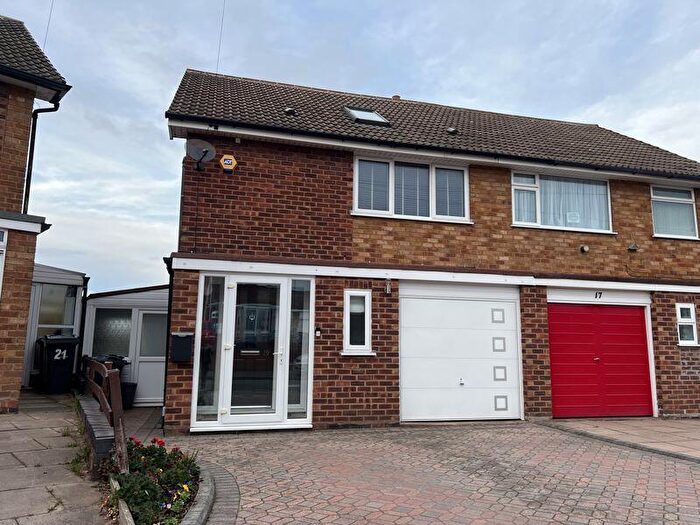
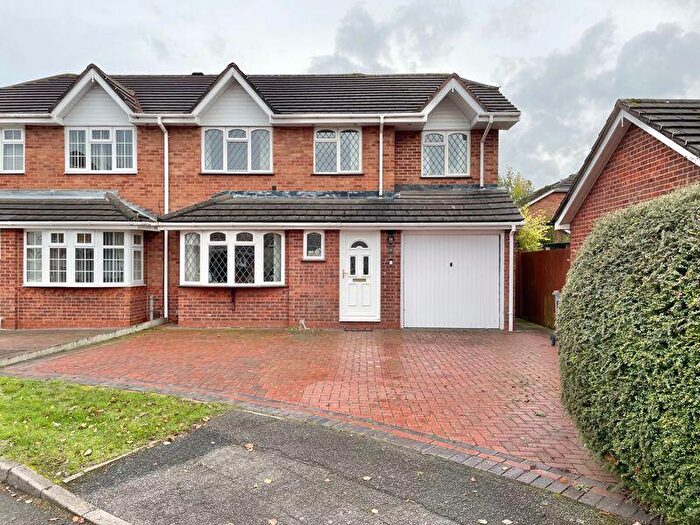
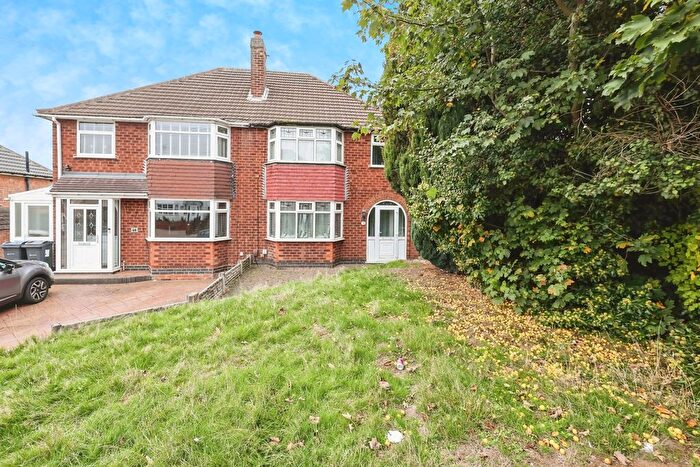
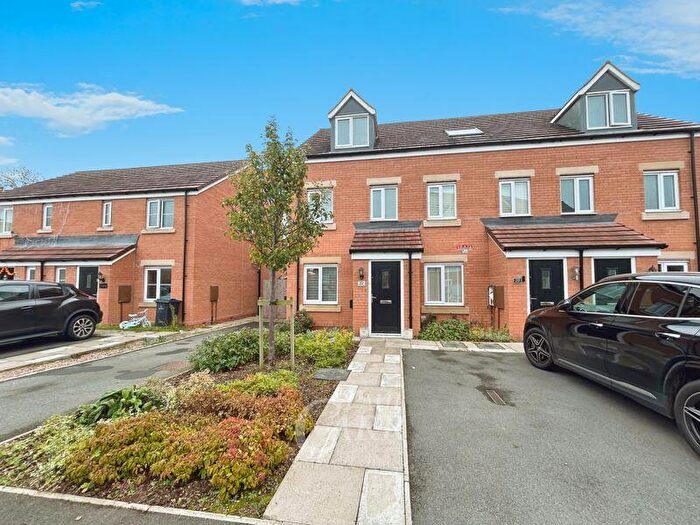
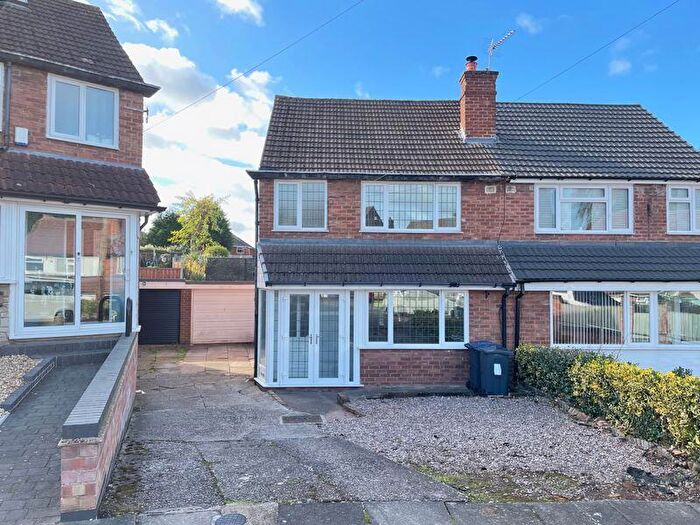
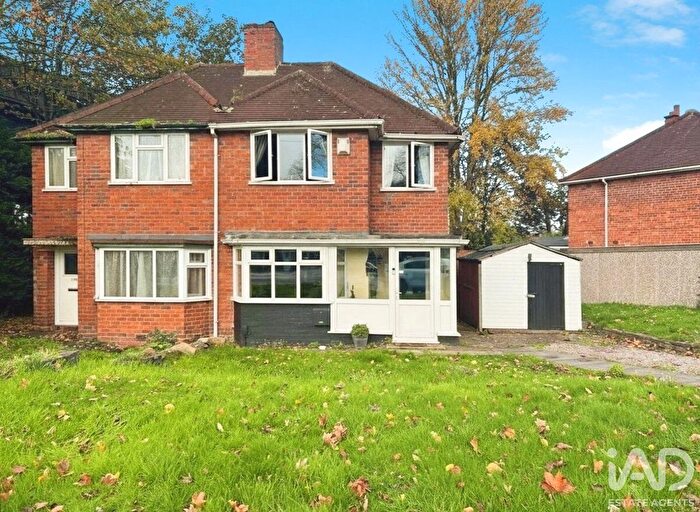
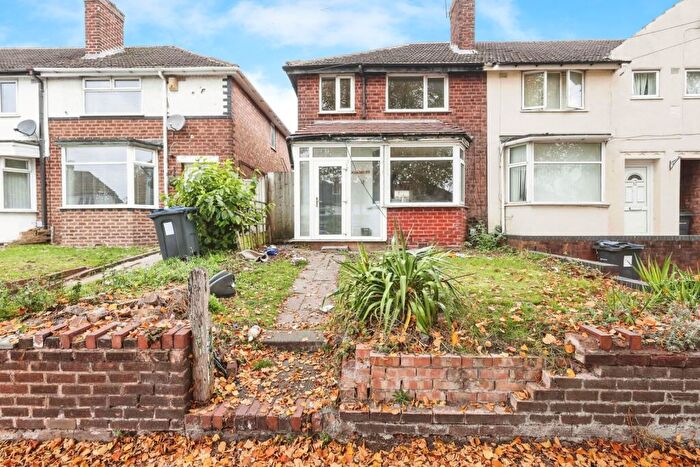
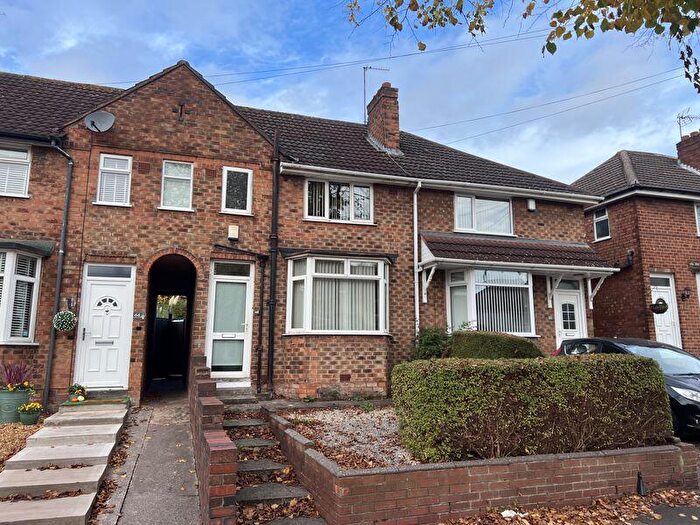
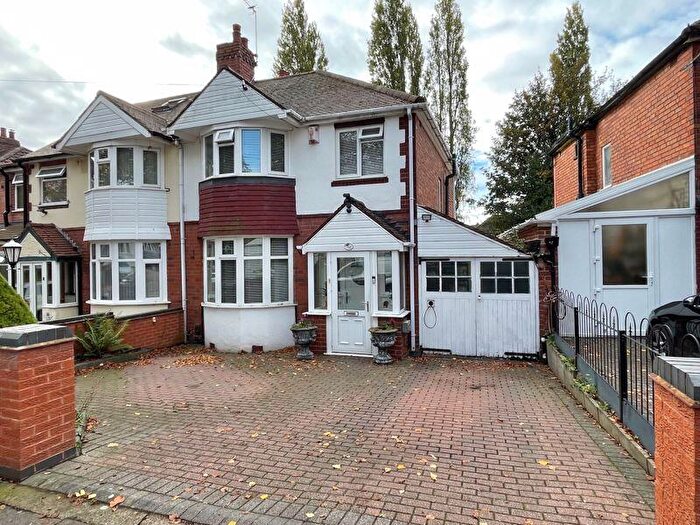
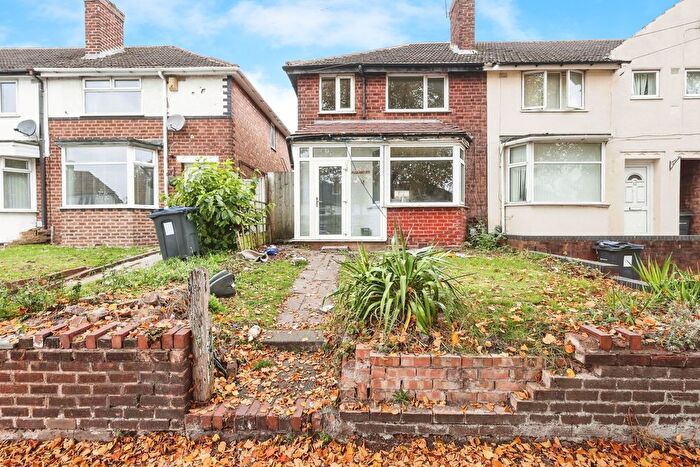
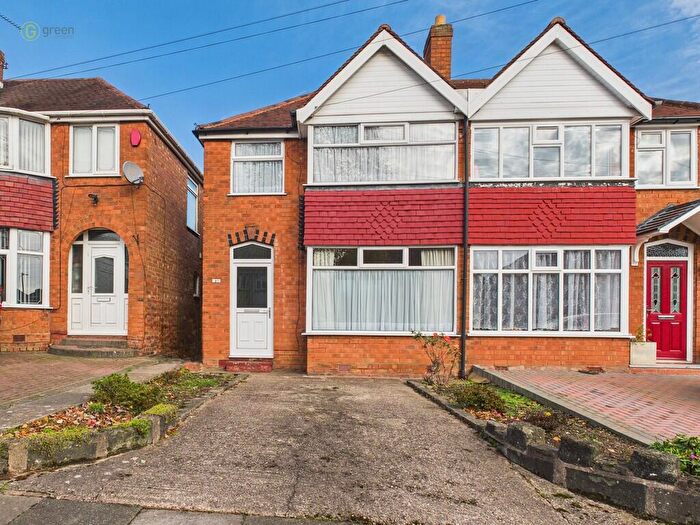
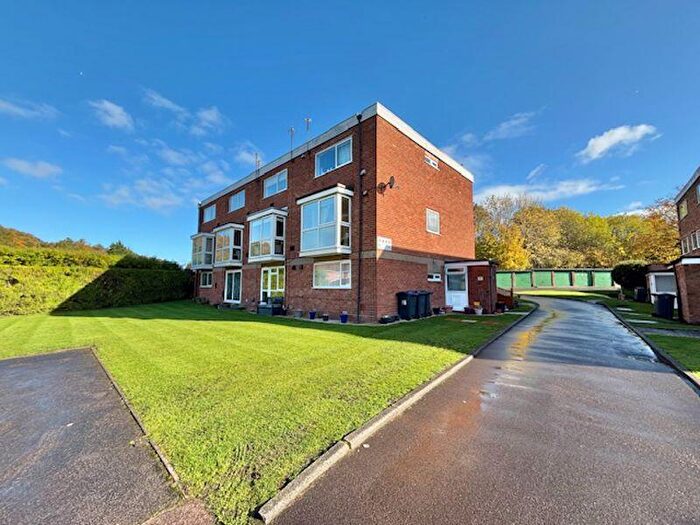
Houses for sale & to rent in Oscott, Birmingham
House Prices in Oscott
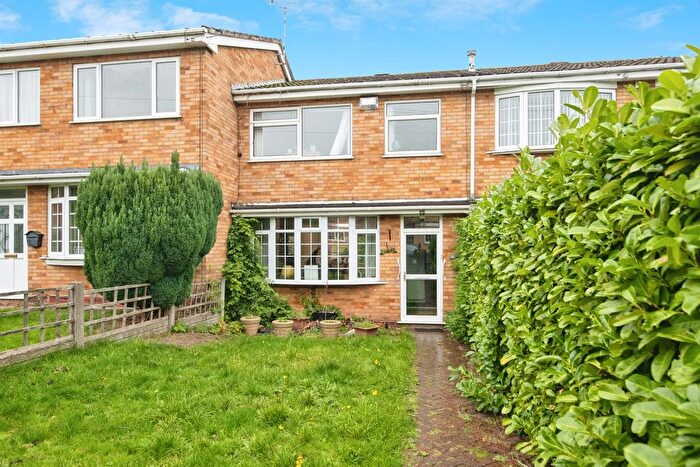
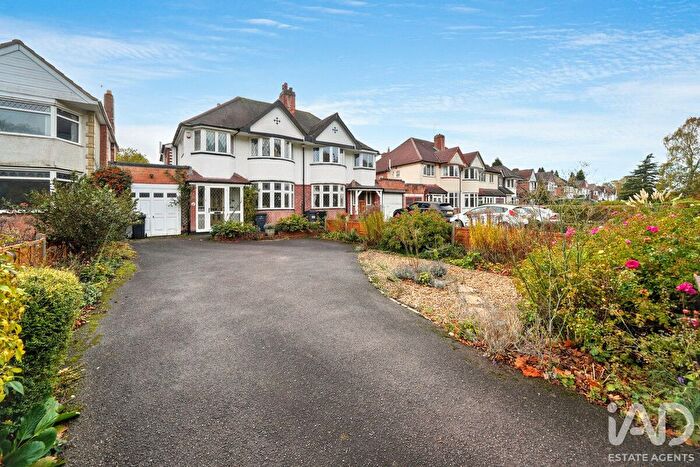
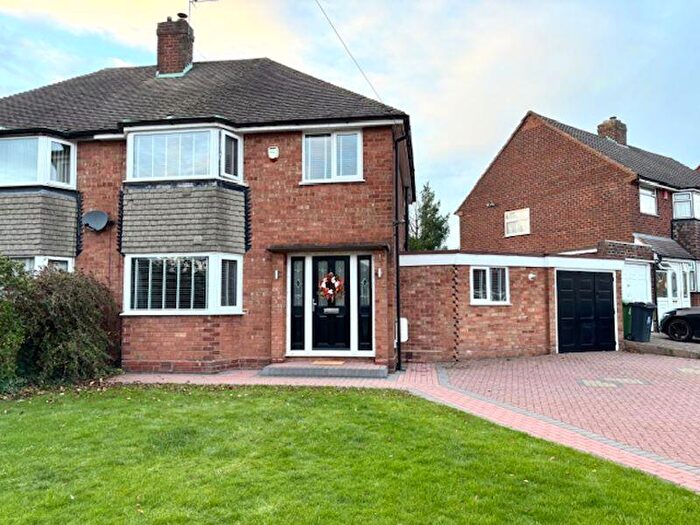
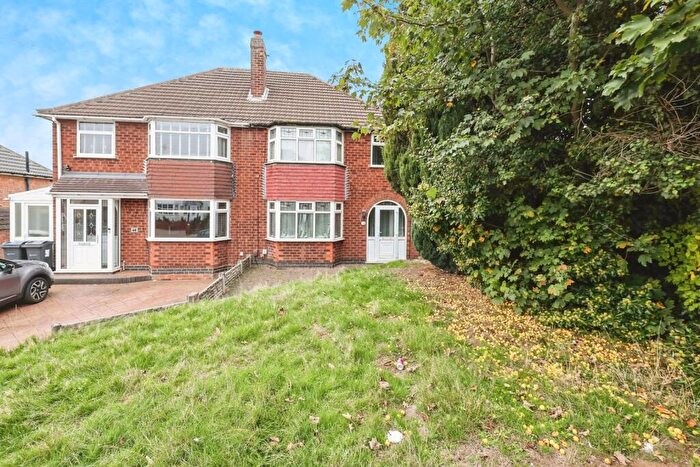
Properties in Oscott have an average house price of £199,756.00 and had 1,228 Property Transactions within the last 3 years¹.
Oscott is an area in Birmingham, Birmingham with 10,285 households², where the most expensive property was sold for £410,000.00.
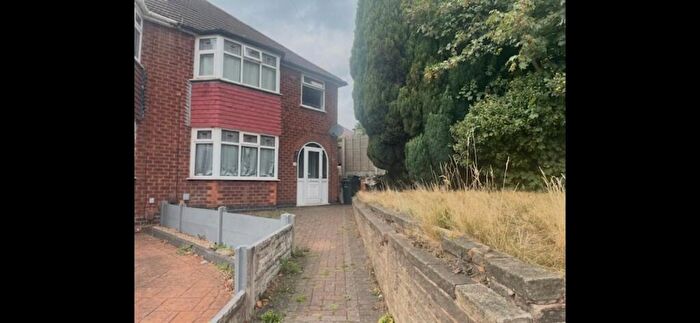
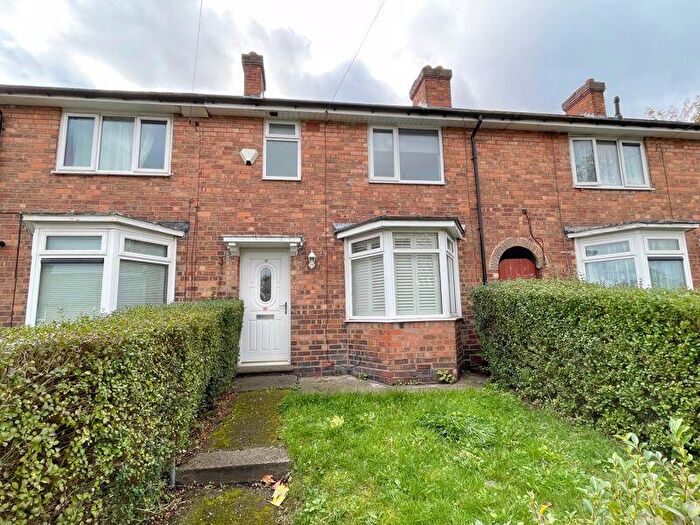
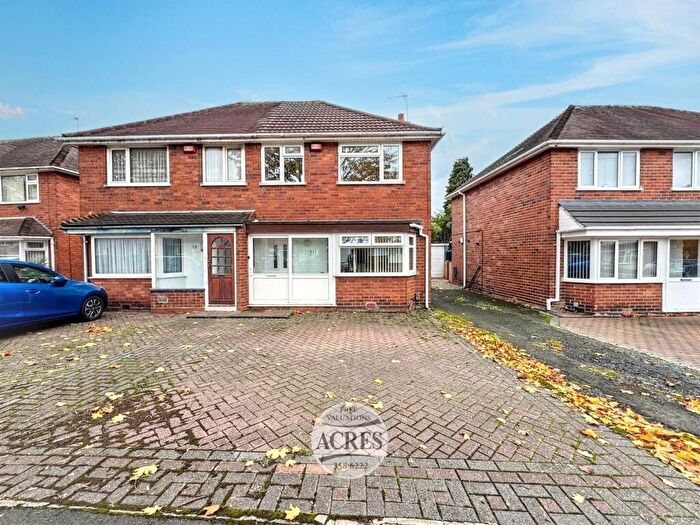
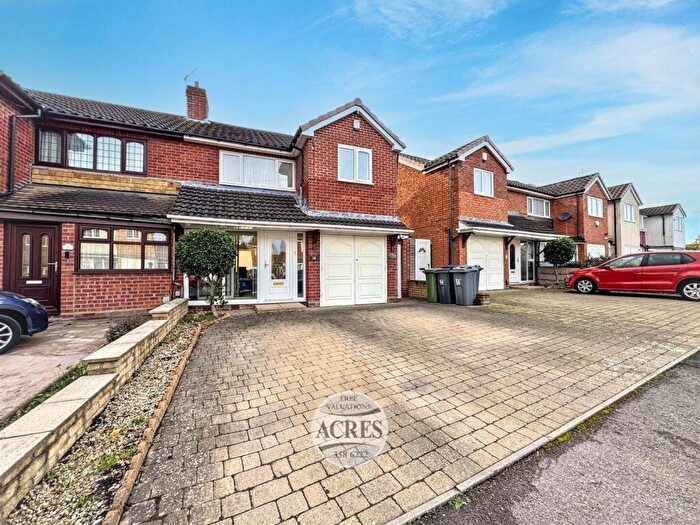
Properties for sale in Oscott
Roads and Postcodes in Oscott
Navigate through our locations to find the location of your next house in Oscott, Birmingham for sale or to rent.
Transport near Oscott
-
Hamstead Station
-
Perry Barr Station
-
Witton Station
-
Erdington Station
-
Wylde Green Station
-
Chester Road Station
-
Gravelly Hill Station
-
Aston Station
- FAQ
- Price Paid By Year
- Property Type Price
Frequently asked questions about Oscott
What is the average price for a property for sale in Oscott?
The average price for a property for sale in Oscott is £199,756. This amount is 15% lower than the average price in Birmingham. There are 3,464 property listings for sale in Oscott.
What streets have the most expensive properties for sale in Oscott?
The streets with the most expensive properties for sale in Oscott are Woodland Mews at an average of £322,000, Bluebell Crescent at an average of £313,666 and Idbury Road at an average of £299,999.
What streets have the most affordable properties for sale in Oscott?
The streets with the most affordable properties for sale in Oscott are St Annes Way at an average of £75,730, Marine Drive at an average of £91,142 and Vicarage Close at an average of £106,300.
Which train stations are available in or near Oscott?
Some of the train stations available in or near Oscott are Hamstead, Perry Barr and Witton.
Property Price Paid in Oscott by Year
The average sold property price by year was:
| Year | Average Sold Price | Price Change |
Sold Properties
|
|---|---|---|---|
| 2025 | £205,333 | 3% |
173 Properties |
| 2024 | £199,912 | -1% |
358 Properties |
| 2023 | £202,275 | 4% |
332 Properties |
| 2022 | £194,668 | -3% |
365 Properties |
| 2021 | £200,711 | 21% |
495 Properties |
| 2020 | £158,159 | -3% |
298 Properties |
| 2019 | £163,510 | 2% |
467 Properties |
| 2018 | £160,809 | 9% |
484 Properties |
| 2017 | £146,803 | 6% |
435 Properties |
| 2016 | £137,305 | 7% |
436 Properties |
| 2015 | £128,339 | 7% |
393 Properties |
| 2014 | £119,727 | 4% |
370 Properties |
| 2013 | £115,139 | 6% |
292 Properties |
| 2012 | £107,685 | 2% |
206 Properties |
| 2011 | £105,493 | -7% |
242 Properties |
| 2010 | £112,428 | 5% |
236 Properties |
| 2009 | £106,588 | -11% |
182 Properties |
| 2008 | £118,682 | -7% |
296 Properties |
| 2007 | £126,965 | 6% |
577 Properties |
| 2006 | £119,972 | 4% |
633 Properties |
| 2005 | £115,320 | 7% |
502 Properties |
| 2004 | £107,761 | 18% |
475 Properties |
| 2003 | £88,770 | 20% |
526 Properties |
| 2002 | £71,378 | 17% |
588 Properties |
| 2001 | £59,590 | 12% |
491 Properties |
| 2000 | £52,316 | 5% |
559 Properties |
| 1999 | £49,951 | 10% |
516 Properties |
| 1998 | £45,190 | 2% |
454 Properties |
| 1997 | £44,116 | 4% |
387 Properties |
| 1996 | £42,496 | -3% |
387 Properties |
| 1995 | £43,562 | - |
312 Properties |
Property Price per Property Type in Oscott
Here you can find historic sold price data in order to help with your property search.
The average Property Paid Price for specific property types in the last three years are:
| Property Type | Average Sold Price | Sold Properties |
|---|---|---|
| Semi Detached House | £209,837.00 | 710 Semi Detached Houses |
| Detached House | £273,750.00 | 30 Detached Houses |
| Terraced House | £190,663.00 | 427 Terraced Houses |
| Flat | £109,682.00 | 61 Flats |

