
Houses for sale & to rent in B26 1NU, Brays Road, Sheldon, Birmingham
House Prices in B26 1NU, Brays Road, Sheldon
Properties in B26 1NU have no sales history available within the last 3 years. B26 1NU is a postcode in Brays Road located in Sheldon, an area in Birmingham, Birmingham, with 2 households².
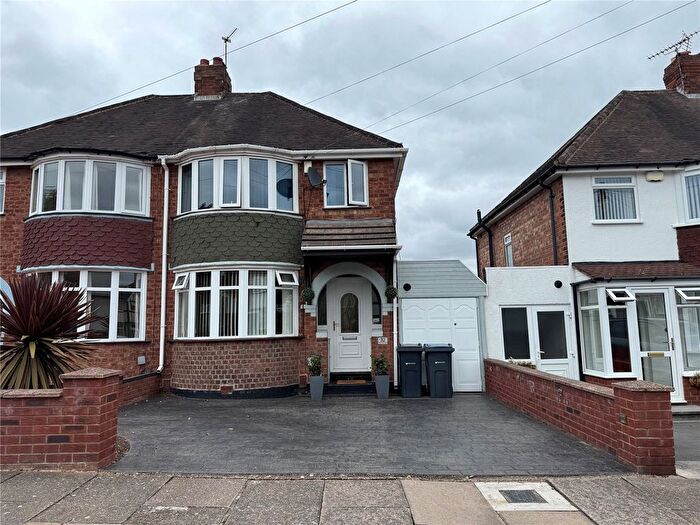
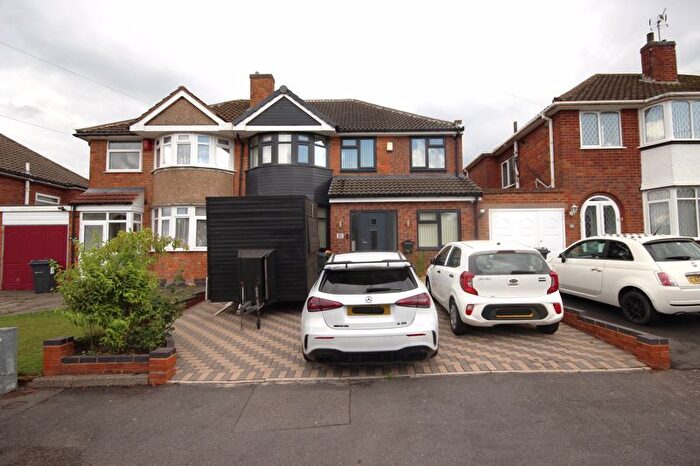
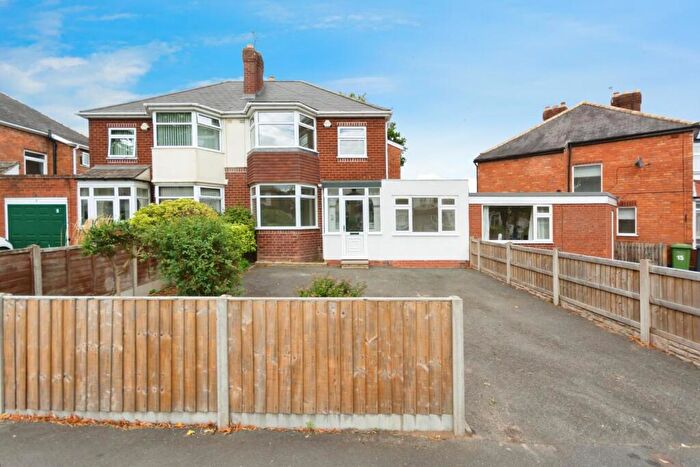
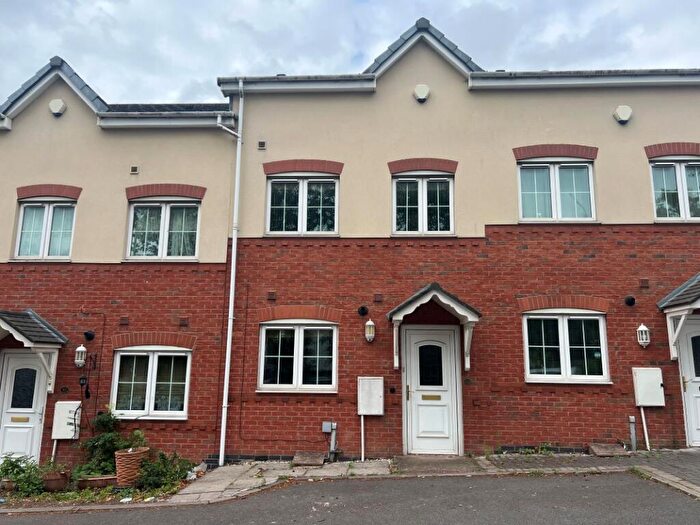
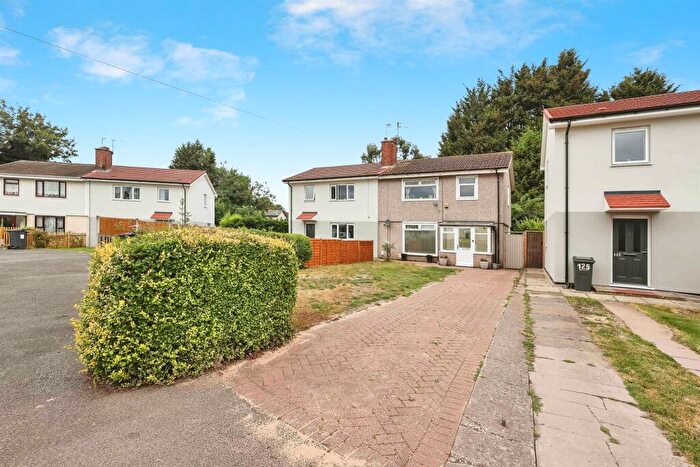
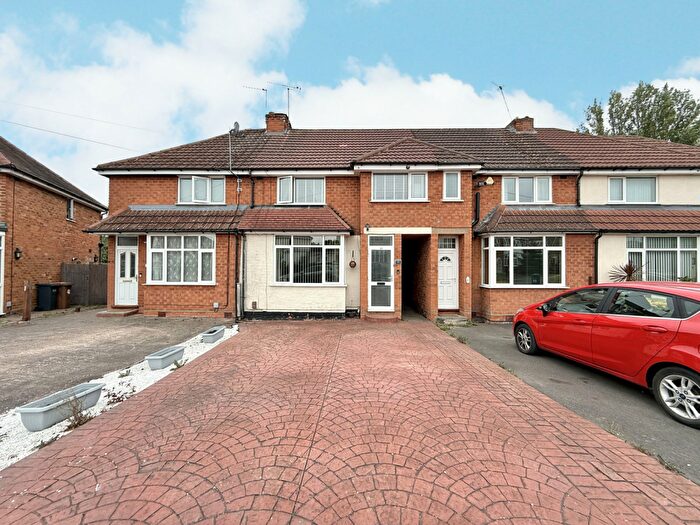
Properties for sale near B26 1NU, Brays Road


![]()
If you are looking to sell your house, let it out, or receive a property valuation, an expert can help you.
Click the button below to get started.


Price Paid in Brays Road, B26 1NU, Sheldon
11 Brays Road, B26 1NU, Sheldon Birmingham
Property 11 has been sold 2 times. The last time it was sold was in 20/04/2018 and the sold price was £226,000.00.
This semi detached house, sold as a leasehold on 20/04/2018, is a 73 sqm semi-detached house with an EPC rating of D.
| Date | Price | Property Type | Tenure | Classification |
|---|---|---|---|---|
| 20/04/2018 | £226,000.00 | Semi Detached House | leasehold | Established Building |
| 20/04/2018 | £226,000.00 | Semi Detached House | freehold | Established Building |
15 Brays Road, B26 1NU, Sheldon Birmingham
Property 15 has been sold 2 times. The last time it was sold was in 15/08/2003 and the sold price was £123,000.00.
This semi detached house, sold as a freehold on 15/08/2003, is a 86 sqm semi-detached house with an EPC rating of D.
| Date | Price | Property Type | Tenure | Classification |
|---|---|---|---|---|
| 15/08/2003 | £123,000.00 | Semi Detached House | freehold | Established Building |
| 12/01/2001 | £73,500.00 | Semi Detached House | leasehold | Established Building |
Postcodes in Brays Road, Sheldon
Navigate through other locations in Brays Road, Sheldon, Birmingham to see more property listings for sale or to rent.
Transport near B26 1NU, Brays Road
-
 Acocks Green Station
 -
Olton Station
-
Lea Hall Station
-
Tyseley Station
-
Marston Green Station
-
Stechford Station
-
Spring Road Station
-
Hall Green Station
-
Small Heath Station
House price paid reports for B26 1NU, Brays Road
Click on the buttons below to see price paid reports by year or property price:
- Price Paid By Year
Property Price Paid in B26 1NU, Brays Road by Year
The average sold property price by year was:
| Year | Average Sold Price | Price Change |
Sold Properties
|
|---|---|---|---|
| 2018 | £226,000 | 46% |
2 Properties |
| 2003 | £123,000 | 40% |
1 Property |
| 2001 | £73,500 | - |
1 Property |