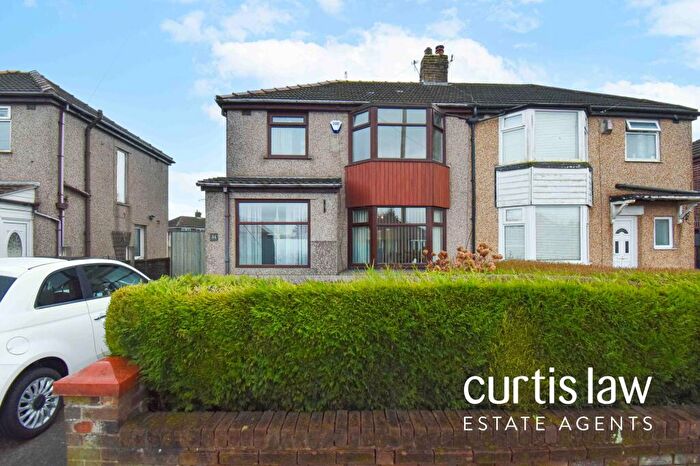
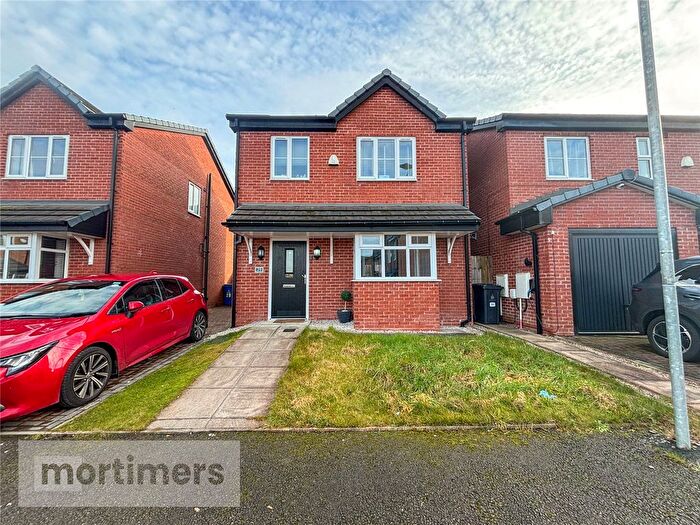
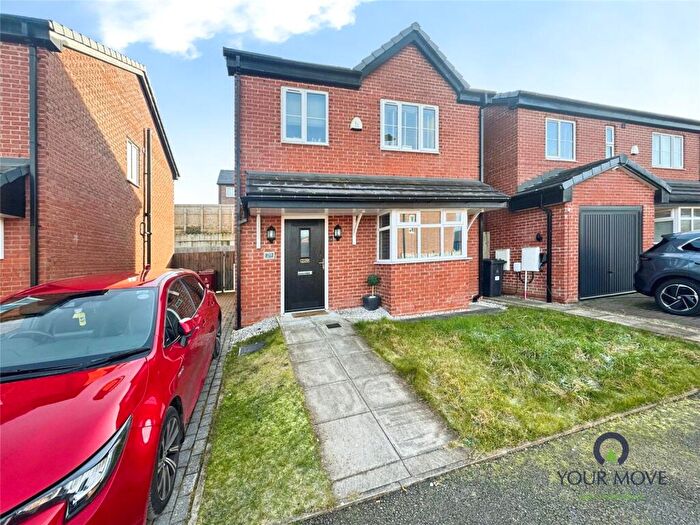
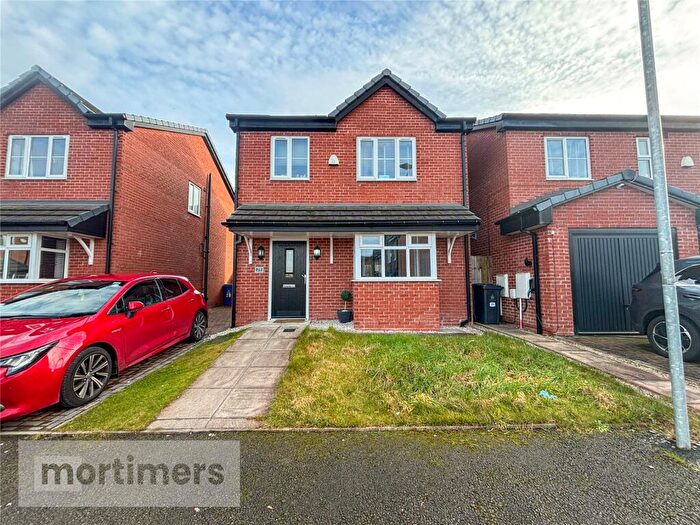
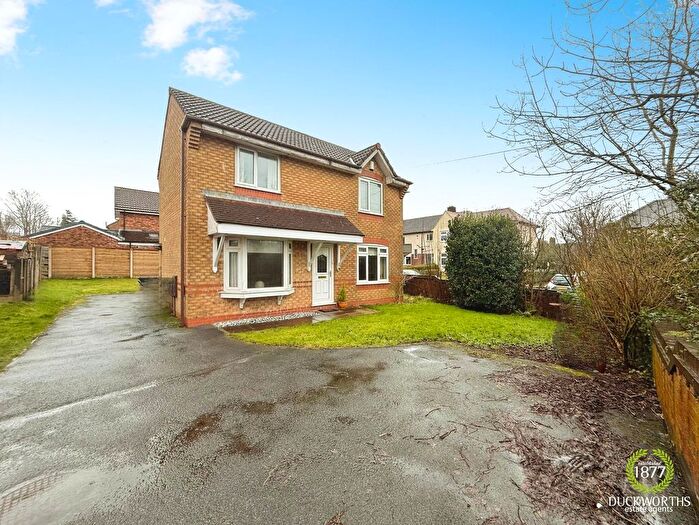
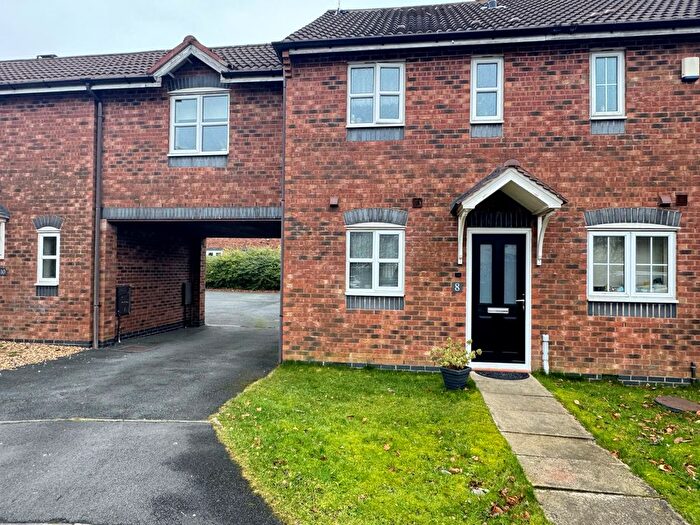
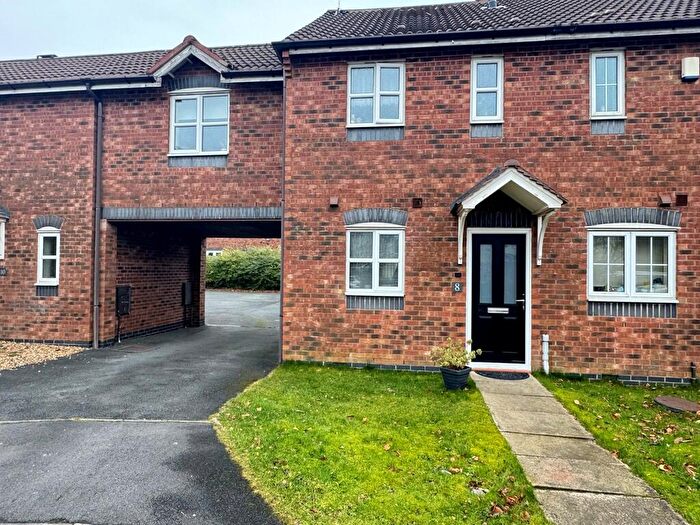
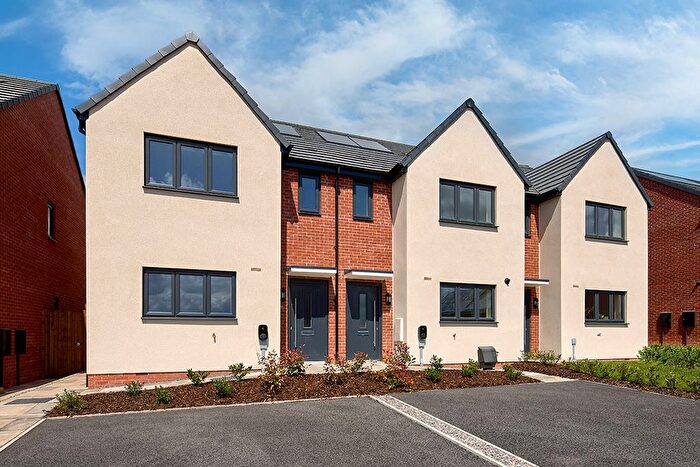
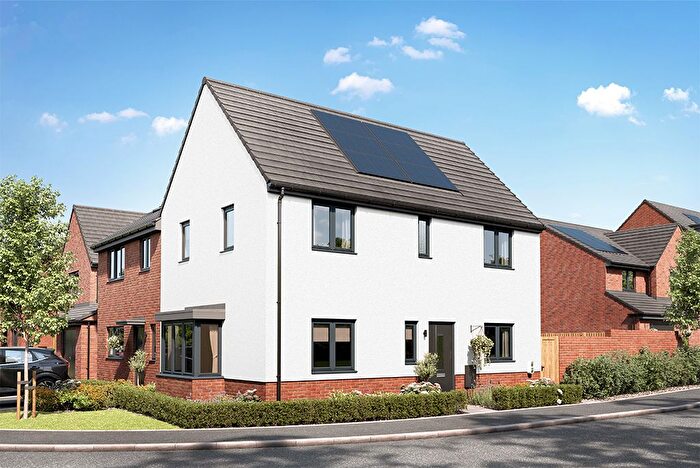
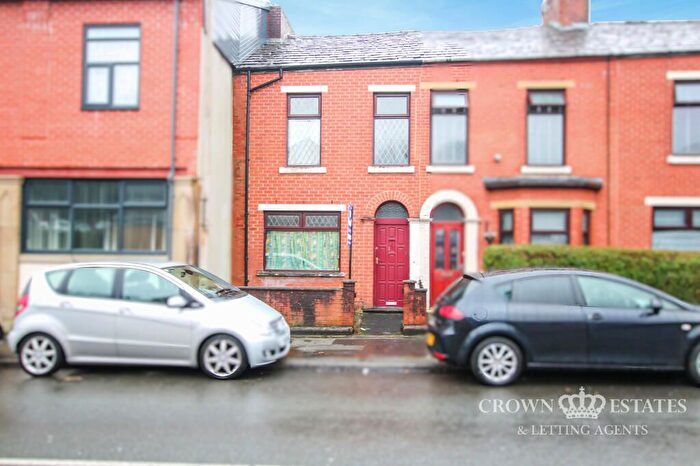
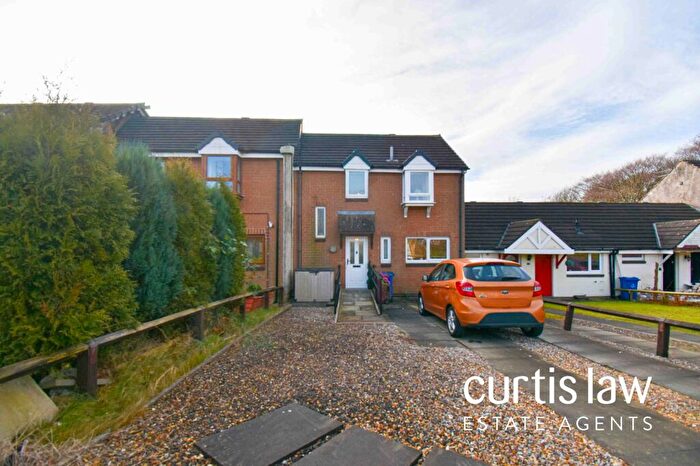
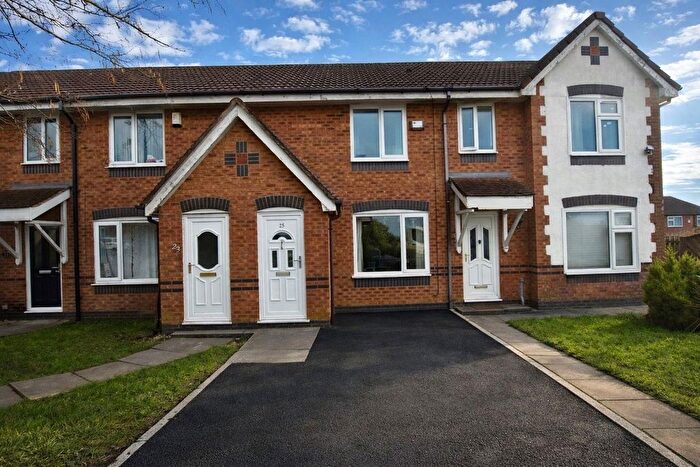
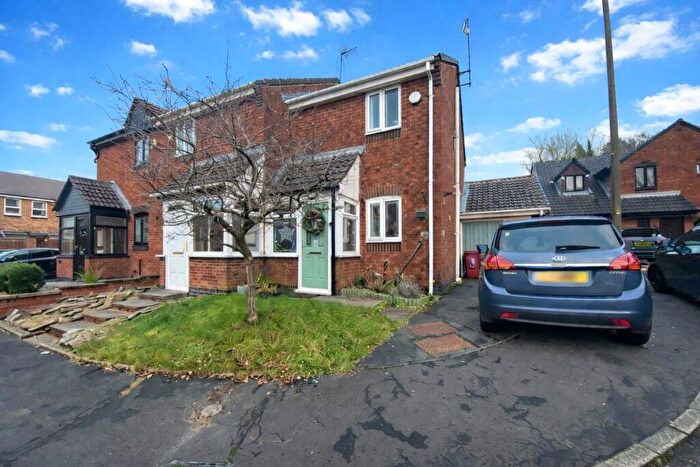
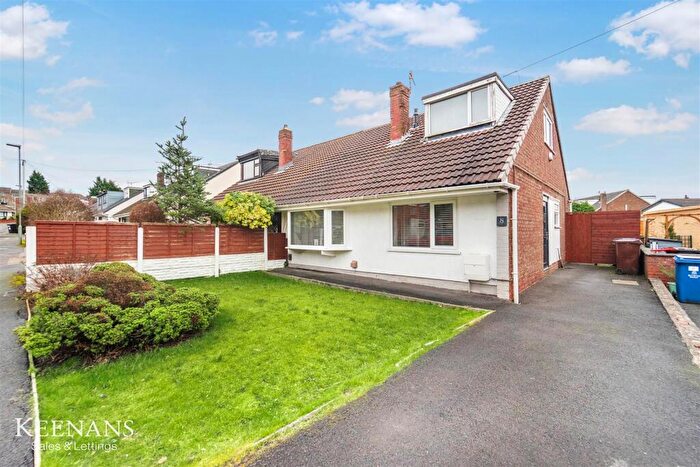
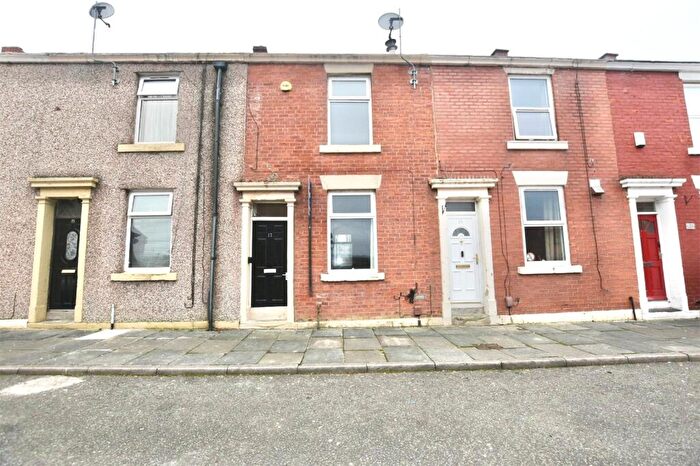
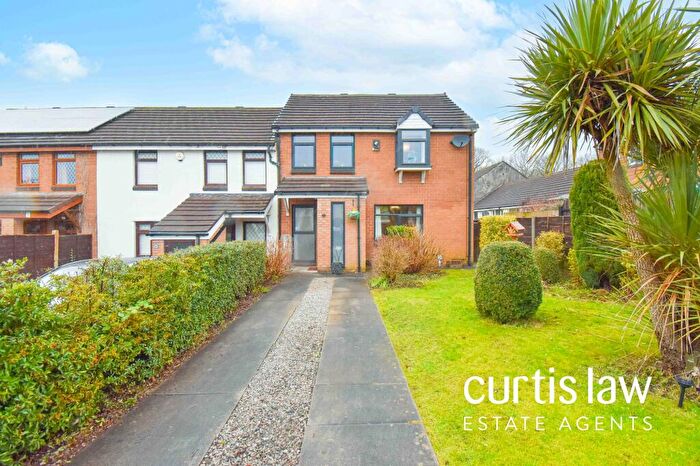
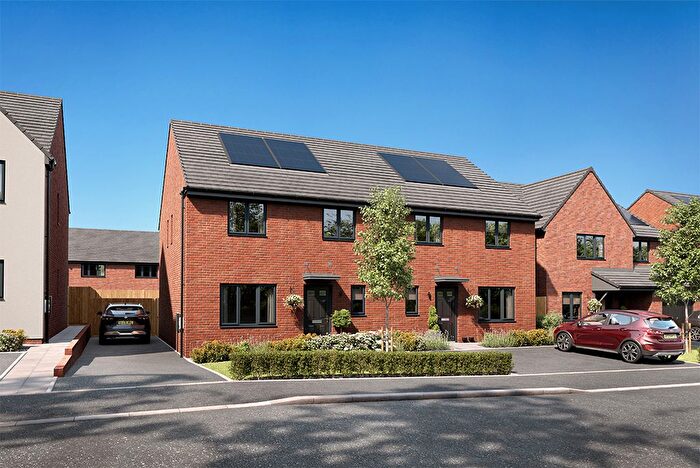
Houses for sale & to rent in Higher Croft, Blackburn
House Prices in Higher Croft
Properties in Higher Croft have an average house price of £137,563.00 and had 174 Property Transactions within the last 3 years¹.
Higher Croft is an area in Blackburn, Blackburn with Darwen with 2,277 households², where the most expensive property was sold for £370,000.00.
Properties for sale in Higher Croft
Roads and Postcodes in Higher Croft
Navigate through our locations to find the location of your next house in Higher Croft, Blackburn for sale or to rent.
| Streets | Postcodes |
|---|---|
| Ansdell Terrace | BB2 3JL |
| Aston Walk | BB2 3WH |
| Avebury Close | BB2 3WA |
| Beatrice Place | BB2 3UD |
| Bishopstone Close | BB2 3WD |
| Blackamoor Road | BB1 2LG |
| Bradda Road | BB2 3JP |
| Brandy House Brow | BB2 3EY |
| Britten Close | BB2 3TD |
| Britwell Close | BB2 3WN |
| Broughton Close | BB2 3TW |
| Childrey Walk | BB2 3WB |
| Cleveleys Road | BB2 3JS |
| Davyfield Road | BB1 2QY |
| Delius Close | BB2 3WS |
| Eastcott Close | BB2 3WJ |
| Elgar Close | BB2 3TE |
| Everton | BB2 3HA |
| Fairhaven Road | BB2 3EE |
| Faroes Close | BB2 3EL |
| Fishmoor Drive | BB2 3TJ BB2 3UJ |
| Fleetwood Close | BB2 3LB |
| Glasson Close | BB2 3LA |
| Guernsey Avenue | BB2 3EF |
| Holmbrook Close | BB2 3UG |
| Idstone Close | BB2 3WG |
| Laxey Road | BB2 3LH BB2 3LQ |
| Leopold Way | BB2 3UE |
| Liddington Close | BB2 3WQ |
| Lindisfarne Avenue | BB2 3EG BB2 3EH |
| Lytham Road | BB2 3EB BB2 3JD BB2 3JT |
| Manxman Road | BB2 3EP BB2 3ER BB2 3EW BB2 3JH BB2 3JJ BB2 3JQ BB2 3LG |
| Mona Road | BB2 3JN |
| Morecambe Road | BB2 3LF |
| Mowbray Avenue | BB2 3ET BB2 3EU |
| Newfield Drive | BB2 3UA |
| Newmeadow Close | BB2 3WY |
| Norbreck Close | BB2 3LD |
| Observatory Road | BB2 3HE |
| Old Bank Lane | BB2 3HG |
| Onchan Road | BB2 3NT |
| Park Lee Road | BB2 3EX BB2 3NX |
| Peel Close | BB2 3NG |
| Pickering Fold | BB1 2LH |
| Pilmuir Road | BB2 3HZ BB2 3JA BB2 3JB |
| Pleasant View | BB2 3HF |
| Ravenglass Close | BB2 3TY |
| Ridgeway Avenue | BB2 3WE |
| Roman Road | BB1 2LA BB1 2LB BB1 2LD BB2 3EA BB2 3EZ |
| Rossall Terrace | BB2 3JR |
| Sark Gardens | BB2 3EQ |
| Scarborough Road | BB2 3ED |
| Silbury Close | BB2 3WF |
| Snaefell Road | BB2 3JW BB2 3NR |
| Stanford Gardens | BB2 3TG |
| Streatly Walk | BB2 3WL |
| Sulby Road | BB2 3NU |
| Sullivan Drive | BB2 3TF |
| Sunny Bank Road | BB2 3NE |
| Thornton Close | BB2 3JY |
| Tippet Close | BB2 3WX |
| Tynwald Road | BB2 3NP BB2 3NS |
| Ulverston Close | BB2 3TX |
| Walney Gardens | BB2 3EJ |
| Walton Crescent | BB2 3TQ |
| Whitby Drive | BB2 3EN |
| Whitehaven Close | BB2 3TZ |
| Williams Drive | BB2 3WT |
| Woodsend Close | BB2 3WR |
Transport near Higher Croft
-
Blackburn Station
-
Mill Hill (Lancashire) Station
-
Cherry Tree Station
-
Darwen Station
-
Pleasington Station
- FAQ
- Price Paid By Year
- Property Type Price
Frequently asked questions about Higher Croft
What is the average price for a property for sale in Higher Croft?
The average price for a property for sale in Higher Croft is £137,563. This amount is 17% lower than the average price in Blackburn. There are 1,109 property listings for sale in Higher Croft.
What streets have the most expensive properties for sale in Higher Croft?
The streets with the most expensive properties for sale in Higher Croft are Stanford Gardens at an average of £284,333, Britten Close at an average of £282,500 and Elgar Close at an average of £278,500.
What streets have the most affordable properties for sale in Higher Croft?
The streets with the most affordable properties for sale in Higher Croft are Davyfield Road at an average of £56,400, Peel Close at an average of £72,000 and Laxey Road at an average of £94,500.
Which train stations are available in or near Higher Croft?
Some of the train stations available in or near Higher Croft are Blackburn, Mill Hill (Lancashire) and Cherry Tree.
Property Price Paid in Higher Croft by Year
The average sold property price by year was:
| Year | Average Sold Price | Price Change |
Sold Properties
|
|---|---|---|---|
| 2025 | £137,879 | -1% |
46 Properties |
| 2024 | £139,037 | 2% |
62 Properties |
| 2023 | £135,959 | -0,3% |
66 Properties |
| 2022 | £136,403 | 24% |
63 Properties |
| 2021 | £103,922 | -18% |
59 Properties |
| 2020 | £122,243 | 4% |
44 Properties |
| 2019 | £116,959 | 17% |
50 Properties |
| 2018 | £97,476 | -9% |
34 Properties |
| 2017 | £106,486 | 16% |
38 Properties |
| 2016 | £89,031 | 9% |
51 Properties |
| 2015 | £80,771 | -14% |
46 Properties |
| 2014 | £92,281 | 20% |
35 Properties |
| 2013 | £74,111 | 2% |
43 Properties |
| 2012 | £72,780 | -1% |
30 Properties |
| 2011 | £73,188 | -23% |
26 Properties |
| 2010 | £90,045 | 0,4% |
24 Properties |
| 2009 | £89,705 | -25% |
35 Properties |
| 2008 | £111,859 | 14% |
38 Properties |
| 2007 | £95,766 | 8% |
78 Properties |
| 2006 | £87,896 | 14% |
125 Properties |
| 2005 | £75,560 | 3% |
122 Properties |
| 2004 | £73,425 | 35% |
137 Properties |
| 2003 | £47,380 | 18% |
120 Properties |
| 2002 | £38,878 | -11% |
89 Properties |
| 2001 | £43,016 | -6% |
82 Properties |
| 2000 | £45,626 | - |
93 Properties |
| 1999 | £45,608 | 6% |
68 Properties |
| 1998 | £42,686 | 5% |
65 Properties |
| 1997 | £40,495 | -3% |
40 Properties |
| 1996 | £41,740 | 7% |
30 Properties |
| 1995 | £38,731 | - |
92 Properties |
Property Price per Property Type in Higher Croft
Here you can find historic sold price data in order to help with your property search.
The average Property Paid Price for specific property types in the last three years are:
| Property Type | Average Sold Price | Sold Properties |
|---|---|---|
| Semi Detached House | £148,025.00 | 68 Semi Detached Houses |
| Detached House | £257,268.00 | 11 Detached Houses |
| Terraced House | £117,782.00 | 92 Terraced Houses |
| Flat | £68,133.00 | 3 Flats |

