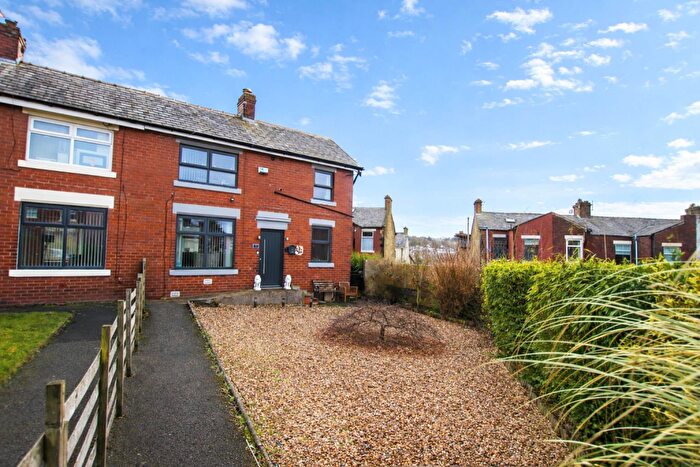
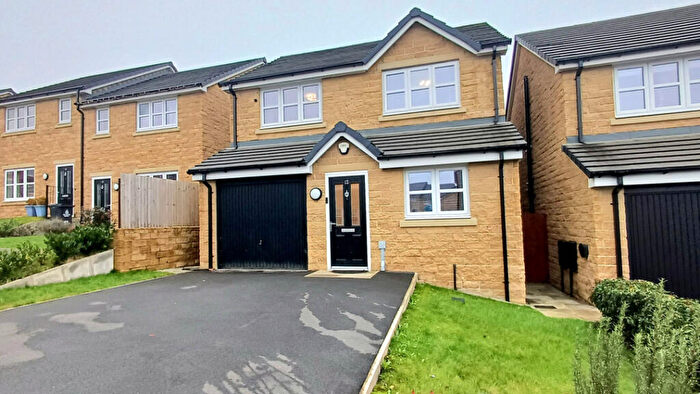
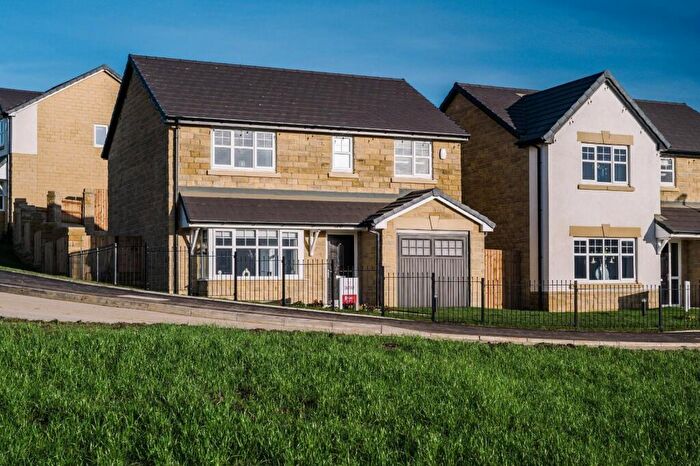
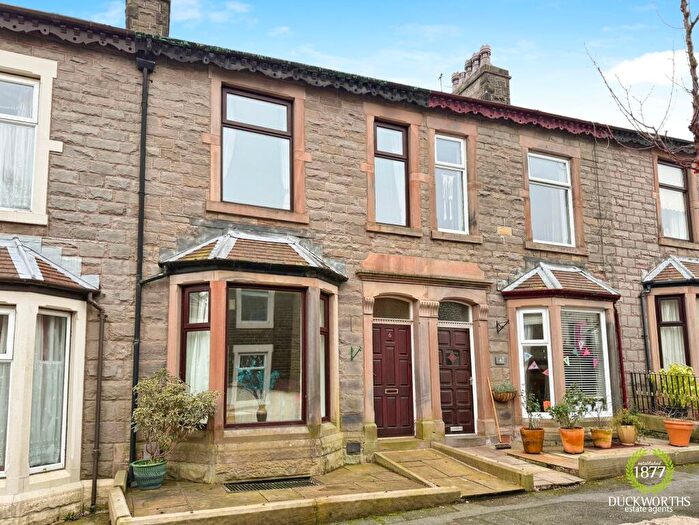
Houses for sale & to rent in Darwen, Blackburn with Darwen
House Prices in Darwen
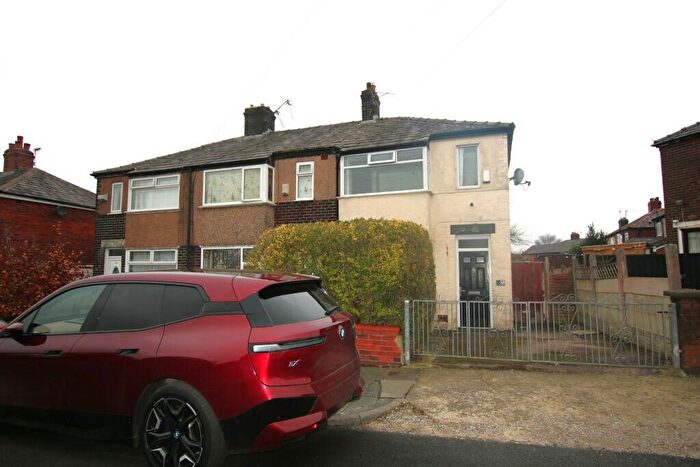
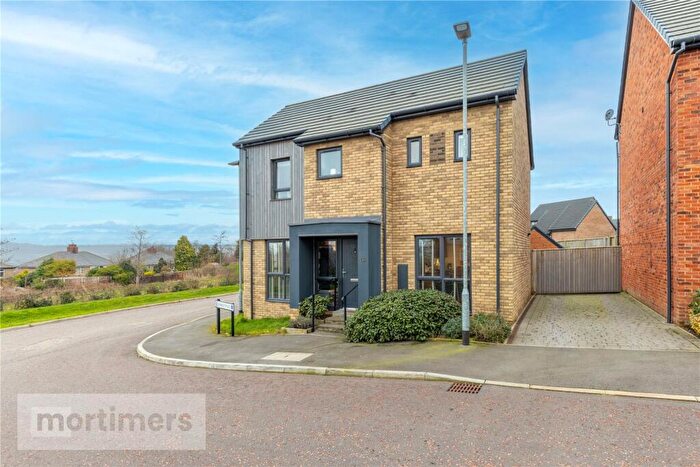
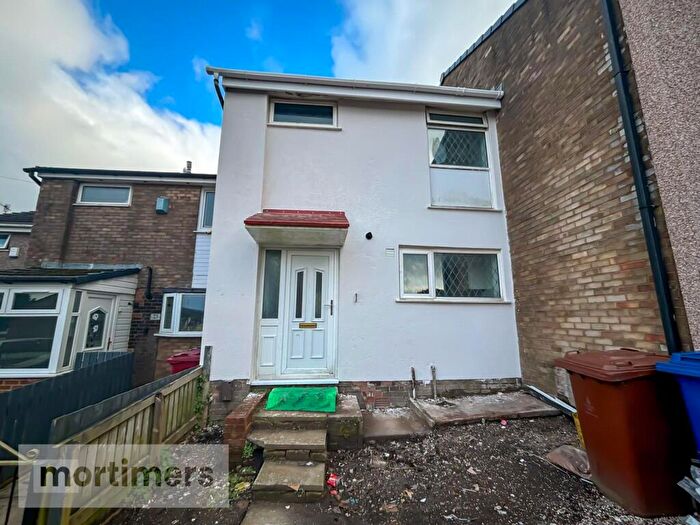
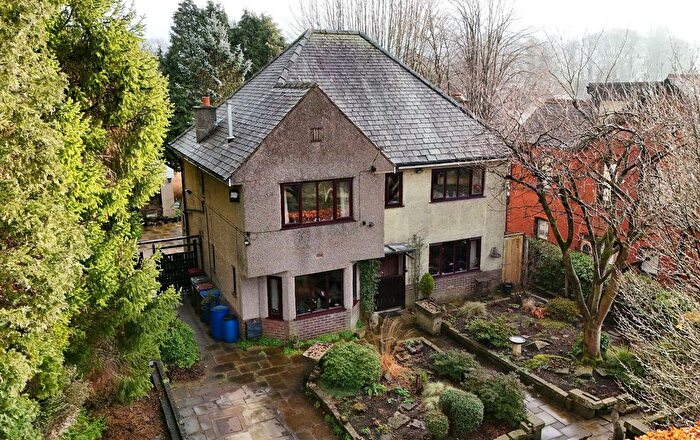
Properties in Darwen have an average house price of £152,286.00 and had 1,755 Property Transactions within the last 3 years.¹
Darwen is an area in Blackburn with Darwen with 14,765 households², where the most expensive property was sold for £855,000.00.
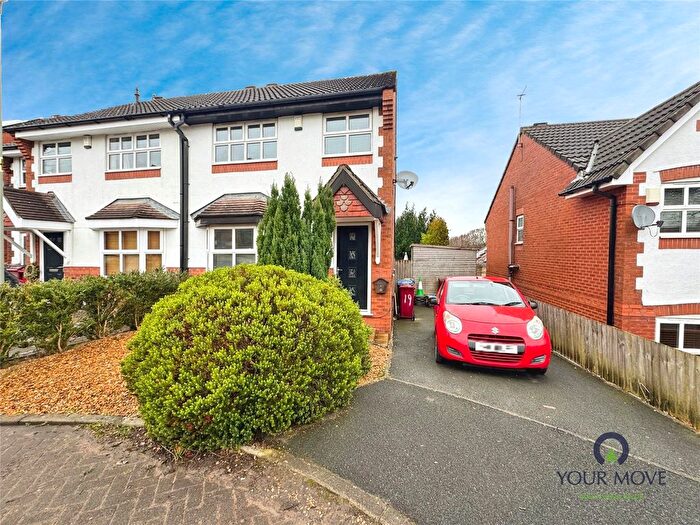
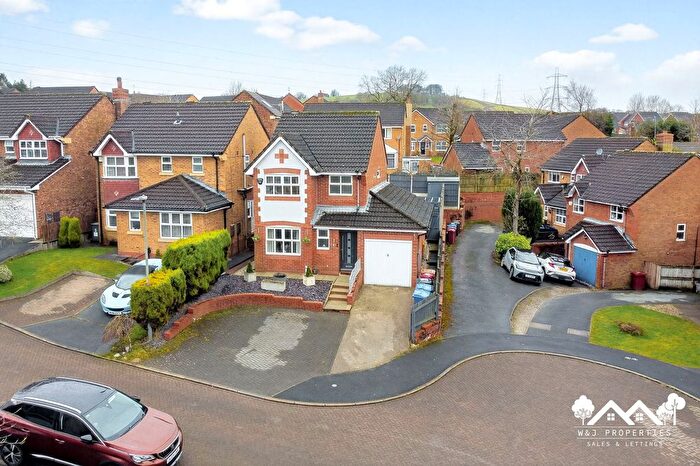
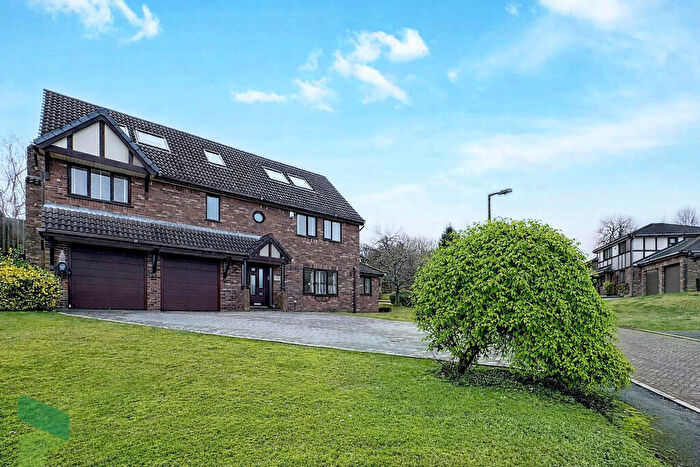
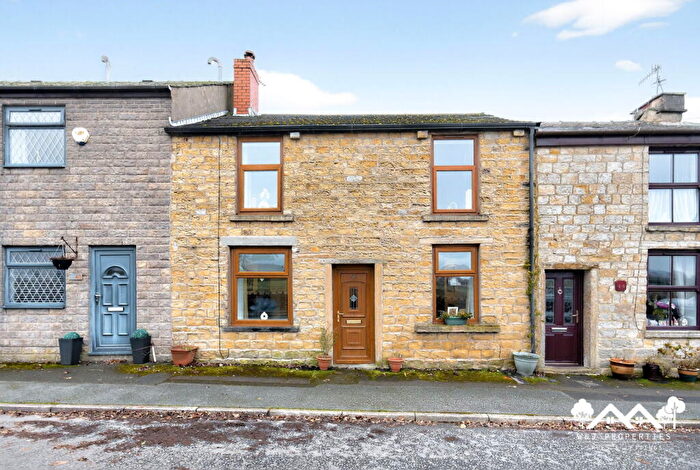
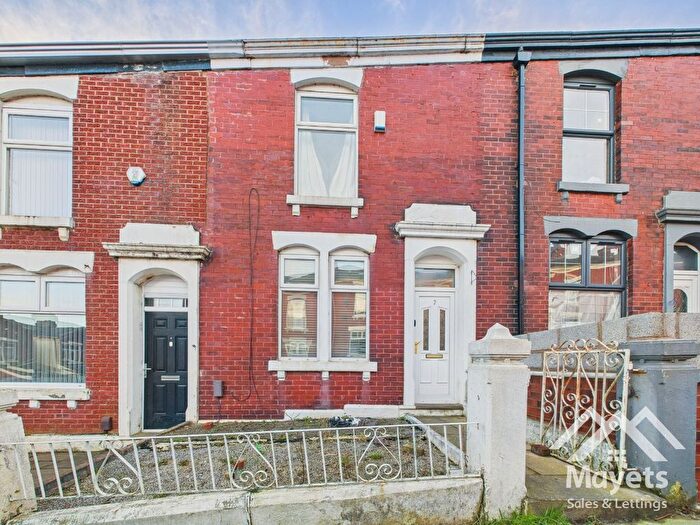
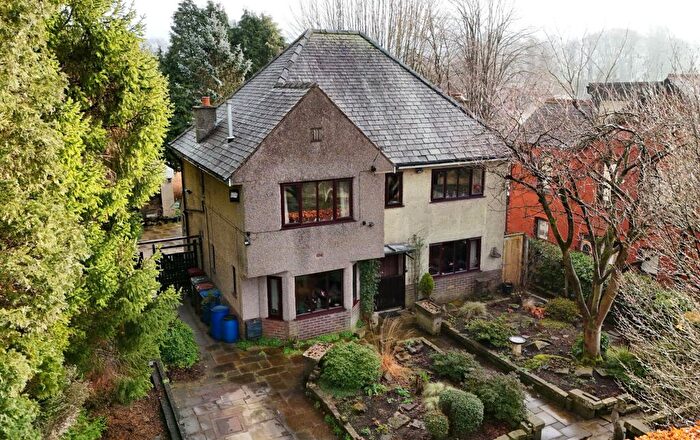
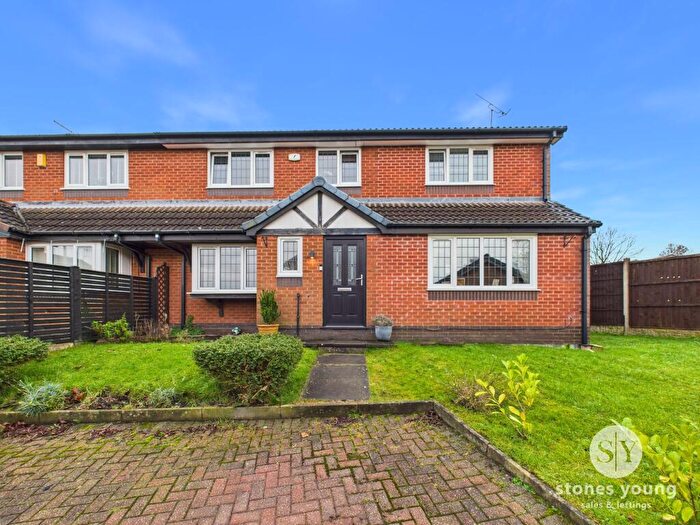
Properties for sale in Darwen
Neighbourhoods in Darwen
Navigate through our locations to find the location of your next house in Darwen, Blackburn with Darwen for sale or to rent.
Transport in Darwen
Please see below transportation links in this area:
-
Darwen Station
-
Mill Hill (Lancashire) Station
-
Cherry Tree Station
-
Blackburn Station
-
Entwistle Station
-
Pleasington Station
-
Church and Oswaldtwistle Station
-
Rishton Station
- FAQ
- Price Paid By Year
- Property Type Price
Frequently asked questions about Darwen
What is the average price for a property for sale in Darwen?
The average price for a property for sale in Darwen is £152,286. This amount is 9% lower than the average price in Blackburn with Darwen. There are 8,787 property listings for sale in Darwen.
What locations have the most expensive properties for sale in Darwen?
The locations with the most expensive properties for sale in Darwen are North Turton With Tockholes at an average of £448,708, West Pennine at an average of £383,000 and Darwen South at an average of £293,045.
What locations have the most affordable properties for sale in Darwen?
The locations with the most affordable properties for sale in Darwen are Sudell at an average of £101,372, Earcroft at an average of £121,887 and Sunnyhurst at an average of £153,153.
Which train stations are available in or near Darwen?
Some of the train stations available in or near Darwen are Darwen, Mill Hill (Lancashire) and Cherry Tree.
Property Price Paid in Darwen by Year
The average sold property price by year was:
| Year | Average Sold Price | Price Change |
Sold Properties
|
|---|---|---|---|
| 2025 | £159,373 | 7% |
501 Properties |
| 2024 | £148,596 | -1% |
685 Properties |
| 2023 | £150,490 | 1% |
569 Properties |
| 2022 | £149,736 | 2% |
663 Properties |
| 2021 | £146,438 | 8% |
811 Properties |
| 2020 | £134,875 | 10% |
641 Properties |
| 2019 | £121,543 | 3% |
697 Properties |
| 2018 | £118,212 | 0,3% |
615 Properties |
| 2017 | £117,810 | 6% |
655 Properties |
| 2016 | £111,247 | -0,4% |
626 Properties |
| 2015 | £111,662 | 6% |
562 Properties |
| 2014 | £105,362 | 3% |
532 Properties |
| 2013 | £102,030 | -3% |
438 Properties |
| 2012 | £105,493 | 2% |
314 Properties |
| 2011 | £102,905 | -2% |
322 Properties |
| 2010 | £104,553 | -4% |
360 Properties |
| 2009 | £108,686 | -5% |
329 Properties |
| 2008 | £113,943 | -1% |
456 Properties |
| 2007 | £114,780 | 11% |
1,041 Properties |
| 2006 | £102,030 | 10% |
1,180 Properties |
| 2005 | £92,088 | 12% |
1,003 Properties |
| 2004 | £80,652 | 19% |
1,185 Properties |
| 2003 | £65,698 | 13% |
1,252 Properties |
| 2002 | £57,459 | 13% |
1,007 Properties |
| 2001 | £50,021 | 6% |
987 Properties |
| 2000 | £47,207 | 2% |
819 Properties |
| 1999 | £46,133 | 5% |
806 Properties |
| 1998 | £43,616 | 4% |
746 Properties |
| 1997 | £42,061 | 4% |
826 Properties |
| 1996 | £40,432 | -2% |
748 Properties |
| 1995 | £41,063 | - |
659 Properties |
Property Price per Property Type in Darwen
Here you can find historic sold price data in order to help with your property search.
The average Property Paid Price for specific property types in the last three years are:
| Property Type | Average Sold Price | Sold Properties |
|---|---|---|
| Semi Detached House | £188,529.00 | 356 Semi Detached Houses |
| Detached House | £304,773.00 | 226 Detached Houses |
| Terraced House | £112,645.00 | 1,118 Terraced Houses |
| Flat | £96,908.00 | 55 Flats |

