
Houses for sale in Blackburn, Lancashire
House Prices in Blackburn
Properties in Blackburn have an average house price of £217k and had 1,658 Property Transactions within the last 3 years.¹
Blackburn is an area in Lancashire with 13,949 households², where the most expensive property was sold for £1.65M.
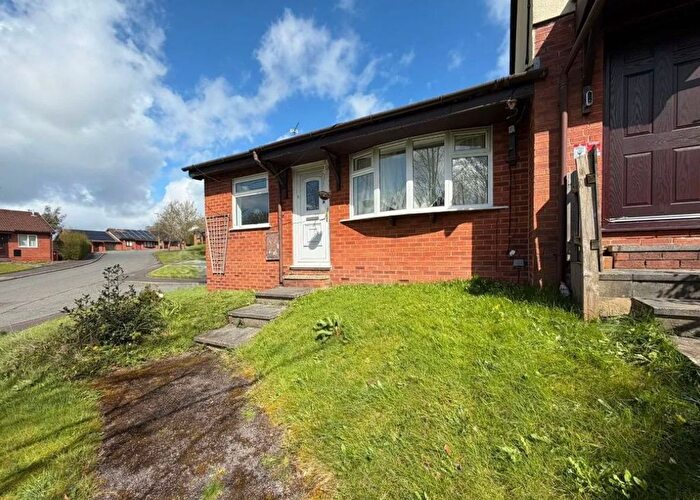
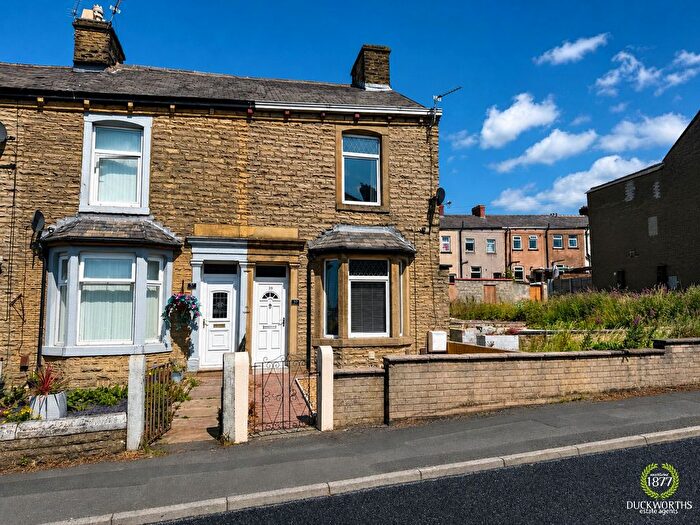
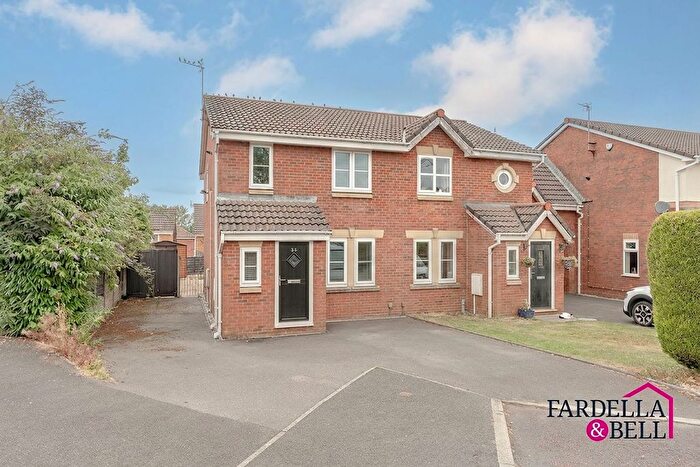
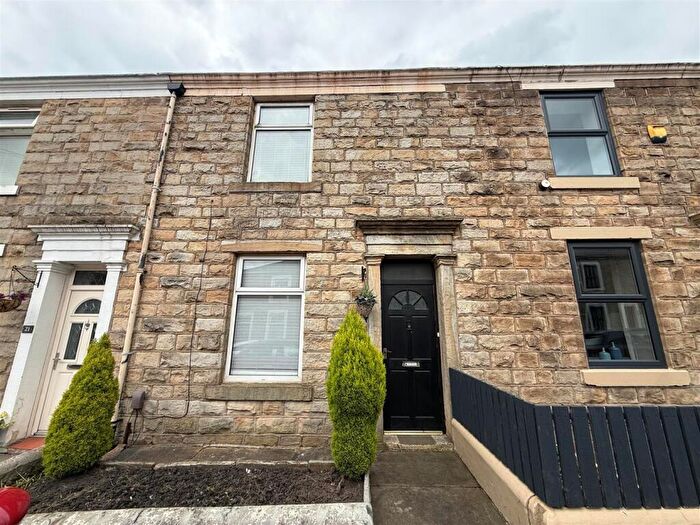
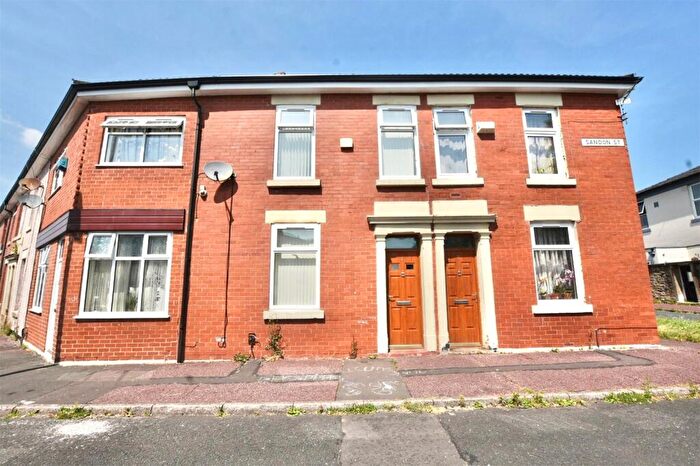
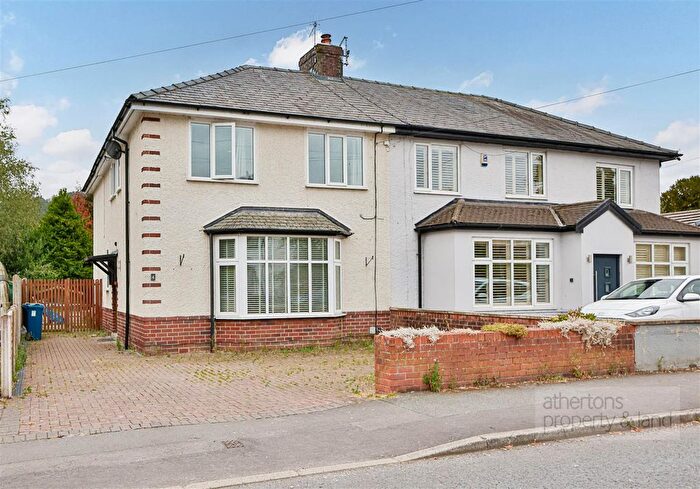
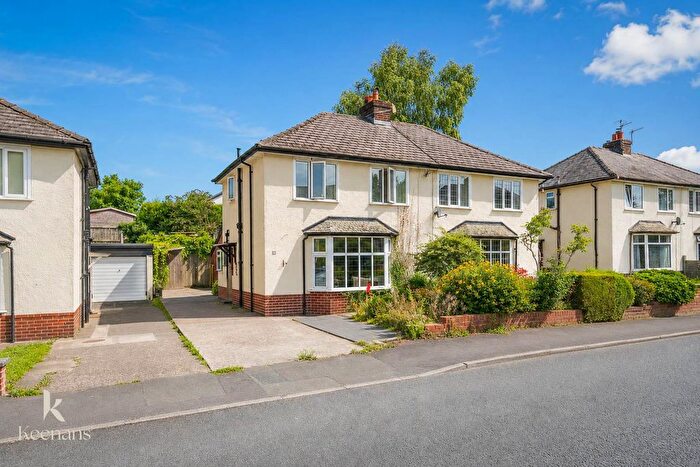
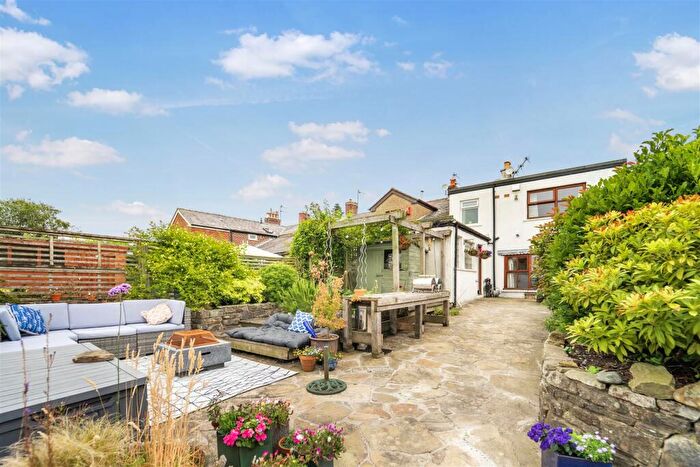
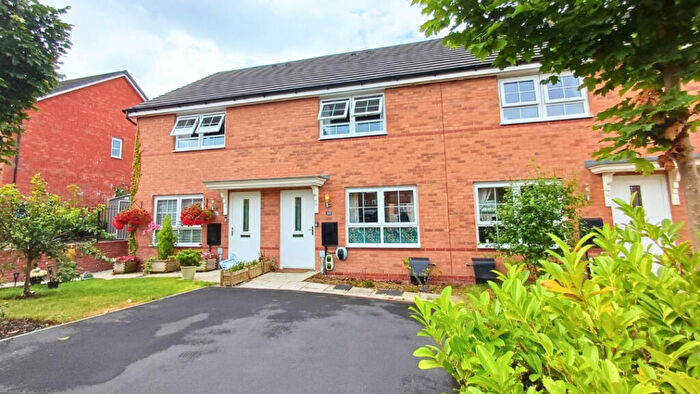
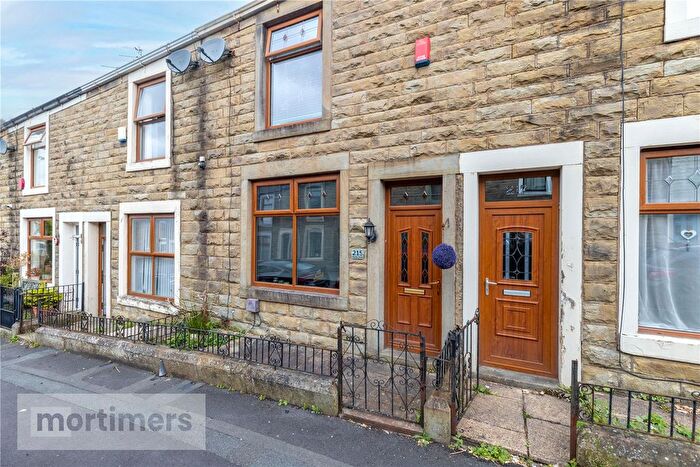
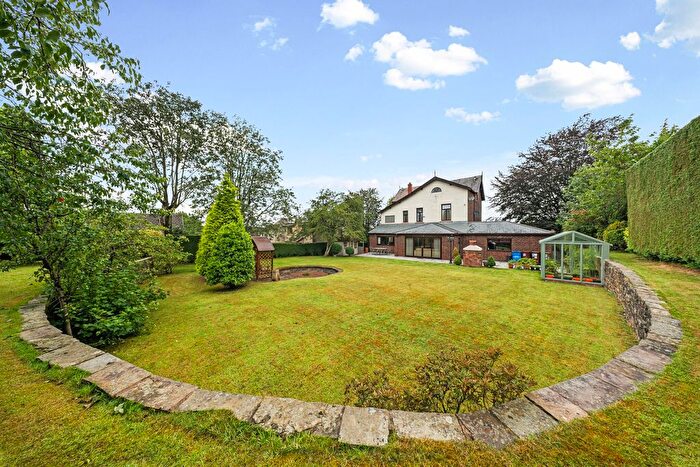
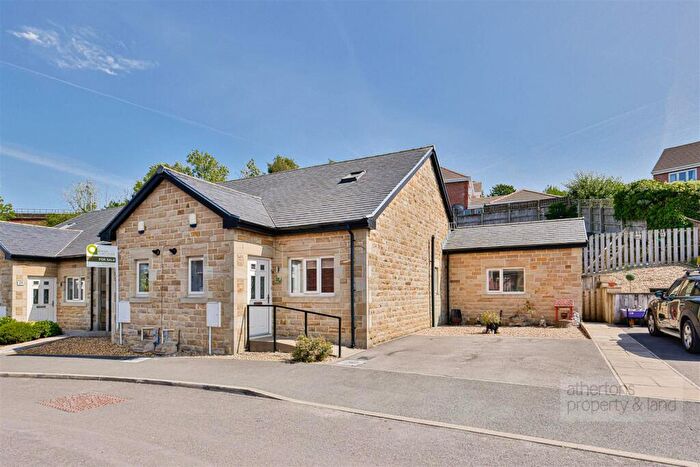
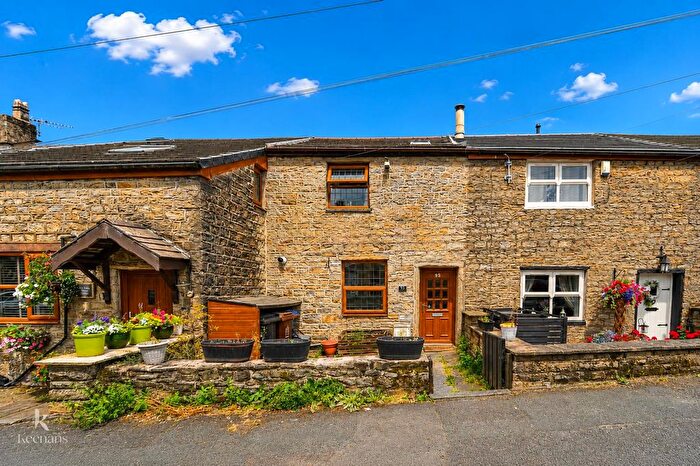
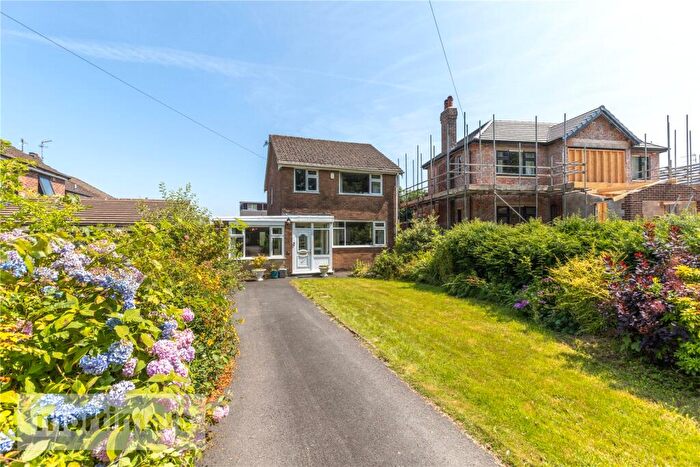
Properties for sale in Blackburn
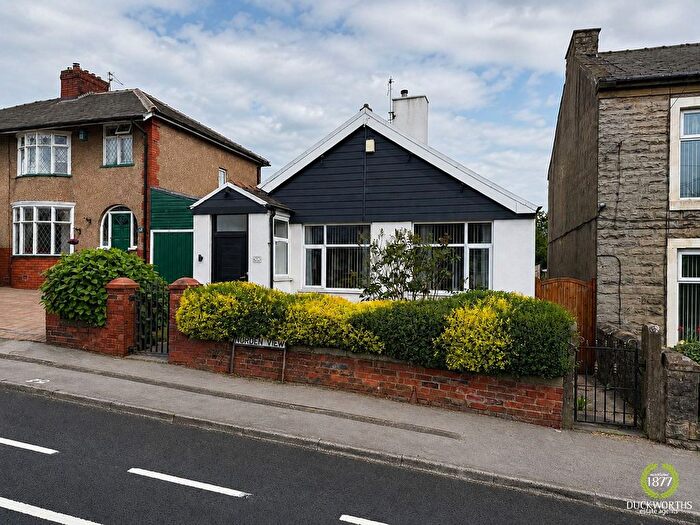
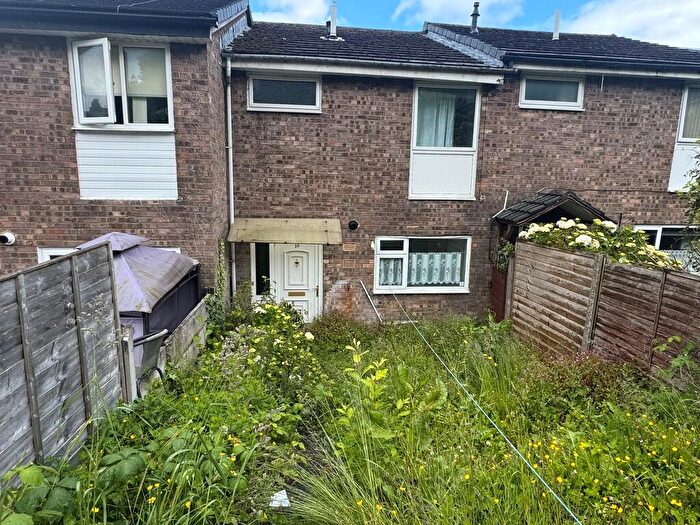


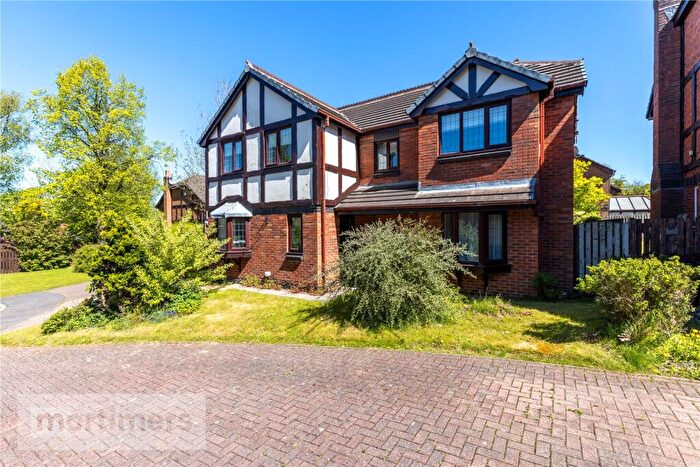
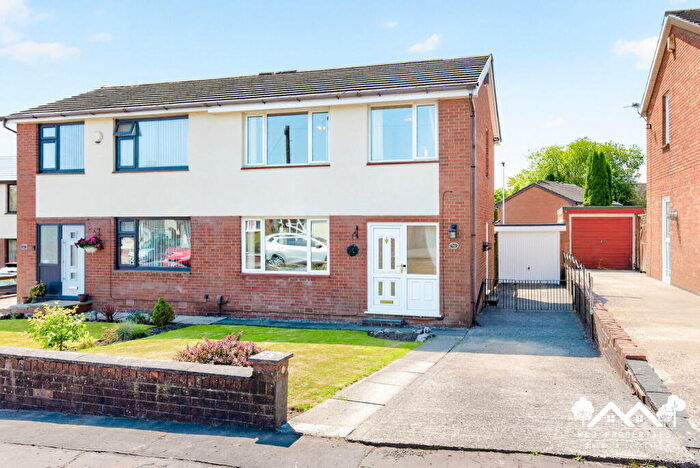
![]()
If you are looking to sell your house, let it out, or receive a property valuation, an expert can help you.
Click the button below to get started.

Neighbourhoods in Blackburn
Navigate through our locations to find the location of your next house in Blackburn, Lancashire for sale or to rent.
- Billington And Old Langho
- Brindle And Hoghton
- Clayton-le-dale With Ramsgreave
- Helmshore
- Immanuel
- Langho
- Mellor
- Netherton
- Overton
- Rishton
- Samlesbury And Walton
- St Oswalds
- Wilpshire
- Wilpshire & Ramsgreave
- Clayton-le-Dale & Salesbury
- Samlesbury & Walton
- Billington & Langho
- Brockhall & Dinckley
- Ewood
- Blackburn Central
- Blackburn South & Lower Darwen
- West Pennine
- Blackburn South East
- Audley & Queen's Park
- Little Harwood & Whitebirk
- Roe Lee
- Billinge & Beardwood
- Mill Hill & Moorgate
- Livesey With Pleasington
Property price trends in Blackburn
According to the latest Land Registry data, the average home in Blackburn sold for £222,882 in 2026. That figure comes from a substantial record of 18,763 sales logged over the past 31 years.
Prices have continued to climb over the last three years. Compared with 2023, when the typical sale came in around £207,494, that's a rise of roughly 7.4%.
Looking back five years, average prices are up about 7.1% since 2021, a gain of around £14,838 in cash terms.
Zoom out to the past decade for the fuller picture. Back in 2016, homes here averaged £162,719, so the typical sold price has climbed about 37% since then, roughly 3.2% a year. Stretch the view to fifteen years and that annual pace eases back to about 2.5%.
Frequently asked questions about Blackburn
What is the average price for a property for sale in Blackburn?
The average price for a property for sale in Blackburn is £217,417. This amount is 3% higher than the average price in Lancashire. There are more than 10,000 property listings for sale in Blackburn.
What locations have the most expensive properties for sale in Blackburn?
The locations with the most expensive properties for sale in Blackburn are Billington & Langho at an average of £850,000, Billington And Old Langho at an average of £523,136 and Clayton-le-Dale & Salesbury at an average of £410,800.
What locations have the most affordable properties for sale in Blackburn?
The locations with the most affordable properties for sale in Blackburn are Rishton at an average of £136,414, Netherton at an average of £138,225 and Overton at an average of £167,821.
Which train stations are available in or near Blackburn?
Some of the train stations available in or near Blackburn are Ramsgreave and Wilpshire, Rishton and Langho.
Property Price Paid in Blackburn by Year
The average sold property price by year was:
| Year | Average Sold Price | Price Change |
Sold Properties
|
|---|---|---|---|
| 2026 | £222,882 | -3% |
39 Properties |
| 2025 | £228,757 | 6% |
537 Properties |
| 2024 | £215,233 | 4% |
573 Properties |
| 2023 | £207,494 | 3% |
509 Properties |
| 2022 | £200,565 | -4% |
584 Properties |
| 2021 | £208,044 | 13% |
712 Properties |
| 2020 | £181,394 | 7% |
581 Properties |
| 2019 | £169,469 | 1% |
639 Properties |
| 2018 | £168,565 | -2% |
576 Properties |
| 2017 | £172,675 | 6% |
590 Properties |
Property Price per Property Type in Blackburn
Here you can find historic sold price data in order to help with your property search.
The average Property Paid Price for specific property types in the last three years are:
| Property Type | Average Sold Price | Sold Properties |
|---|---|---|
| Semi Detached House | £225,402.00 | 492 Semi Detached Houses |
| Detached House | £398,777.00 | 389 Detached Houses |
| Terraced House | £119,094.00 | 744 Terraced Houses |
| Flat | £177,254.00 | 33 Flats |
Transport in Blackburn
Please see below transportation links in this area:
