
Houses for sale & to rent in Bloomfield, Blackpool
House Prices in Bloomfield
Properties in Bloomfield have an average house price of £89k and had 407 Property Transactions within the last 3 years¹.
Bloomfield is an area in Blackpool, Blackpool with 3,143 households², where the most expensive property was sold for £839k.
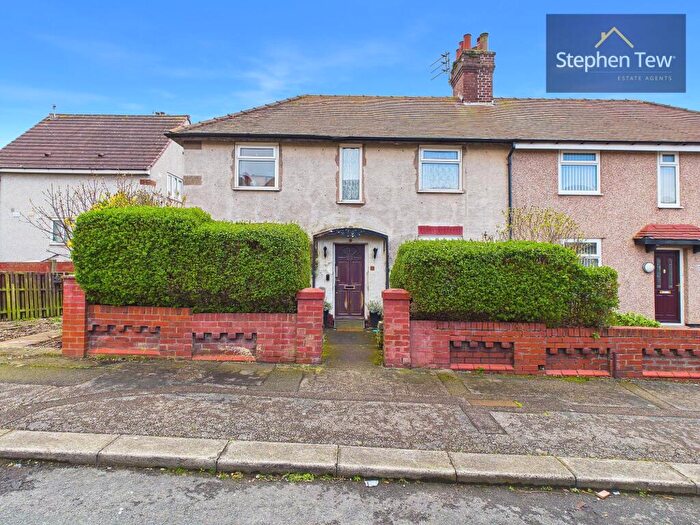
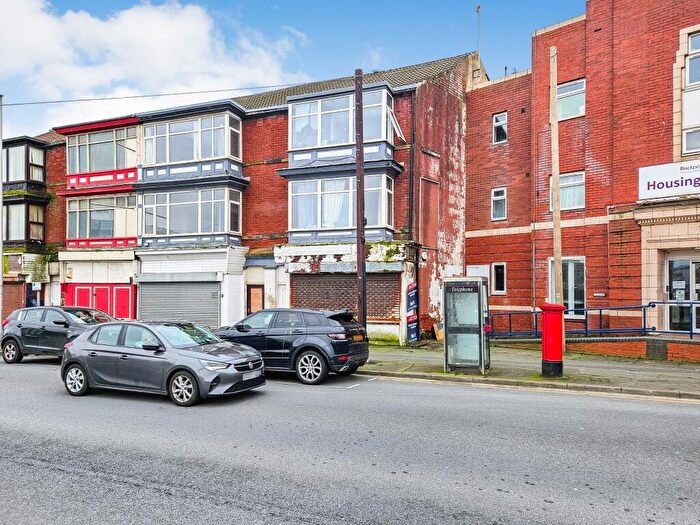
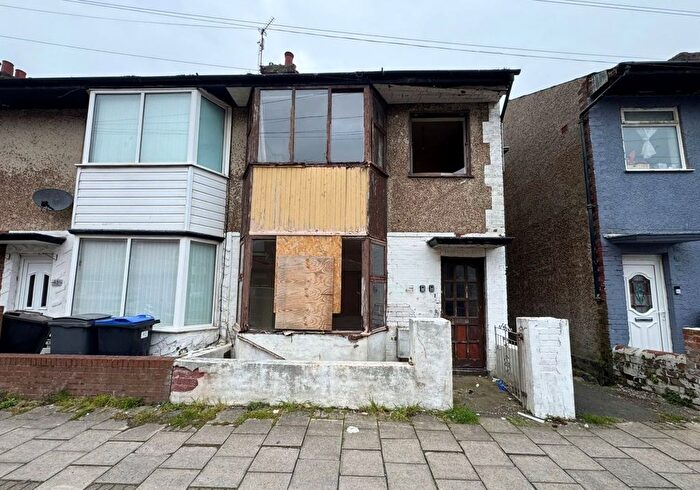
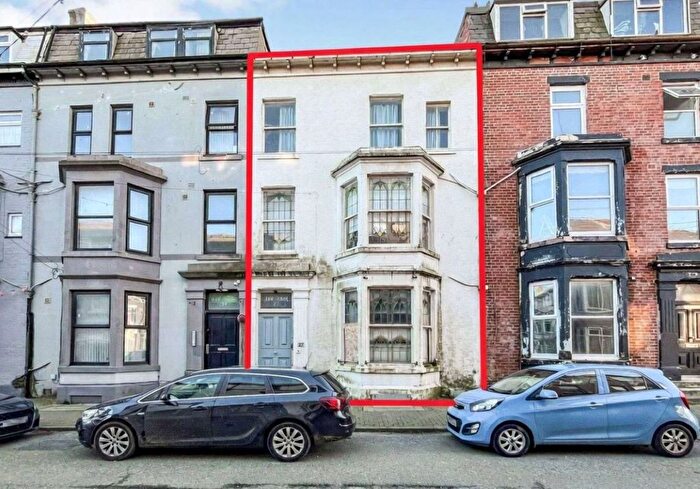
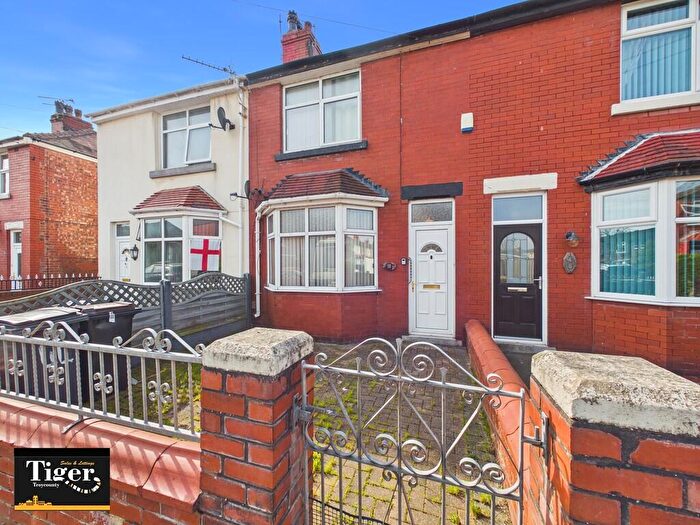
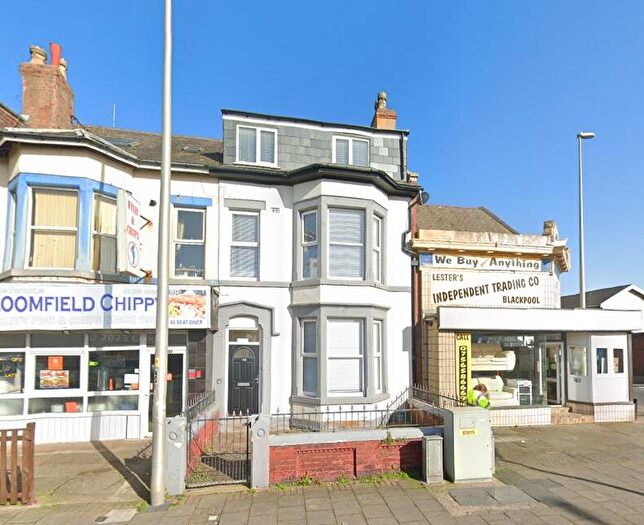
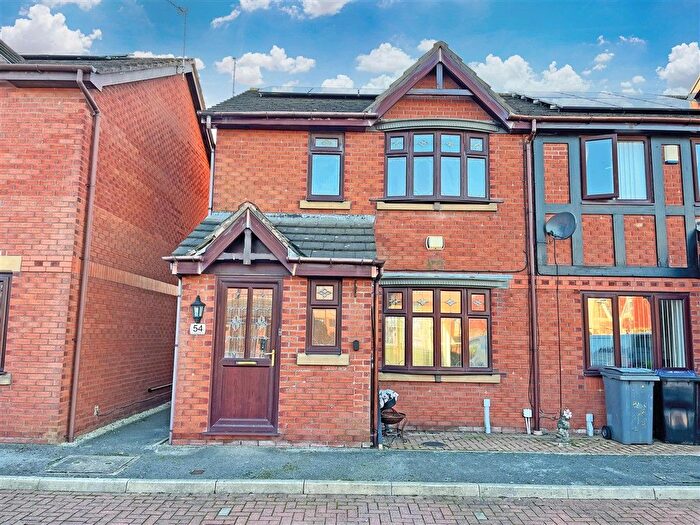
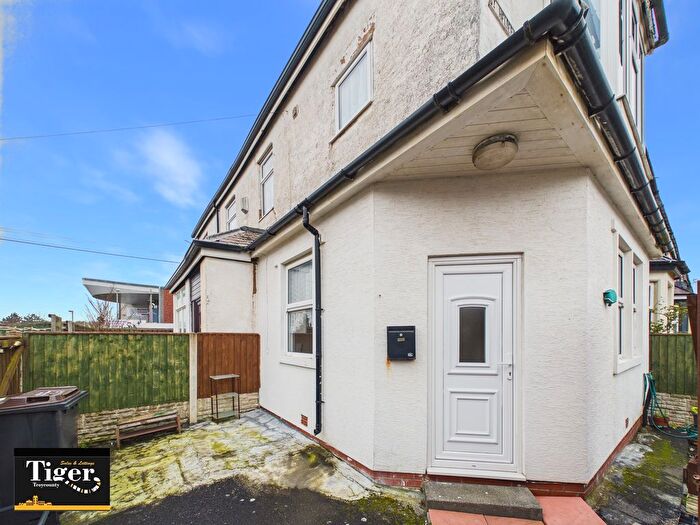
Properties for sale in Bloomfield
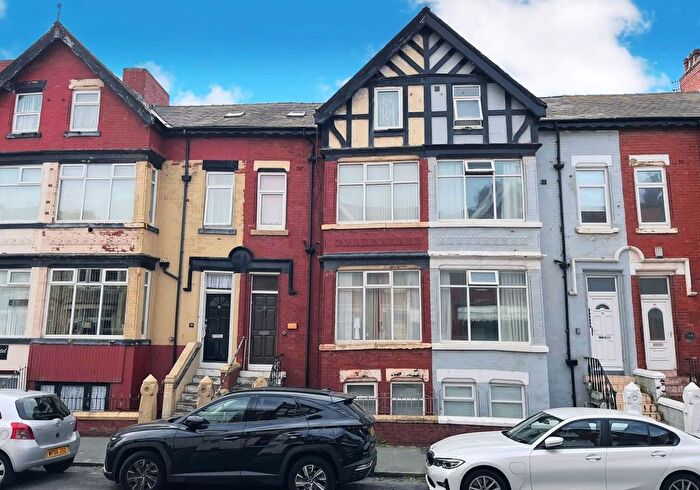
![]()
If you are looking to sell your house, let it out, or receive a property valuation, an expert can help you.
Click the button below to get started.


Roads and Postcodes in Bloomfield
Navigate through our locations to find the location of your next house in Bloomfield, Blackpool for sale or to rent.
| Streets | Postcodes |
|---|---|
| Adrian Street | FY1 6DA |
| Alexandra Road | FY1 6BU FY1 6BY FY1 6HW |
| Amberbanks Grove | FY1 6DW |
| Anderson Street | FY1 4AN |
| Ashton Road | FY1 4AQ |
| Austin Grove | FY1 6BT |
| Back Clarendon Road | FY1 6EG |
| Back Hilton Avenue | FY1 6DD |
| Back Ribble Road | FY1 4AD |
| Bagot Street | FY1 6EZ |
| Bairstow Street | FY1 5BN |
| Ball Street | FY1 6HL FY1 6HZ |
| Barham Street | FY1 6EL |
| Baron Road | FY1 6JU |
| Barton Avenue | FY1 6AP |
| Belmont Avenue | FY1 4BE FY1 4BG |
| Bethesda Road | FY1 5DT |
| Bickerstaffe Street | FY1 5BS |
| Bloomfield Road | FY1 6DH FY1 6JL |
| Blundell Street | FY1 5DB FY1 5DX |
| Bolton Street | FY1 6AA FY1 6AB FY1 6AE FY1 6AQ FY1 6AG |
| Caroline Street | FY1 5BU |
| Castlegate | FY1 6HJ |
| Central Drive | FY1 5DS FY1 5DY FY1 5EA FY1 5EB FY1 5ED FY1 5EE FY1 5HX FY1 5JN FY1 6LB FY1 6LD FY1 6LE FY1 5HZ |
| Chadwick Street | FY1 5EJ |
| Chapel Street | FY1 5AW FY1 5HF FY1 5AE FY1 5DA |
| Clare Street | FY1 6HR |
| Clarendon Road | FY1 6EF |
| Clinton Avenue | FY1 4AE |
| Commercial Street | FY1 6BG |
| Coop Street | FY1 5AJ |
| Cragg Street | FY1 5AP |
| Crystal Road | FY1 6BS |
| Dale Street | FY1 5AF FY1 5BP FY1 5BX FY1 5BY |
| Dale Street Mews | FY1 5AG |
| Duke Street | FY1 6HN |
| Elland Place | FY1 6HX |
| Erdington Road | FY1 5EG FY1 5EH FY1 5EL |
| Field Street | FY1 5JD FY1 5JE |
| Foxhall Road | FY1 5AD FY1 5BW FY1 5AB FY1 5BL |
| Foxhall Square | FY1 5BJ |
| Freckleton Street | FY1 4AW |
| Gadsby Street | FY1 6AT |
| Garrett Gardens | FY1 5FE |
| Grasmere Road | FY1 5HU |
| Haig Road | FY1 6BZ |
| Harrison Street | FY1 4AP |
| Henry Street | FY1 5JG |
| Hilton Avenue | FY1 6HF |
| Hopton Road | FY1 6EA |
| Hyde Road | FY1 6EQ |
| Ibbison Court | FY1 4AT FY1 4AU |
| Jameson Street | FY1 4AJ |
| John Street | FY1 6DG |
| Johnston Street | FY1 5FL |
| Kent Road | FY1 5HB FY1 5HH FY1 5HQ FY1 5ET |
| Kirby Road | FY1 6EB |
| Livingstone Road | FY1 4BU |
| Lonsdale Road | FY1 6EE |
| Louise Street | FY1 5EF FY1 5HA |
| Lowrey Terrace | FY1 6DR |
| Lytham Road | FY1 6DJ FY1 6DL FY1 6DN FY1 6DS FY1 6DT FY1 6DU FY1 6DX FY1 6DY FY1 6DZ FY1 6ET FY1 6EU FY1 6EX FY1 6EY FY1 6ES |
| Maudland Road | FY1 6JQ |
| Middle Street | FY1 5EZ |
| Miller Street | FY1 6HE |
| Montrose Avenue | FY1 4AS |
| Moon Avenue | FY1 6EH |
| Mudie Place | FY1 5FH |
| Nelson Road | FY1 6AS |
| Orme Street | FY1 4AL |
| Palatine Road | FY1 4BX |
| Park Road | FY1 4ET |
| Pennine Close | FY1 4BH |
| Perry Place | FY1 5FD |
| Pier Street | FY1 5AH |
| Princess Court | FY1 5EX |
| Princess Street | FY1 5BZ FY1 5EQ |
| Promenade | FY1 6AH FY1 6AJ FY1 5BE FY1 5BQ FY1 5DL FY1 6AL FY1 6AN FY1 6BH FY1 6BJ FY1 6BL FY1 6BN FY1 6BQ FY1 5BB |
| Ribble Road | FY1 4AA FY1 4AB |
| Rigby Road | FY1 5DE FY1 5DD FY1 5EP |
| Robinson Road | FY1 5FG |
| Royle Street | FY1 6HU |
| Ruskin Avenue | FY1 6HP |
| Rydal Avenue | FY1 4AR |
| Salthouse Avenue | FY1 5EN |
| Saville Road | FY1 6JP FY1 6JR FY1 6JS FY1 6JT |
| Seasiders Way | FY1 6EN FY1 6JJ FY1 6JX FY1 6NZ |
| Seymour Road | FY1 6JH |
| Shannon Street | FY1 5AL |
| Shaw Road | FY1 6HA FY1 6HB FY1 6DB FY1 6HD |
| Singleton Street | FY1 5AX FY1 5BT FY1 5AN |
| Sir Stanley Matthews Way East | FY1 5FJ |
| Sir Stanley Matthews Way West | FY1 5FN |
| St Bedes Avenue | FY4 1AQ |
| St Chads Road | FY1 6BP |
| St Heliers Road | FY1 6JD FY1 6JE FY1 6JF |
| Stan Mortensen Avenue | FY1 5FA |
| Stansfield Street | FY1 6JB FY1 6BW |
| Sutton Place | FY1 4BD |
| Taylor Terrace | FY1 5FB |
| Trafalgar Road | FY1 6AW |
| Tyldesley Road | FY1 5DF FY1 5DH |
| Ward Street | FY1 6HQ |
| Waterloo Road | FY4 1AB FY4 2AF FY4 2AA |
| Wellington Road | FY1 6AR |
| West View Avenue | FY1 6HT |
| Westbourne Avenue | FY1 6JA |
| Wolsley Road | FY1 6HG |
| Woodfield Avenue | FY1 6AY |
| Woodfield Road | FY1 6AX |
| Woolman Road | FY1 4AH |
| York Street | FY1 5AQ |
| Yorkshire Street | FY1 5BF FY1 5BG |
| FY1 5BD |
Transport near Bloomfield
-
 Blackpool South Station
 -
Blackpool North Station
-
Blackpool Pleasure Beach Station
-
Squires Gate Station
-
Layton Station
- FAQ
- Price Paid By Year
- Property Type Price
Frequently asked questions about Bloomfield
What is the average price for a property for sale in Bloomfield?
The average price for a property for sale in Bloomfield is £88,901. This amount is 35% lower than the average price in Blackpool. There are 2,170 property listings for sale in Bloomfield.
What streets have the most expensive properties for sale in Bloomfield?
The streets with the most expensive properties for sale in Bloomfield are Dale Street at an average of £839,250, Baron Road at an average of £270,000 and Taylor Terrace at an average of £162,000.
What streets have the most affordable properties for sale in Bloomfield?
The streets with the most affordable properties for sale in Bloomfield are Singleton Street at an average of £45,250, Adrian Street at an average of £54,700 and Promenade at an average of £55,323.
Which train stations are available in or near Bloomfield?
Some of the train stations available in or near Bloomfield are Blackpool South, Blackpool North and Blackpool Pleasure Beach.
Property Price Paid in Bloomfield by Year
The average sold property price by year was:
| Year | Average Sold Price | Price Change |
Sold Properties
|
|---|---|---|---|
| 2026 | £120,500 | 22% |
4 Properties |
| 2025 | £93,504 | 2% |
99 Properties |
| 2024 | £92,016 | 11% |
148 Properties |
| 2023 | £82,214 | -21% |
156 Properties |
| 2022 | £99,190 | 13% |
192 Properties |
| 2021 | £86,533 | -8% |
133 Properties |
| 2020 | £93,594 | 8% |
97 Properties |
| 2019 | £85,848 | 7% |
115 Properties |
| 2018 | £79,768 | -31% |
100 Properties |
| 2017 | £104,249 | 25% |
122 Properties |
| 2016 | £78,035 | 0,1% |
131 Properties |
| 2015 | £77,968 | 16% |
105 Properties |
| 2014 | £65,145 | -1% |
99 Properties |
| 2013 | £65,516 | 7% |
80 Properties |
| 2012 | £60,750 | -22% |
52 Properties |
| 2011 | £74,408 | -10% |
73 Properties |
| 2010 | £81,486 | -5% |
72 Properties |
| 2009 | £85,852 | -21% |
94 Properties |
| 2008 | £103,537 | -5% |
124 Properties |
| 2007 | £109,121 | 4% |
246 Properties |
| 2006 | £104,809 | 7% |
293 Properties |
| 2005 | £97,528 | 12% |
286 Properties |
| 2004 | £85,771 | 20% |
332 Properties |
| 2003 | £68,598 | 16% |
373 Properties |
| 2002 | £57,633 | 20% |
307 Properties |
| 2001 | £46,078 | 1% |
227 Properties |
| 2000 | £45,657 | 14% |
189 Properties |
| 1999 | £39,333 | 6% |
164 Properties |
| 1998 | £37,104 | 1% |
171 Properties |
| 1997 | £36,562 | 2% |
177 Properties |
| 1996 | £35,670 | -9% |
144 Properties |
| 1995 | £38,855 | - |
138 Properties |
Property Price per Property Type in Bloomfield
Here you can find historic sold price data in order to help with your property search.
The average Property Paid Price for specific property types in the last three years are:
| Property Type | Average Sold Price | Sold Properties |
|---|---|---|
| Flat | £48,408.00 | 39 Flats |
| Semi Detached House | £121,164.00 | 27 Semi Detached Houses |
| Detached House | £281,781.00 | 8 Detached Houses |
| Terraced House | £86,393.00 | 333 Terraced Houses |