
Houses for sale & to rent in Talbot, Blackpool
House Prices in Talbot
Properties in Talbot have an average house price of £136k and had 392 Property Transactions within the last 3 years¹.
Talbot is an area in Blackpool, Blackpool with 3,060 households², where the most expensive property was sold for £1.3M.
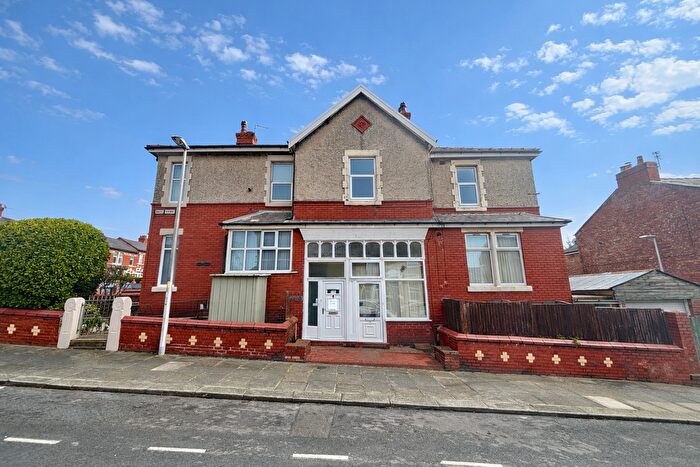
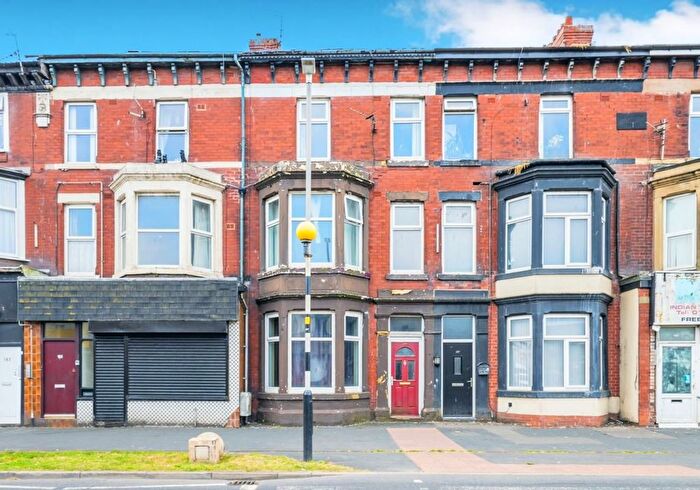
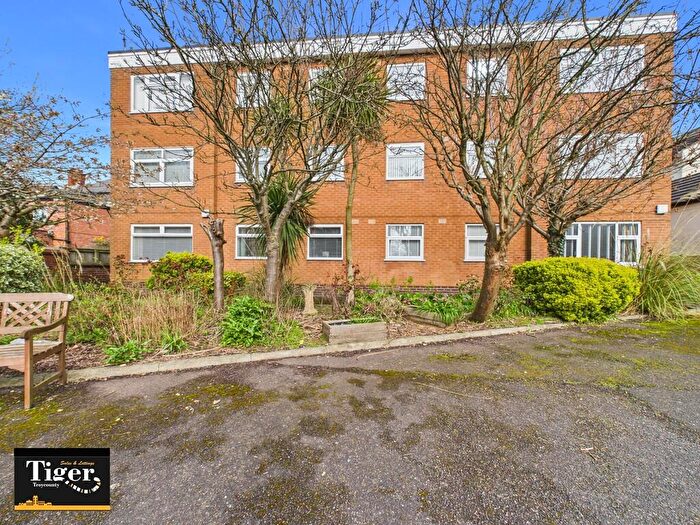
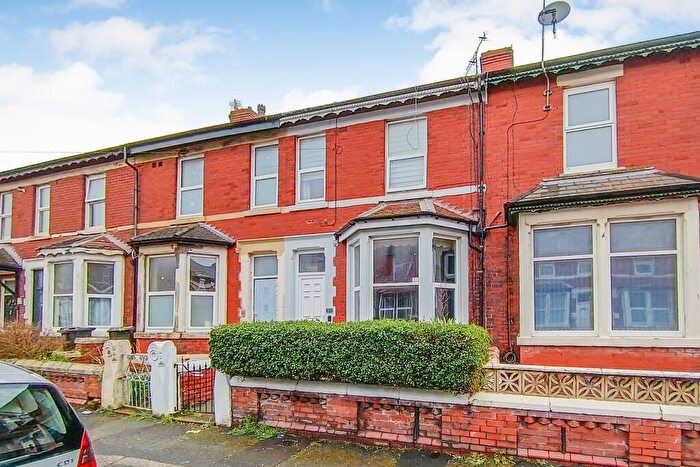
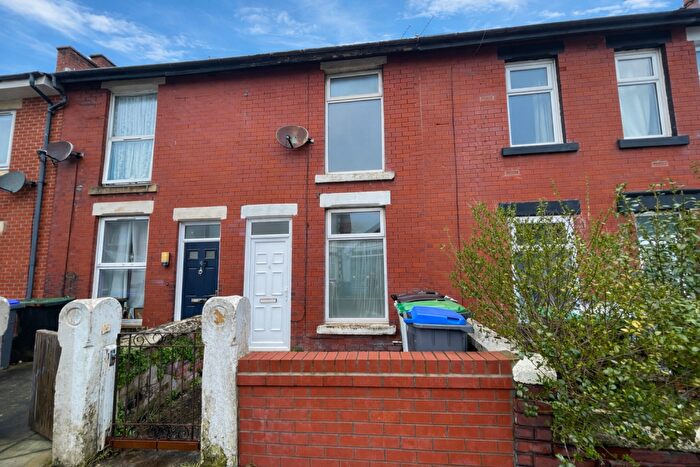
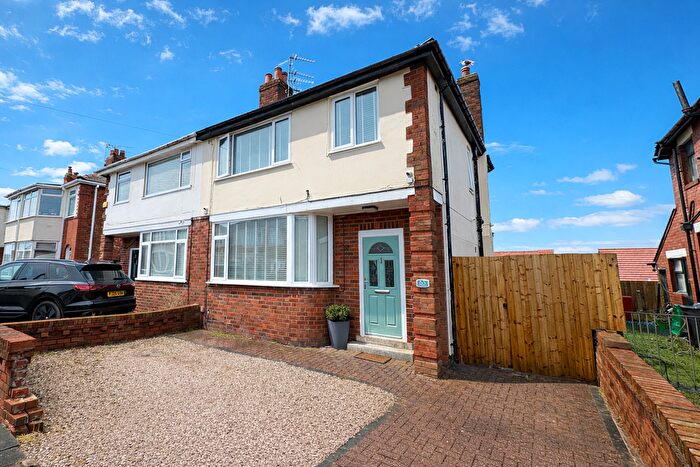
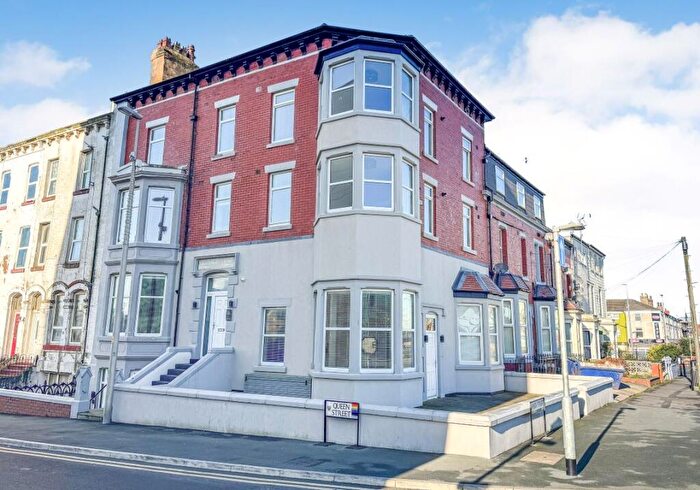
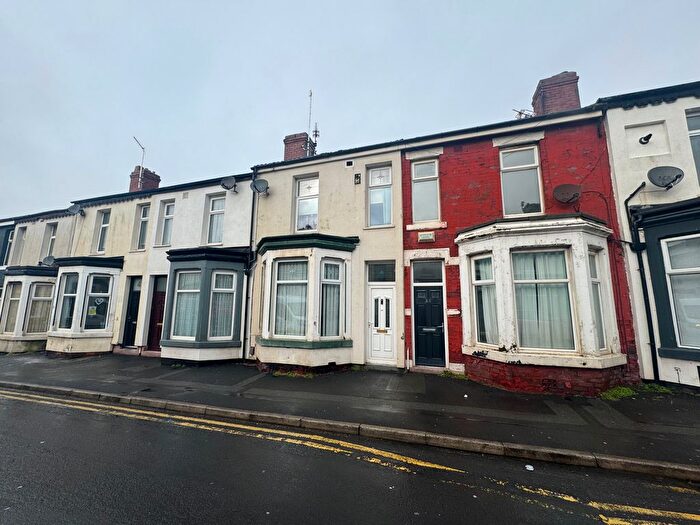
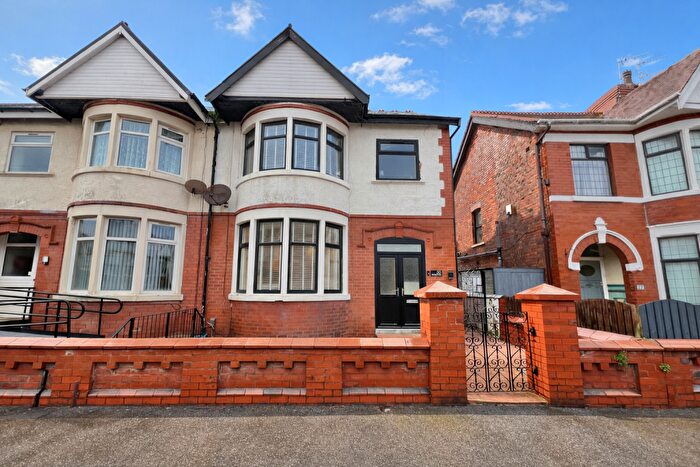
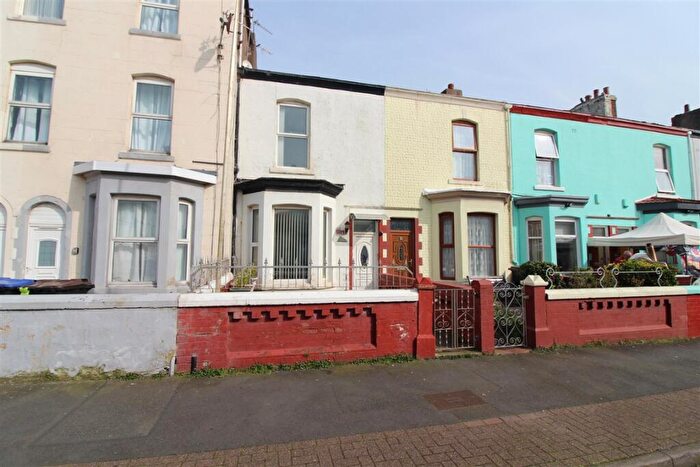
Properties for sale in Talbot
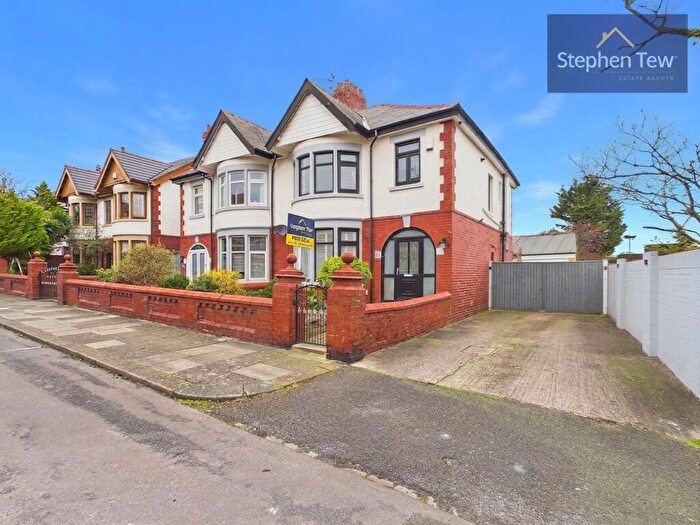
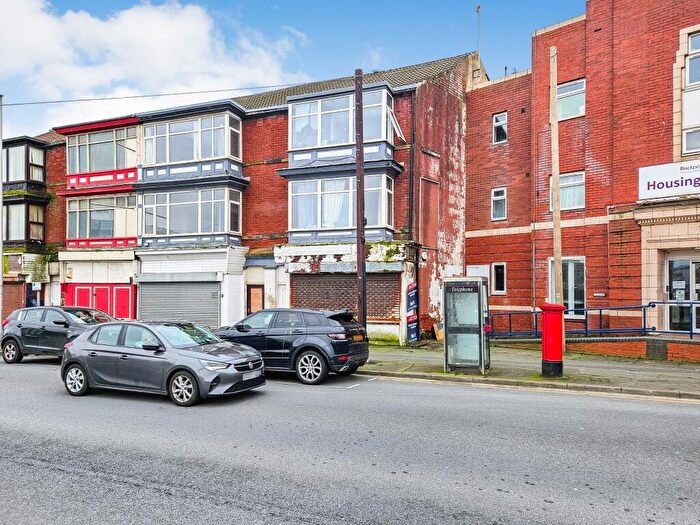
![]()
If you are looking to sell your house, let it out, or receive a property valuation, an expert can help you.
Click the button below to get started.

Roads and Postcodes in Talbot
Navigate through our locations to find the location of your next house in Talbot, Blackpool for sale or to rent.
Transport near Talbot
-
 Blackpool North Station
 -
Blackpool South Station
-
Layton Station
-
Blackpool Pleasure Beach Station
-
Squires Gate Station
- FAQ
- Price Paid By Year
- Property Type Price
Frequently asked questions about Talbot
What is the average price for a property for sale in Talbot?
The average price for a property for sale in Talbot is £135,839. This amount is 0.5% lower than the average price in Blackpool. There are 2,510 property listings for sale in Talbot.
What streets have the most expensive properties for sale in Talbot?
The streets with the most expensive properties for sale in Talbot are Livingstone Road at an average of £403,500, Redwood Drive at an average of £288,443 and Central Drive at an average of £216,250.
What streets have the most affordable properties for sale in Talbot?
The streets with the most affordable properties for sale in Talbot are Alfred Street at an average of £35,999, Bank Hey Street at an average of £40,000 and Belle Vue Place at an average of £64,000.
Which train stations are available in or near Talbot?
Some of the train stations available in or near Talbot are Blackpool North, Blackpool South and Layton.
Property Price Paid in Talbot by Year
The average sold property price by year was:
| Year | Average Sold Price | Price Change |
Sold Properties
|
|---|---|---|---|
| 2026 | £188,921 | 18% |
7 Properties |
| 2025 | £155,738 | 24% |
121 Properties |
| 2024 | £118,748 | -12% |
146 Properties |
| 2023 | £133,433 | -0,2% |
118 Properties |
| 2022 | £133,653 | 8% |
153 Properties |
| 2021 | £123,554 | 9% |
171 Properties |
| 2020 | £112,060 | -4% |
91 Properties |
| 2019 | £116,484 | 16% |
123 Properties |
| 2018 | £97,980 | -17% |
120 Properties |
| 2017 | £114,463 | 9% |
95 Properties |
| 2016 | £103,657 | -15% |
101 Properties |
| 2015 | £119,245 | 3% |
89 Properties |
| 2014 | £115,639 | 27% |
111 Properties |
| 2013 | £84,581 | -3% |
61 Properties |
| 2012 | £87,255 | -27% |
52 Properties |
| 2011 | £111,189 | 1% |
64 Properties |
| 2010 | £110,428 | 4% |
78 Properties |
| 2009 | £106,505 | -18% |
68 Properties |
| 2008 | £125,757 | -6% |
92 Properties |
| 2007 | £133,881 | 4% |
282 Properties |
| 2006 | £128,764 | -3% |
214 Properties |
| 2005 | £133,037 | 18% |
219 Properties |
| 2004 | £109,171 | 17% |
293 Properties |
| 2003 | £90,739 | 24% |
294 Properties |
| 2002 | £68,690 | 18% |
309 Properties |
| 2001 | £56,613 | 1% |
237 Properties |
| 2000 | £56,021 | 7% |
193 Properties |
| 1999 | £52,116 | 6% |
185 Properties |
| 1998 | £49,074 | -5% |
182 Properties |
| 1997 | £51,484 | 7% |
143 Properties |
| 1996 | £47,770 | 2% |
133 Properties |
| 1995 | £46,957 | - |
95 Properties |
Property Price per Property Type in Talbot
Here you can find historic sold price data in order to help with your property search.
The average Property Paid Price for specific property types in the last three years are:
| Property Type | Average Sold Price | Sold Properties |
|---|---|---|
| Semi Detached House | £157,068.00 | 79 Semi Detached Houses |
| Detached House | £302,504.00 | 11 Detached Houses |
| Terraced House | £140,050.00 | 226 Terraced Houses |
| Flat | £77,131.00 | 76 Flats |