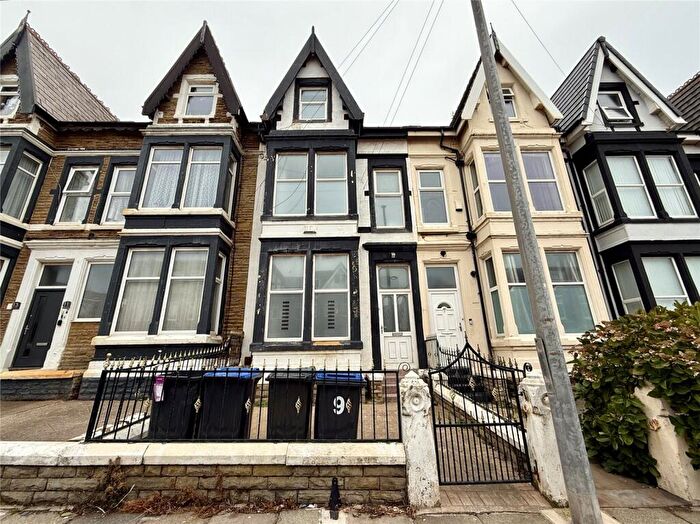
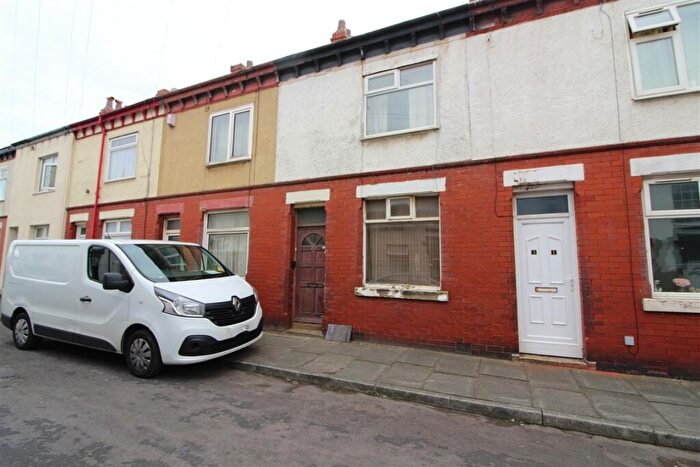
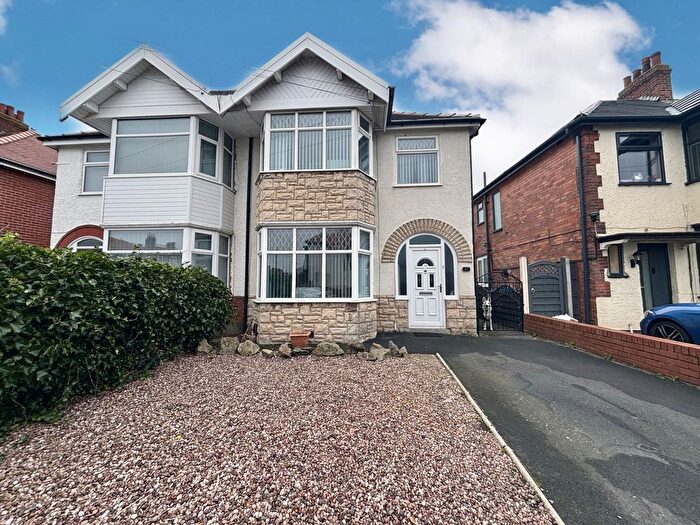
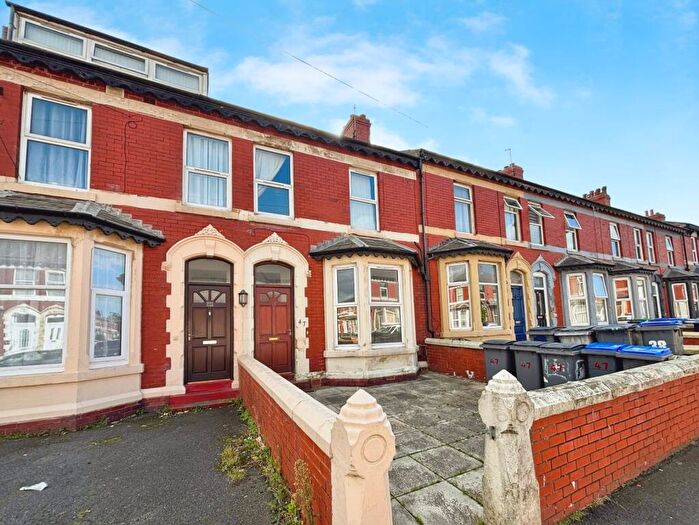
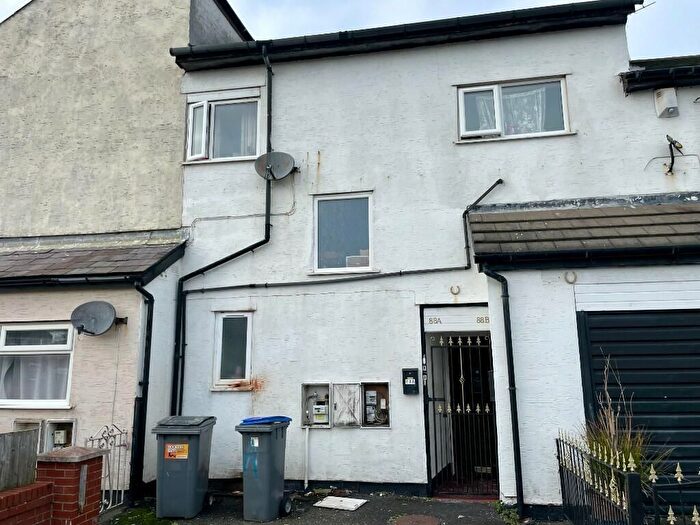
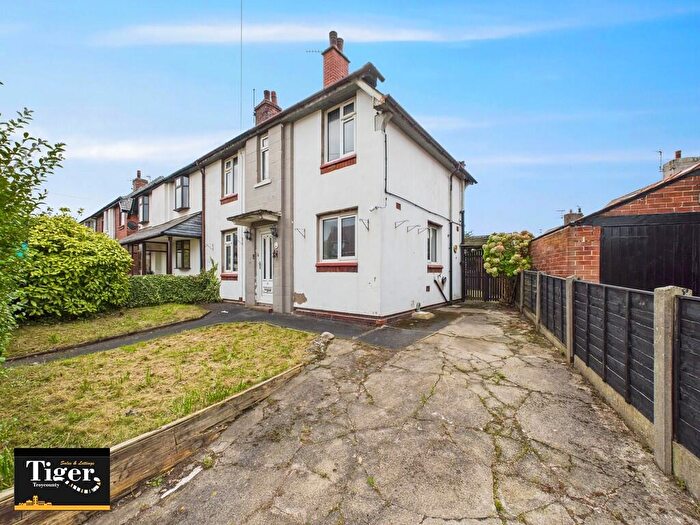
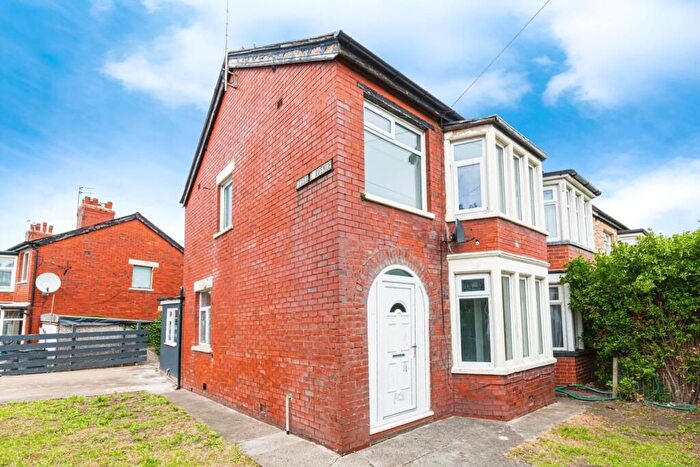
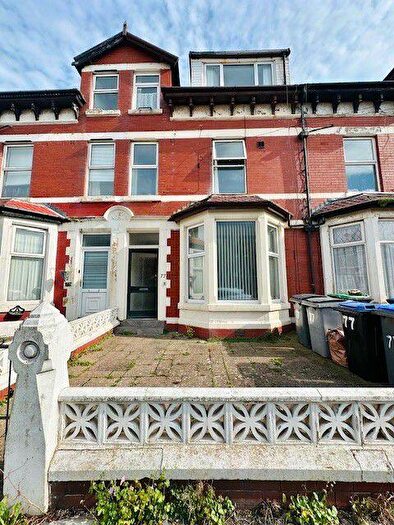
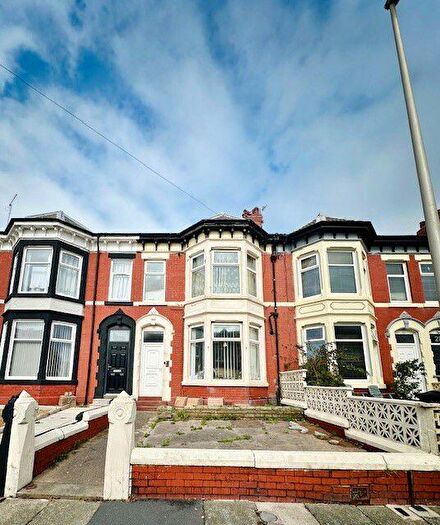
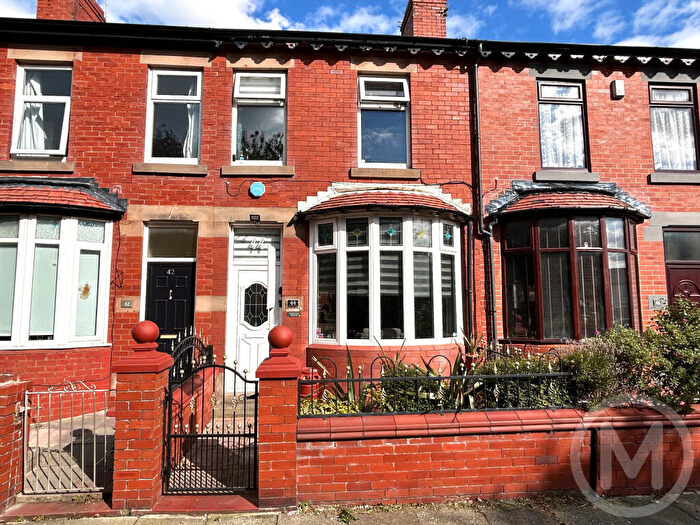
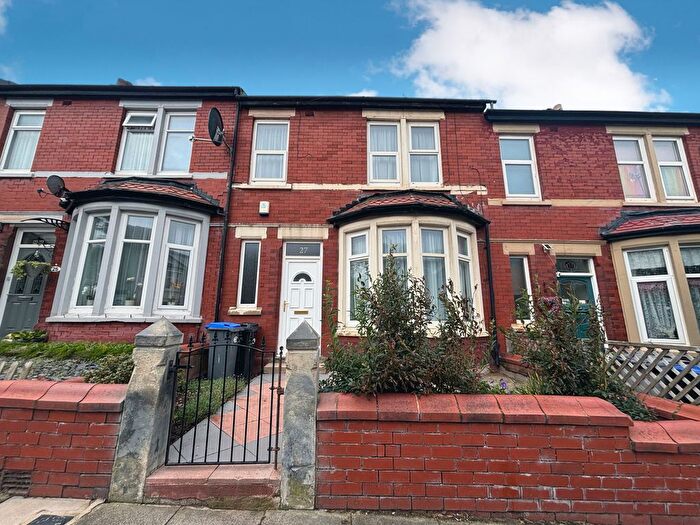
Houses for sale & to rent in Claremont, Blackpool
House Prices in Claremont
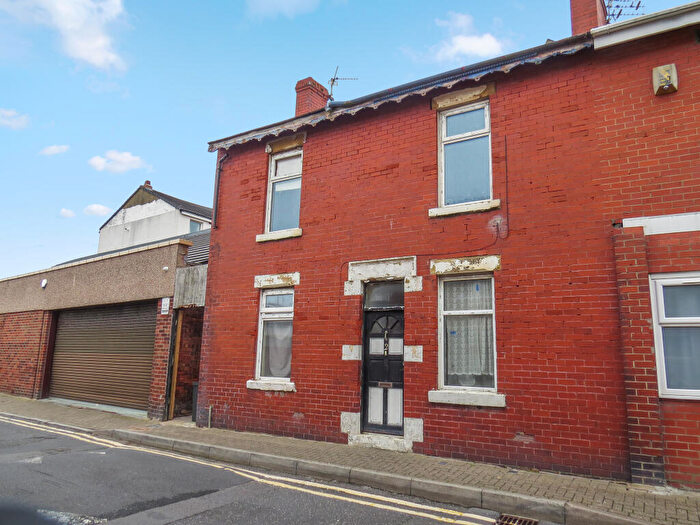
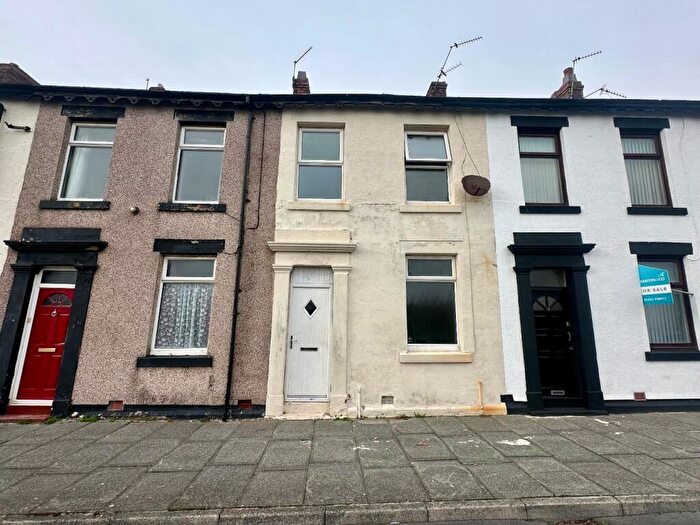
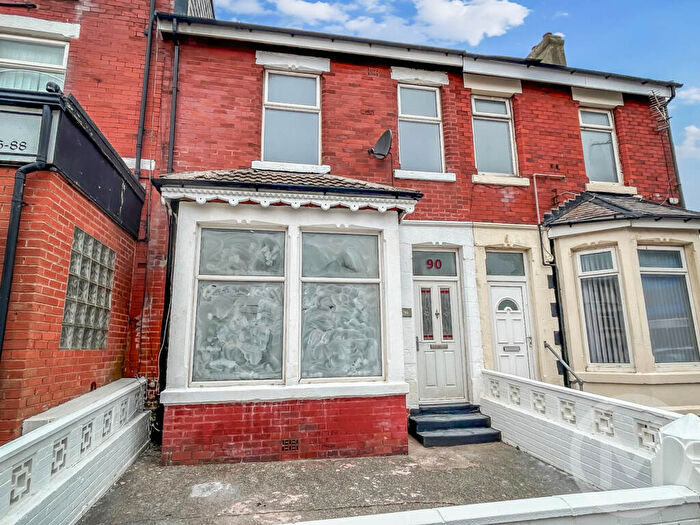
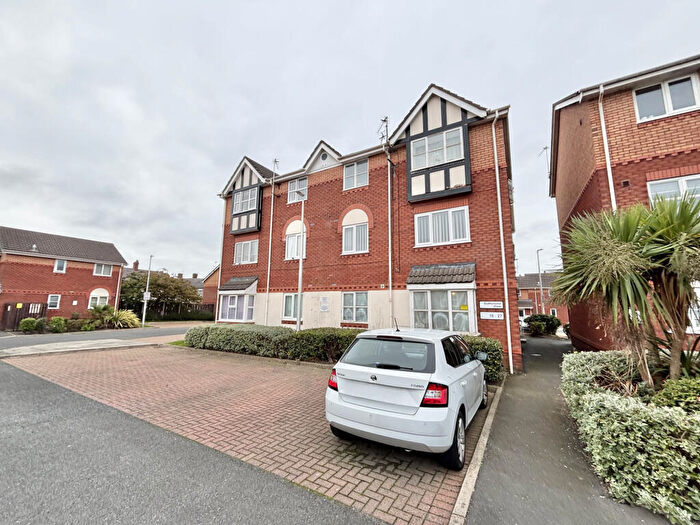
Properties in Claremont have an average house price of £92,424.00 and had 482 Property Transactions within the last 3 years¹.
Claremont is an area in Blackpool, Blackpool with 3,657 households², where the most expensive property was sold for £360,000.00.
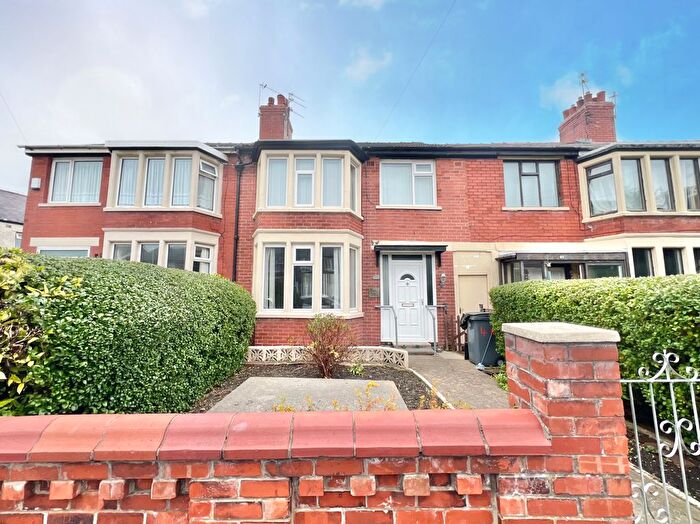
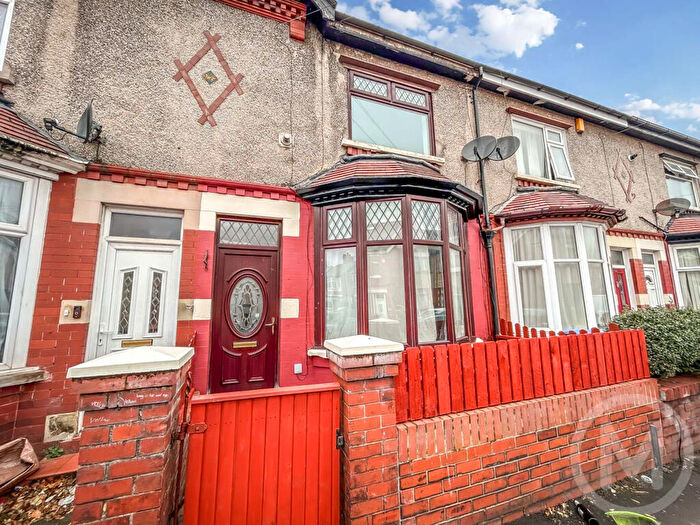
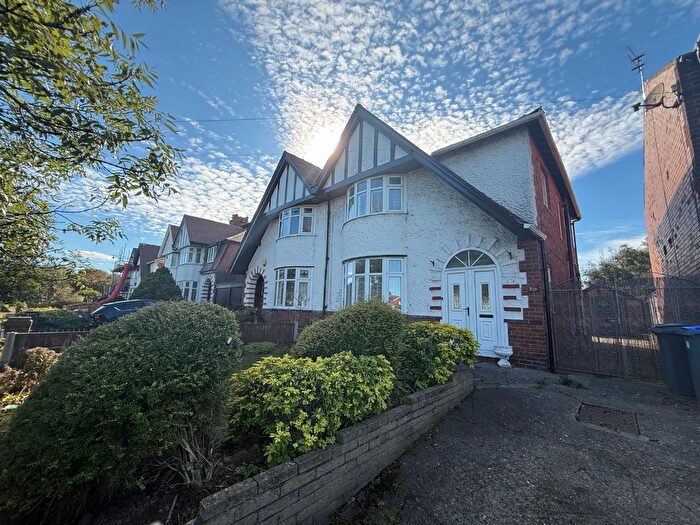
Properties for sale in Claremont
Roads and Postcodes in Claremont
Navigate through our locations to find the location of your next house in Claremont, Blackpool for sale or to rent.
| Streets | Postcodes |
|---|---|
| Abingdon Street | FY1 1PP FY1 1NH |
| Althorp Close | FY1 3NR |
| Ashburton Road | FY1 2JD FY1 2PE FY1 2PF |
| Avenham Grove | FY1 2EN |
| Avon Place | FY1 2QX |
| Back Ashburton Road | FY1 2PY |
| Back Carshalton Road | FY1 2NU |
| Back High Street | FY1 2BW FY1 2DS |
| Back Lord Street | FY1 2BQ FY1 2BF FY1 2BG |
| Back Sherbourne Road | FY1 2PZ |
| Back Warbreck Road | FY1 1SD |
| Banks Street | FY1 1RN FY1 2AR FY1 2AS FY1 2BE FY1 2DT |
| Bedford Road | FY1 2QS |
| Beresford Street | FY1 3RF |
| Boothley Road | FY1 3RR FY1 3RS |
| Boothroyden | FY1 2NT |
| Braithwaite Street | FY1 2HS |
| Bute Avenue | FY1 2HR |
| Carshalton Road | FY1 2NR |
| Catterall Close | FY1 3RB |
| Cecil Street | FY1 3RA |
| Cheltenham Road | FY1 2PR FY1 2PS |
| Chesterfield Road | FY1 2PL FY1 2PP |
| Claremont Court | FY1 2RJ |
| Claremont Road | FY1 2QF FY1 2QH FY1 2QJ |
| Clevedon Road | FY1 2NX |
| Clifford Road | FY1 2PU |
| Clyde Street | FY1 2HT |
| Cocker Square | FY1 1RX |
| Cocker Street | FY1 2BY FY1 2BZ FY1 2DP FY1 2EB FY1 1SF |
| Cocker Trading Estate | FY1 2EP |
| Coleridge Road | FY1 3RN |
| Coopers Way | FY1 3RJ |
| Crofters Mews | FY1 2EE |
| Cromwell Road | FY1 2QQ FY1 2RG |
| Cross Street | FY1 2EA |
| Cypress Grove | FY3 8RR |
| Derby Road | FY1 2JF |
| Devonshire Road | FY3 7AA FY3 8AY |
| Dickson Road | FY1 2AE FY1 2AJ FY1 2AT FY1 2AW FY1 2BU FY1 2BX FY1 2ET FY1 2EU FY1 2HF FY1 2HQ FY1 2JH FY1 2AA FY1 2AP FY1 2AX FY1 2HH FY1 2HJ FY1 2JJ FY1 2LF |
| Douglas Avenue | FY3 7AL |
| East Boothroyden | FY1 2NS |
| Eaves Street | FY1 2NH |
| Egerton Road | FY1 2NL FY1 2NN FY1 2NP FY1 2NW |
| Empire Grove | FY3 7AX |
| Enfield Road | FY1 2RB FY1 2QR |
| Exchange Street | FY1 2DU FY1 2DX FY1 2DZ |
| Fairfield Road | FY1 2RA |
| Fielding Road | FY1 2QL |
| Filey Place | FY1 1RL |
| Foxdale Avenue | FY3 7AD |
| Francis Street | FY1 1SQ |
| Gardeners Mews | FY1 2EH |
| General Street | FY1 1RW FY1 1SE FY1 1SG |
| Grafton Street | FY1 3RE |
| Grantham Road | FY1 2RF |
| Greenhill Place | FY1 3RQ |
| Hampstead Mews | FY1 2SG |
| Handsworth Court | FY1 2RL |
| Handsworth Road | FY1 2QZ FY1 2RQ FY1 2RD |
| Hardman Street | FY1 3QZ |
| Hawthorn Road | FY1 2RE |
| Healey Street | FY3 8RW |
| Henthorne Street | FY1 3RH |
| High Street | FY1 2BN FY1 2BP FY1 2DL FY1 2DW FY1 2BL |
| Howard Street | FY1 2EL |
| Imperial Street | FY1 2HN |
| Imperial Yard | FY1 2HW |
| Kyston Close | FY1 3NS |
| Laburnum Street | FY3 8RP |
| Lang Street | FY1 2EJ |
| Lansdowne Place | FY1 1SB |
| Leavesley Road | FY1 2QP |
| Lewtas Street | FY1 2DY |
| Lichfield Road | FY1 2RR |
| Lord Street | FY1 2AZ FY1 2BD FY1 2BJ FY1 2DA FY1 2DG FY1 2DJ |
| Lynn Grove | FY1 2HZ |
| Mansfield Road | FY3 7AB |
| Mather Street | FY3 8RA |
| Moorhouse Street | FY1 2HL |
| Mount Street | FY1 2DQ FY1 2DH |
| Newman Road | FY1 2QN |
| Percy Street | FY1 3RD |
| Pleasant Street | FY1 2HU FY1 2JA |
| Promenade | FY1 1RJ FY1 1RT FY1 1RZ FY1 1RA FY1 1RE FY1 1RU FY1 1SA FY1 2EY FY1 2HA FY1 2HB FY1 2JG |
| Queen Street | FY1 1PU FY1 1NL FY1 1PD FY1 1PX FY1 2AY |
| Queens Square | FY1 1QU |
| Ramsey Avenue | FY3 7AH |
| Rice Grove | FY1 2QW |
| Richmond Road | FY1 2NJ |
| Rossall Road | FY3 8RN |
| Sherbourne Road | FY1 2PG FY1 2PJ FY1 2PN FY1 2PQ FY1 2PW |
| Smithy Mews | FY1 2EQ |
| Spencer Court | FY1 3TP FY1 3TR FY1 3TW |
| Springfield Road | FY1 1PZ FY1 1QL FY1 1QW FY1 2BA FY1 2AU |
| St Anthonys Place | FY1 3RG |
| St Pauls Road | FY1 2NY |
| Stanhope Road | FY1 2QY |
| Stirling Road | FY3 8RX |
| Sutherland Road | FY1 2QT |
| Sutherland View | FY1 2RH |
| Swarbrick Close | FY1 3RZ |
| Talbot Road | FY1 1LL FY1 3QS FY1 3QX FY3 7AS FY3 7AT FY3 7AY FY1 1LB FY1 1LE FY1 2AB FY1 3QU |
| Talbot Square | FY1 1NG |
| The Strand | FY1 1NX FY1 1QT |
| Thomas Street | FY1 3HG |
| Walker Street | FY1 1AN |
| Wall Street | FY1 2EG FY1 2DN |
| Westminster Road | FY1 2QE |
| Wilton Parade | FY1 2HE FY1 2HD |
| Woburn Road | FY1 2PH |
| Yates Street | FY1 2DB FY1 2DE |
| FY1 1RQ FY1 2EZ |
Transport near Claremont
-
Blackpool North Station
-
Layton Station
-
Blackpool South Station
-
Blackpool Pleasure Beach Station
-
Poulton-Le-Fylde Station
- FAQ
- Price Paid By Year
- Property Type Price
Frequently asked questions about Claremont
What is the average price for a property for sale in Claremont?
The average price for a property for sale in Claremont is £92,424. This amount is 32% lower than the average price in Blackpool. There are 2,216 property listings for sale in Claremont.
What streets have the most expensive properties for sale in Claremont?
The streets with the most expensive properties for sale in Claremont are Wilton Parade at an average of £190,000, General Street at an average of £160,000 and Dickson Road at an average of £155,999.
What streets have the most affordable properties for sale in Claremont?
The streets with the most affordable properties for sale in Claremont are Filey Place at an average of £42,000, Spencer Court at an average of £52,000 and Sutherland View at an average of £53,363.
Which train stations are available in or near Claremont?
Some of the train stations available in or near Claremont are Blackpool North, Layton and Blackpool South.
Property Price Paid in Claremont by Year
The average sold property price by year was:
| Year | Average Sold Price | Price Change |
Sold Properties
|
|---|---|---|---|
| 2025 | £94,971 | 9% |
40 Properties |
| 2024 | £86,251 | -11% |
128 Properties |
| 2023 | £95,777 | 2% |
135 Properties |
| 2022 | £93,740 | 7% |
179 Properties |
| 2021 | £87,338 | 6% |
122 Properties |
| 2020 | £81,931 | -2% |
141 Properties |
| 2019 | £83,249 | 10% |
166 Properties |
| 2018 | £75,111 | -49% |
120 Properties |
| 2017 | £111,616 | 36% |
129 Properties |
| 2016 | £71,544 | -4% |
114 Properties |
| 2015 | £74,499 | 13% |
110 Properties |
| 2014 | £64,697 | -2% |
106 Properties |
| 2013 | £65,982 | -14% |
73 Properties |
| 2012 | £74,908 | -7% |
57 Properties |
| 2011 | £79,789 | -18% |
89 Properties |
| 2010 | £93,807 | 10% |
64 Properties |
| 2009 | £84,372 | -17% |
87 Properties |
| 2008 | £98,545 | -6% |
135 Properties |
| 2007 | £104,227 | 6% |
264 Properties |
| 2006 | £98,273 | 8% |
240 Properties |
| 2005 | £90,131 | 11% |
251 Properties |
| 2004 | £80,313 | 22% |
344 Properties |
| 2003 | £62,336 | 19% |
368 Properties |
| 2002 | £50,217 | 16% |
355 Properties |
| 2001 | £42,239 | 12% |
219 Properties |
| 2000 | £36,977 | 4% |
208 Properties |
| 1999 | £35,499 | 3% |
195 Properties |
| 1998 | £34,485 | -12% |
182 Properties |
| 1997 | £38,713 | 6% |
184 Properties |
| 1996 | £36,240 | -10% |
155 Properties |
| 1995 | £39,755 | - |
150 Properties |
Property Price per Property Type in Claremont
Here you can find historic sold price data in order to help with your property search.
The average Property Paid Price for specific property types in the last three years are:
| Property Type | Average Sold Price | Sold Properties |
|---|---|---|
| Flat | £67,461.00 | 49 Flats |
| Semi Detached House | £110,868.00 | 38 Semi Detached Houses |
| Terraced House | £93,052.00 | 391 Terraced Houses |
| Detached House | £161,625.00 | 4 Detached Houses |

