
Houses for sale & to rent in Warbreck, Blackpool
House Prices in Warbreck
Properties in Warbreck have an average house price of £165k and had 356 Property Transactions within the last 3 years¹.
Warbreck is an area in Blackpool, Blackpool with 2,812 households², where the most expensive property was sold for £1.3M.
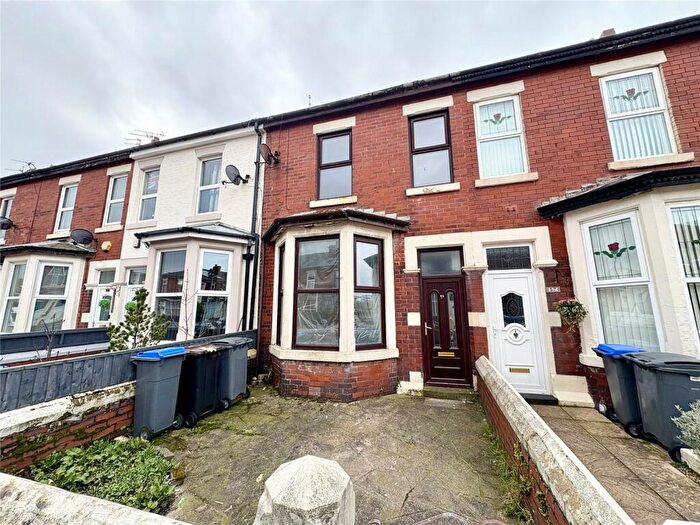
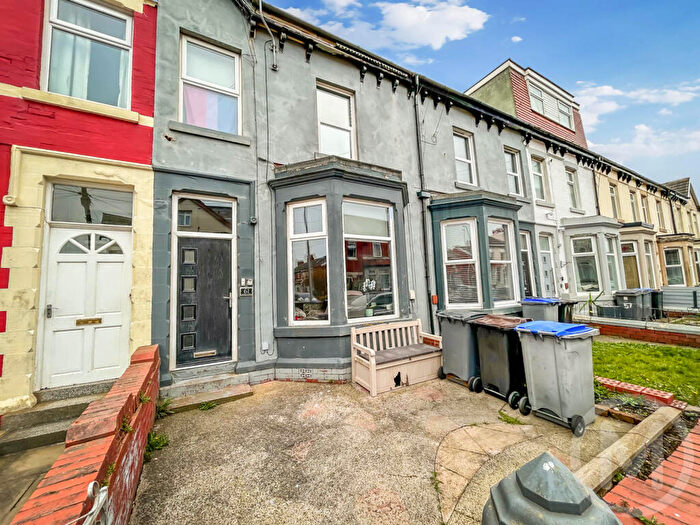
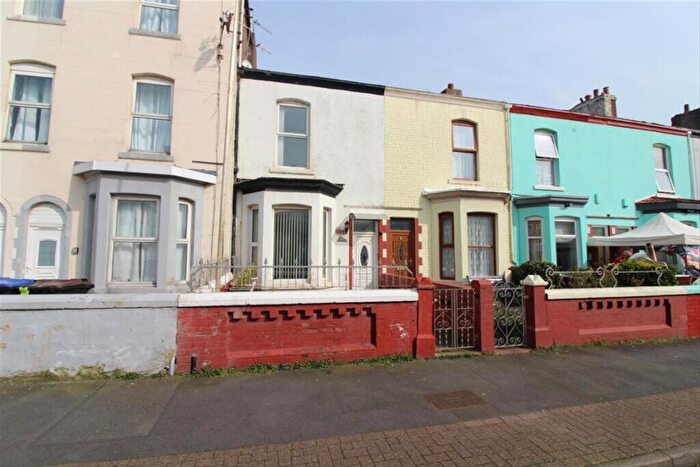
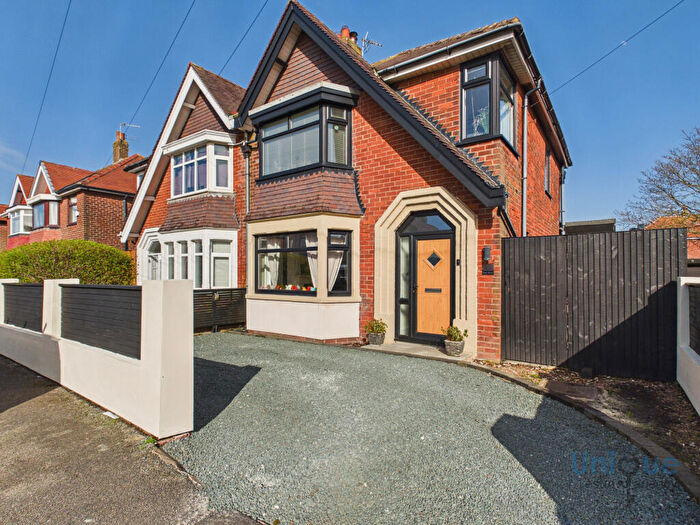
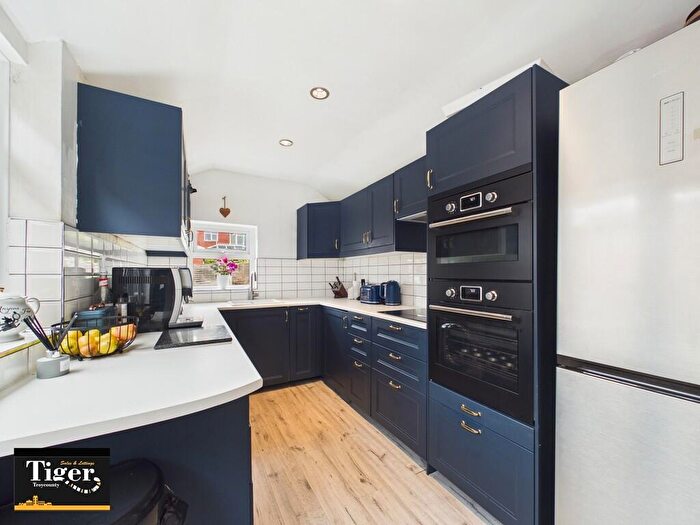
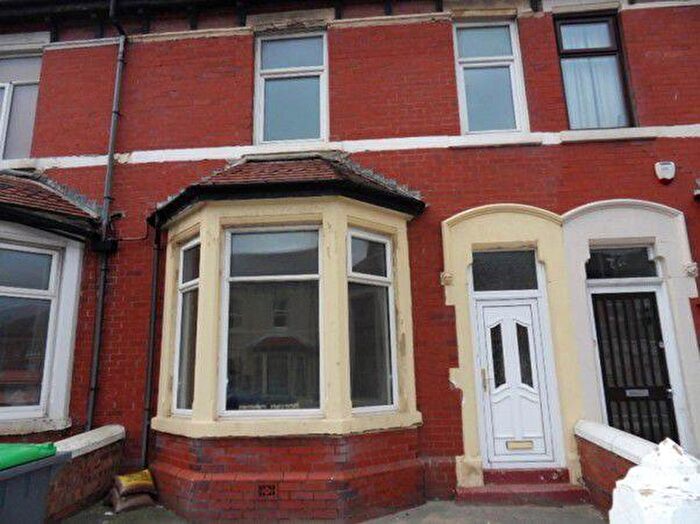
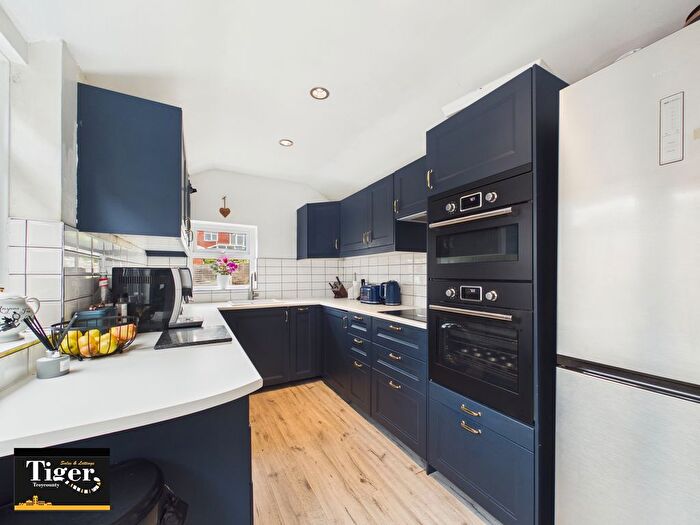
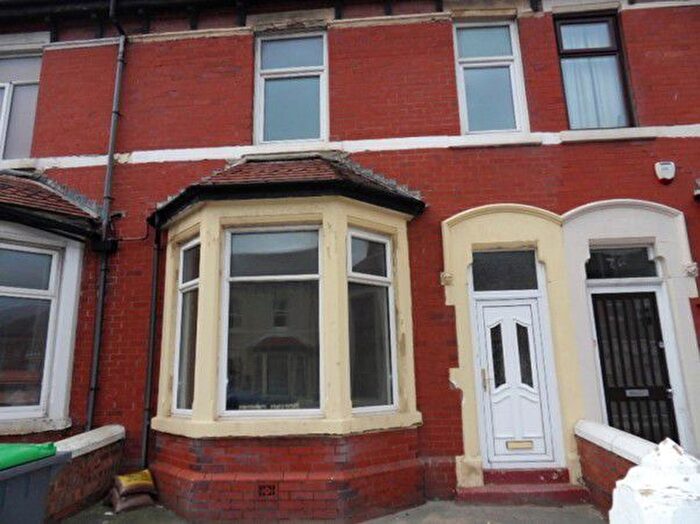
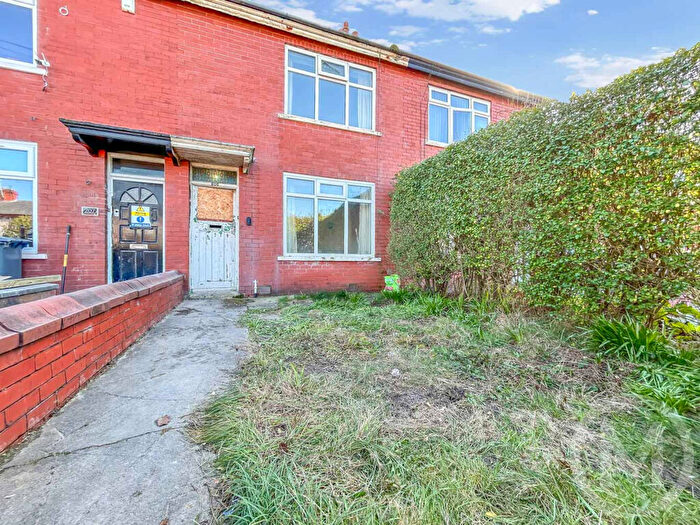
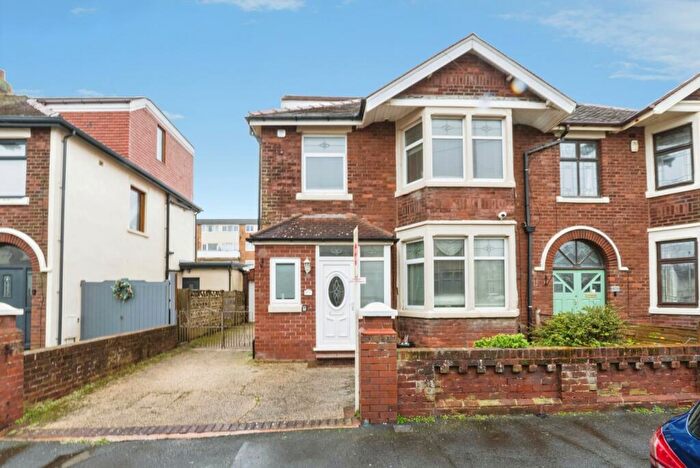
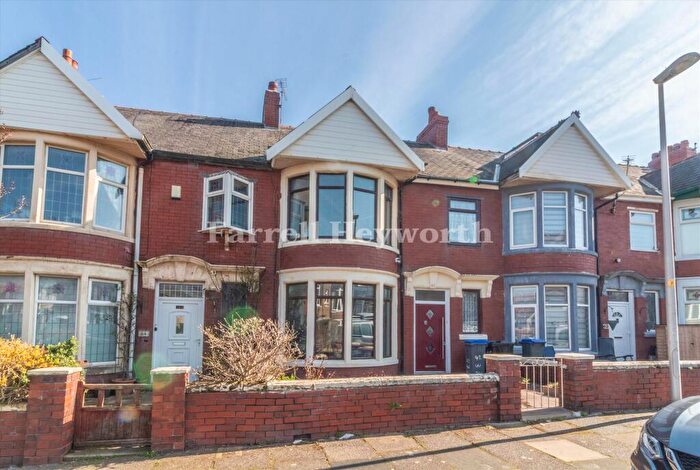
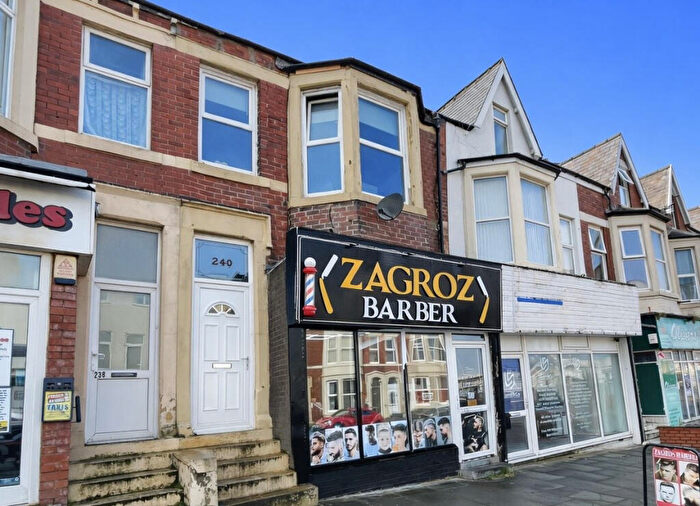
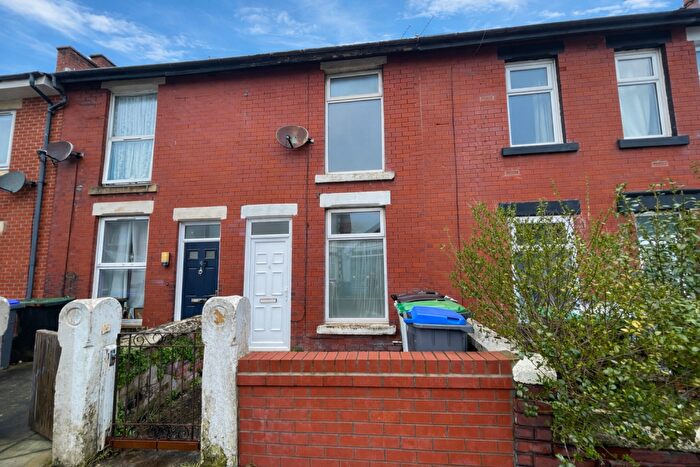
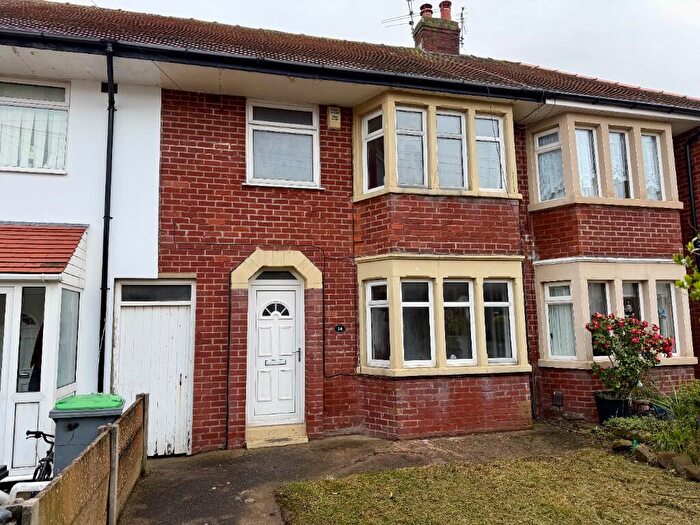
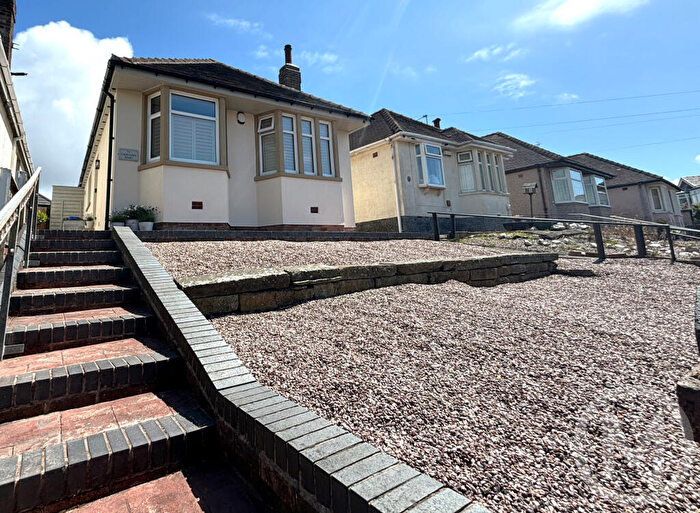
Properties for sale in Warbreck
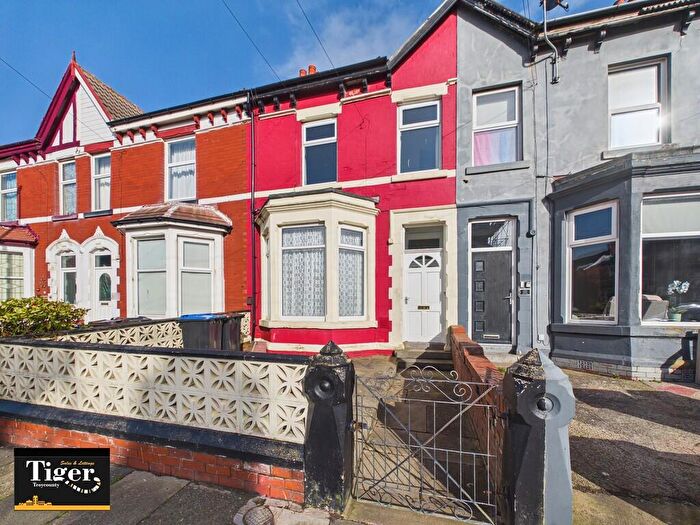
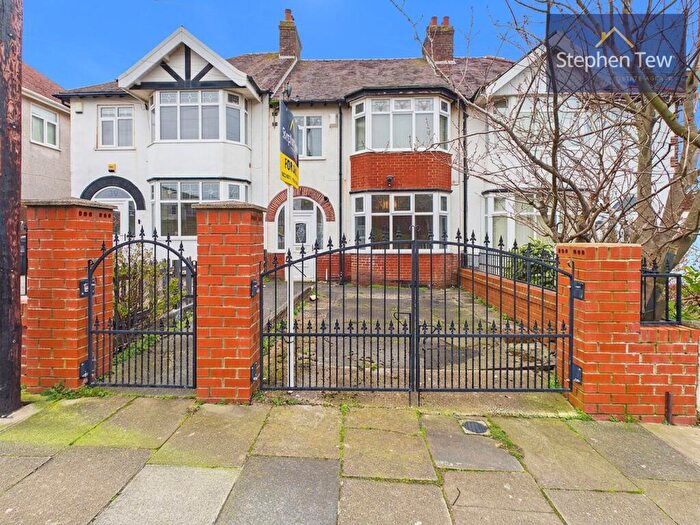
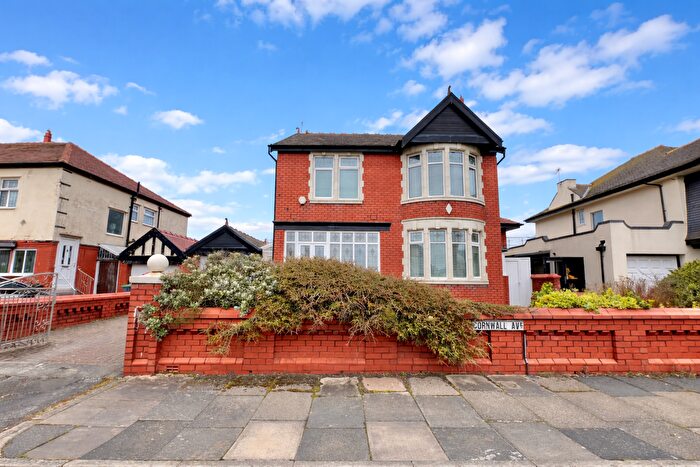
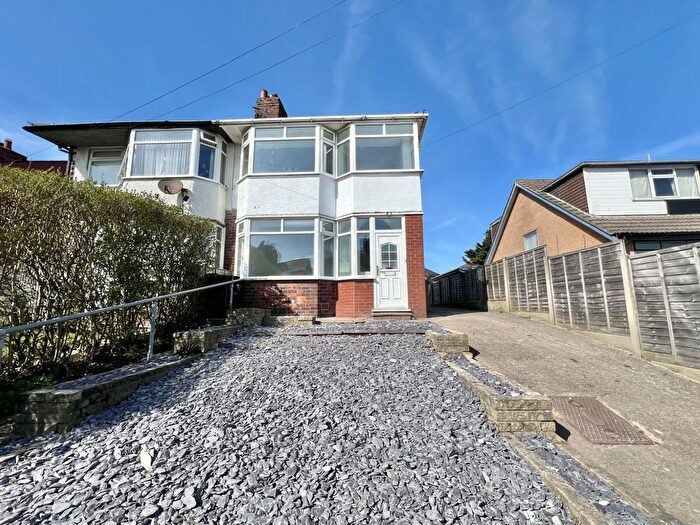
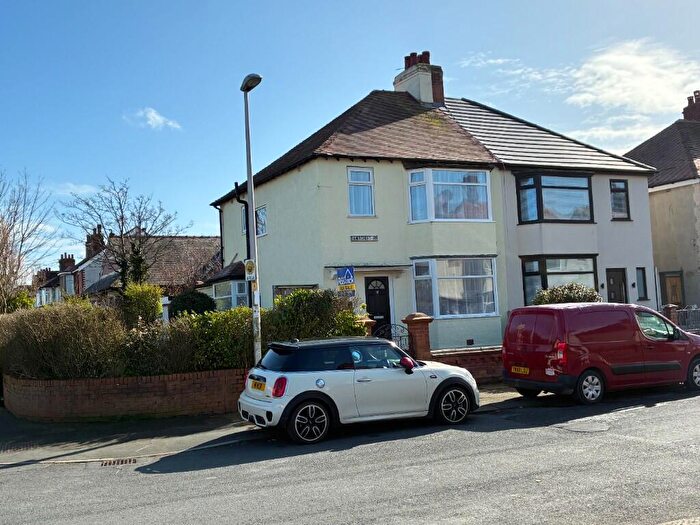
![]()
If you are looking to sell your house, let it out, or receive a property valuation, an expert can help you.
Click the button below to get started.

Roads and Postcodes in Warbreck
Navigate through our locations to find the location of your next house in Warbreck, Blackpool for sale or to rent.
Transport near Warbreck

- FAQ
- Price Paid By Year
- Property Type Price
Frequently asked questions about Warbreck
What is the average price for a property for sale in Warbreck?
The average price for a property for sale in Warbreck is £164,911. This amount is 21% higher than the average price in Blackpool. There are 1,741 property listings for sale in Warbreck.
What streets have the most expensive properties for sale in Warbreck?
The streets with the most expensive properties for sale in Warbreck are Ashley Close at an average of £259,000, Wolverton Avenue at an average of £247,475 and Shaftesbury Avenue at an average of £234,100.
What streets have the most affordable properties for sale in Warbreck?
The streets with the most affordable properties for sale in Warbreck are Queens Promenade at an average of £60,000, Ormond Avenue at an average of £87,214 and Northfield Avenue at an average of £97,962.
Which train stations are available in or near Warbreck?
Some of the train stations available in or near Warbreck are Layton, Blackpool North and Poulton-Le-Fylde.
Property Price Paid in Warbreck by Year
The average sold property price by year was:
| Year | Average Sold Price | Price Change |
Sold Properties
|
|---|---|---|---|
| 2026 | £160,000 | -13% |
4 Properties |
| 2025 | £180,998 | 14% |
94 Properties |
| 2024 | £155,624 | -4% |
127 Properties |
| 2023 | £162,520 | 0,3% |
131 Properties |
| 2022 | £162,032 | 9% |
130 Properties |
| 2021 | £147,925 | 3% |
185 Properties |
| 2020 | £142,800 | 4% |
101 Properties |
| 2019 | £137,513 | 10% |
130 Properties |
| 2018 | £123,096 | -13% |
198 Properties |
| 2017 | £139,140 | 4% |
115 Properties |
| 2016 | £133,417 | 12% |
112 Properties |
| 2015 | £117,730 | -1% |
103 Properties |
| 2014 | £119,397 | 2% |
106 Properties |
| 2013 | £116,946 | 5% |
81 Properties |
| 2012 | £111,019 | -11% |
47 Properties |
| 2011 | £123,091 | -11% |
55 Properties |
| 2010 | £136,354 | 1% |
65 Properties |
| 2009 | £135,371 | 1% |
63 Properties |
| 2008 | £133,649 | -17% |
57 Properties |
| 2007 | £155,844 | -0,2% |
162 Properties |
| 2006 | £156,232 | 9% |
198 Properties |
| 2005 | £142,046 | 13% |
163 Properties |
| 2004 | £123,865 | 14% |
209 Properties |
| 2003 | £106,806 | 26% |
209 Properties |
| 2002 | £79,547 | 10% |
241 Properties |
| 2001 | £71,580 | 9% |
211 Properties |
| 2000 | £65,046 | 5% |
165 Properties |
| 1999 | £61,948 | 10% |
178 Properties |
| 1998 | £55,533 | -1% |
142 Properties |
| 1997 | £56,083 | 1% |
148 Properties |
| 1996 | £55,636 | 9% |
103 Properties |
| 1995 | £50,529 | - |
113 Properties |
Property Price per Property Type in Warbreck
Here you can find historic sold price data in order to help with your property search.
The average Property Paid Price for specific property types in the last three years are:
| Property Type | Average Sold Price | Sold Properties |
|---|---|---|
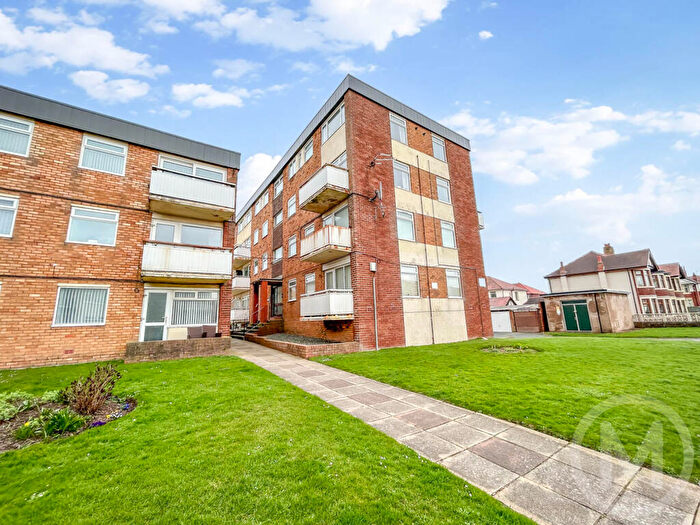
| Flat | £95,059.00 | 21 Flats |
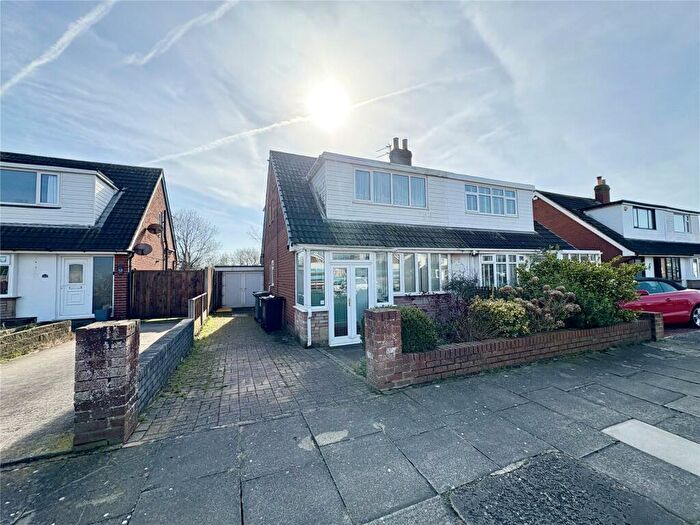
| Semi Detached House | £179,404.00 | 157 Semi Detached Houses |
| Detached House | £242,803.00 | 31 Detached Houses |
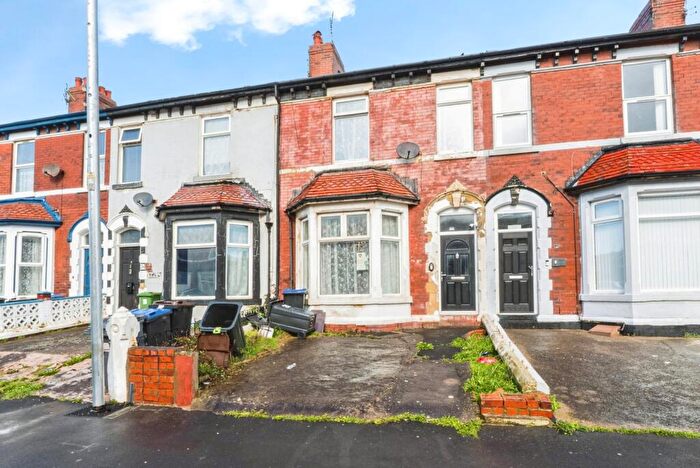
| Terraced House | £142,985.00 | 147 Terraced Houses |