
Houses for sale & to rent in Bispham, Blackpool
House Prices in Bispham
Properties in Bispham have an average house price of £154k and had 403 Property Transactions within the last 3 years¹.
Bispham is an area in Blackpool, Blackpool with 2,861 households², where the most expensive property was sold for £500k.
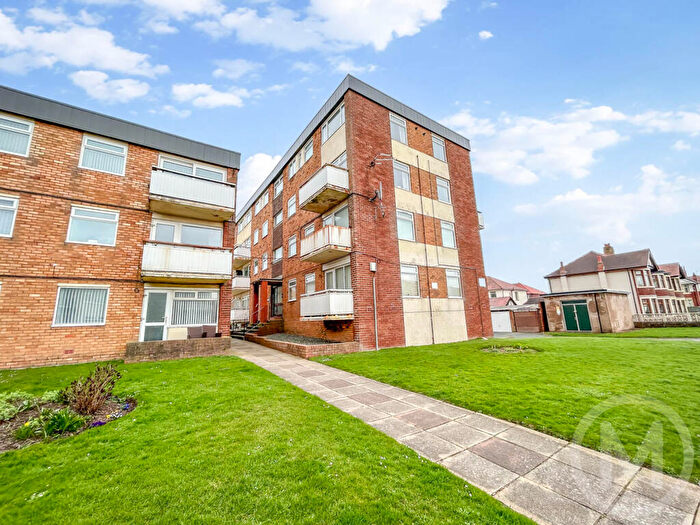
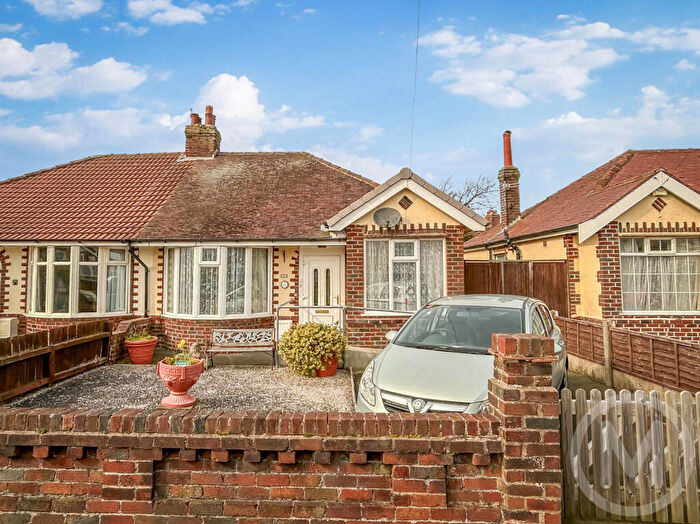
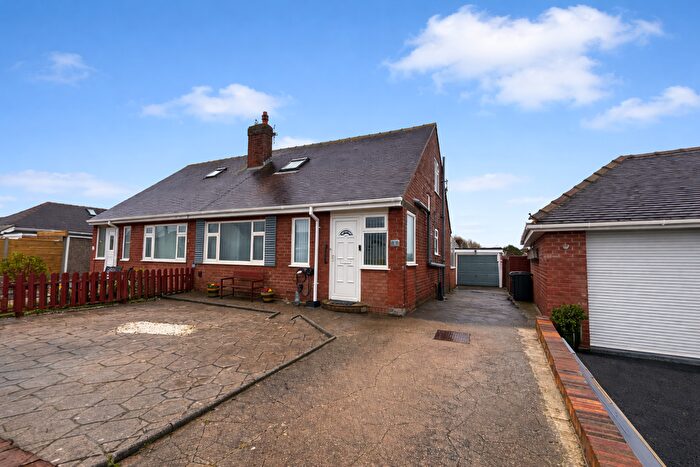
Properties for sale in Bispham

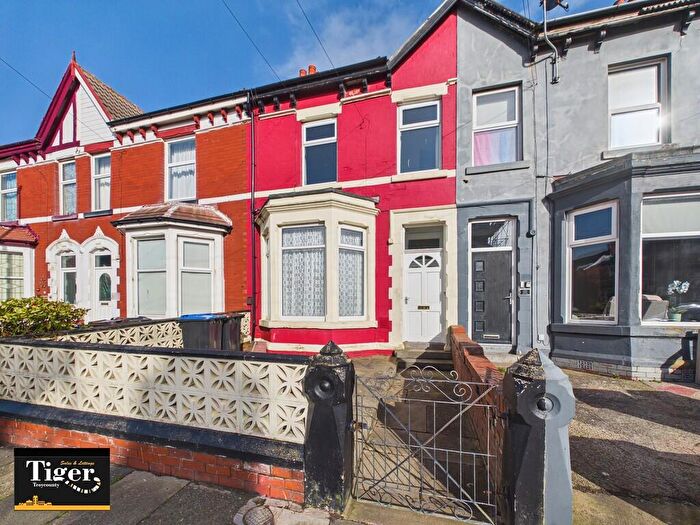
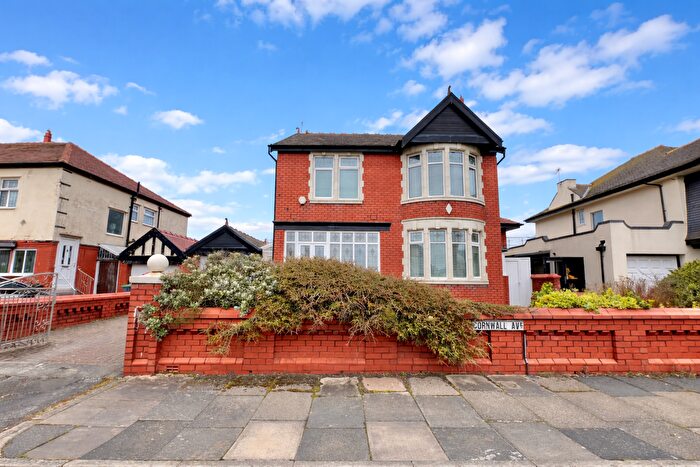
![]()
If you are looking to sell your house, let it out, or receive a property valuation, an expert can help you.
Click the button below to get started.


Roads and Postcodes in Bispham
Navigate through our locations to find the location of your next house in Bispham, Blackpool for sale or to rent.
| Streets | Postcodes |
|---|---|
| Admiral Gardens | FY2 9LR |
| Arundel Avenue | FY2 9HJ |
| Bamber Avenue | FY2 9JD |
| Bayswater | FY2 9JQ |
| Beaufort Avenue | FY2 9AG FY2 9AJ FY2 9AT FY2 9HF FY2 9HG FY2 9HQ |
| Bethel Avenue | FY2 9NA |
| Bromsgrove Avenue | FY2 9LX |
| Bryning Avenue | FY2 9LU FY2 9LZ |
| Carlton Grove | FY2 9LA |
| Cavendish Road | FY2 9EE FY2 9EG FY2 9JR FY2 9NJ |
| Caxton Avenue | FY2 9AP FY2 9AS |
| Cedric Place | FY2 9ND |
| Chatsworth Avenue | FY2 9AN |
| Cliff Place | FY2 9JL FY2 9JT |
| Coulston Avenue | FY2 9LL |
| Countess Crescent | FY2 9LQ |
| Cranleigh Avenue | FY2 9LG |
| Crawford Avenue | FY2 9BX FY2 9BY |
| Davenport Avenue | FY2 9EP |
| Daventry Avenue | FY2 9LB |
| Devonshire Road | FY2 0AN FY2 0AW FY2 0JS FY2 0JT FY2 0JU FY2 0JL |
| Duchess Drive | FY2 9PH FY2 9PJ FY2 9PQ |
| Edenvale Avenue | FY2 9JZ |
| England Avenue | FY2 9JE FY2 9JG |
| Erith Grove | FY2 9AR |
| Everest Drive | FY2 9DH FY2 9DJ FY2 9DP |
| Falkirk Avenue | FY2 9DD |
| Gregory Avenue | FY2 9DR |
| Haddon Road | FY2 9AH |
| Hanover Crescent | FY2 9DL |
| Hesketh Avenue | FY2 9JX |
| Hillary Avenue | FY2 9DS |
| Holmfield Road | FY2 9LJ FY2 9PB FY2 9PD FY2 9PT FY2 9PU FY2 9PZ |
| Lanark Avenue | FY2 9DN |
| Landseer Avenue | FY2 9EF |
| Leyburn Avenue | FY2 9AQ |
| Lowther Avenue | FY2 9PA FY2 9PE |
| Madison Avenue | FY2 9HE |
| Melville Road | FY2 9JF |
| Millom Avenue | FY2 9LY |
| Montpelier Avenue | FY2 9AE FY2 9AF FY2 9EH FY2 9EJ |
| Norcliffe Road | FY2 9AL FY2 9AW FY2 9BN FY2 9EN FY2 9ES FY2 9EW |
| Norfolk Avenue | FY2 9QA |
| Northgate | FY2 9LT FY2 9NG FY2 9NL |
| Oldfield Avenue | FY2 9NE FY2 9NH FY2 9NQ |
| Pembroke Avenue | FY2 9PS FY2 9PX FY2 9QD |
| Pennystone Road | FY2 9HL |
| Queens Promenade | FY2 9AB FY2 9AD FY2 9AX FY2 9AZ FY2 9BA FY2 9BB FY2 9GJ FY2 9GL FY2 9GN FY2 9HA FY2 9JH FY2 9JJ FY2 9JS FY2 9LW FY2 9NY FY2 9PG FY2 9PR FY2 9PY FY2 9HB FY2 9HD FY2 9HP FY2 9JN FY2 9NX |
| Red Bank Road | FY2 9DZ FY2 9EA FY2 9ET FY2 9HN FY2 9HR FY2 9HX FY2 9HZ FY2 9HH FY2 9HY FY2 9NW |
| Rivington Avenue | FY2 9BU FY2 9DG FY2 9ER |
| Salop Avenue | FY2 9NB |
| Salwick Avenue | FY2 9BT |
| Sandhurst Avenue | FY2 9AU FY2 9EB |
| Sunny Bank Avenue | FY2 9ED FY2 9EQ FY2 9NF |
| Tensing Avenue | FY2 9DQ |
| Waller Avenue | FY2 9EL |
| Warbreck Drive | FY2 9LD FY2 9LE FY2 9LF FY2 9LH FY2 9PL FY2 9PN FY2 9PP FY2 9PW FY2 9QB |
| Wolverton Avenue | FY2 9NU |
| York Road | FY2 9JY |
Transport near Bispham

- FAQ
- Price Paid By Year
- Property Type Price
Frequently asked questions about Bispham
What is the average price for a property for sale in Bispham?
The average price for a property for sale in Bispham is £153,547. This amount is 12% higher than the average price in Blackpool. There are 1,385 property listings for sale in Bispham.
What streets have the most expensive properties for sale in Bispham?
The streets with the most expensive properties for sale in Bispham are Madison Avenue at an average of £349,000, Arundel Avenue at an average of £295,000 and Chatsworth Avenue at an average of £263,750.
What streets have the most affordable properties for sale in Bispham?
The streets with the most affordable properties for sale in Bispham are Cliff Place at an average of £90,438, Melville Road at an average of £111,806 and Haddon Road at an average of £112,915.
Which train stations are available in or near Bispham?
Some of the train stations available in or near Bispham are Layton, Blackpool North and Poulton-Le-Fylde.
Property Price Paid in Bispham by Year
The average sold property price by year was:
| Year | Average Sold Price | Price Change |
Sold Properties
|
|---|---|---|---|
| 2026 | £199,950 | 20% |
1 Property |
| 2025 | £160,546 | 3% |
133 Properties |
| 2024 | £155,559 | 7% |
124 Properties |
| 2023 | £145,086 | -13% |
145 Properties |
| 2022 | £163,742 | 7% |
182 Properties |
| 2021 | £151,492 | 7% |
186 Properties |
| 2020 | £140,983 | 11% |
109 Properties |
| 2019 | £126,148 | -5% |
131 Properties |
| 2018 | £132,966 | -1% |
119 Properties |
| 2017 | £133,858 | 7% |
149 Properties |
| 2016 | £124,164 | 3% |
119 Properties |
| 2015 | £120,912 | 1% |
126 Properties |
| 2014 | £120,262 | 3% |
115 Properties |
| 2013 | £116,962 | 3% |
92 Properties |
| 2012 | £113,348 | 2% |
82 Properties |
| 2011 | £110,821 | -14% |
84 Properties |
| 2010 | £126,014 | -3% |
78 Properties |
| 2009 | £130,277 | -9% |
86 Properties |
| 2008 | £141,694 | -5% |
91 Properties |
| 2007 | £148,387 | 1% |
181 Properties |
| 2006 | £146,530 | 2% |
254 Properties |
| 2005 | £142,991 | 12% |
264 Properties |
| 2004 | £126,154 | 22% |
220 Properties |
| 2003 | £98,897 | 24% |
178 Properties |
| 2002 | £75,036 | 19% |
205 Properties |
| 2001 | £60,914 | 1% |
180 Properties |
| 2000 | £60,132 | 10% |
173 Properties |
| 1999 | £54,083 | -2% |
184 Properties |
| 1998 | £55,232 | 9% |
170 Properties |
| 1997 | £50,026 | 3% |
146 Properties |
| 1996 | £48,530 | -2% |
120 Properties |
| 1995 | £49,350 | - |
126 Properties |
Property Price per Property Type in Bispham
Here you can find historic sold price data in order to help with your property search.
The average Property Paid Price for specific property types in the last three years are:
| Property Type | Average Sold Price | Sold Properties |
|---|---|---|
| Flat | £94,359.00 | 104 Flats |
| Semi Detached House | £174,207.00 | 197 Semi Detached Houses |
| Detached House | £234,050.00 | 29 Detached Houses |
| Terraced House | £150,134.00 | 73 Terraced Houses |