
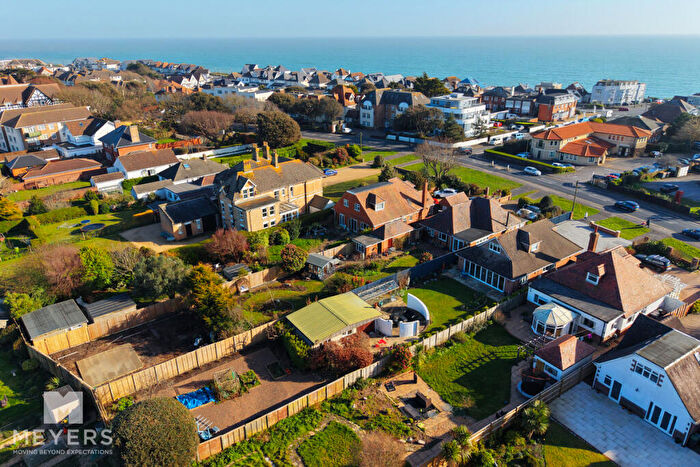
Houses for sale & to rent in West Southbourne, Bournemouth
House Prices in West Southbourne
Properties in West Southbourne have an average house price of £412k and had 412 Property Transactions within the last 3 years¹.
West Southbourne is an area in Bournemouth, Bournemouth with 4,038 households², where the most expensive property was sold for £2.63M.
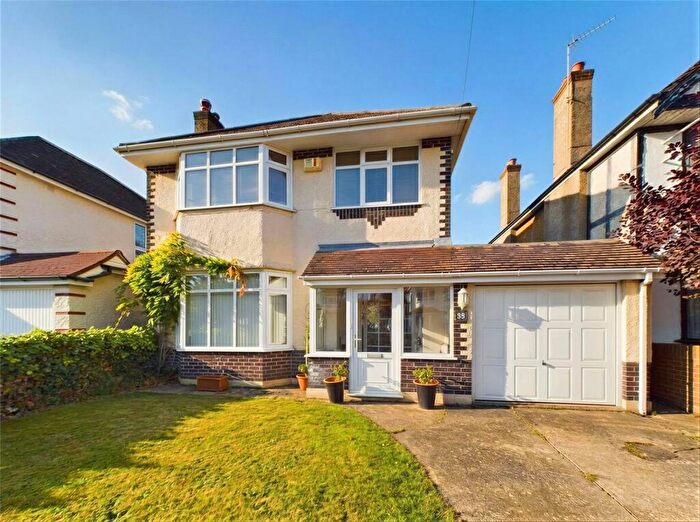
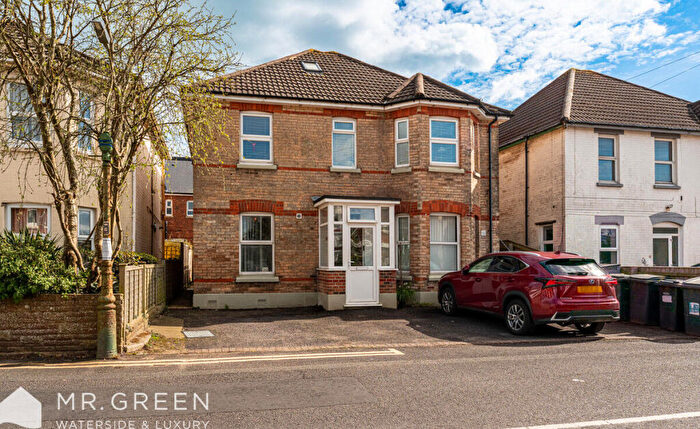
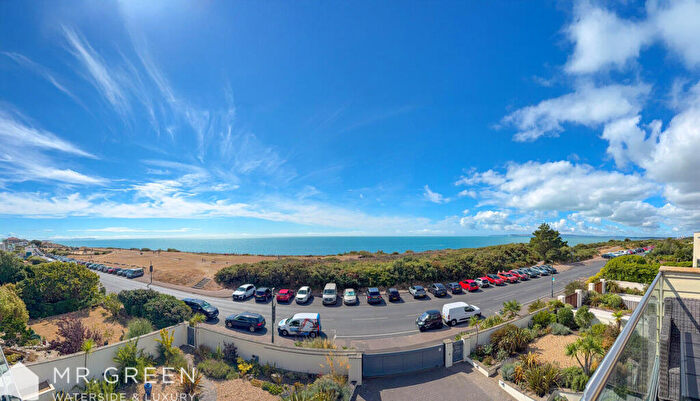
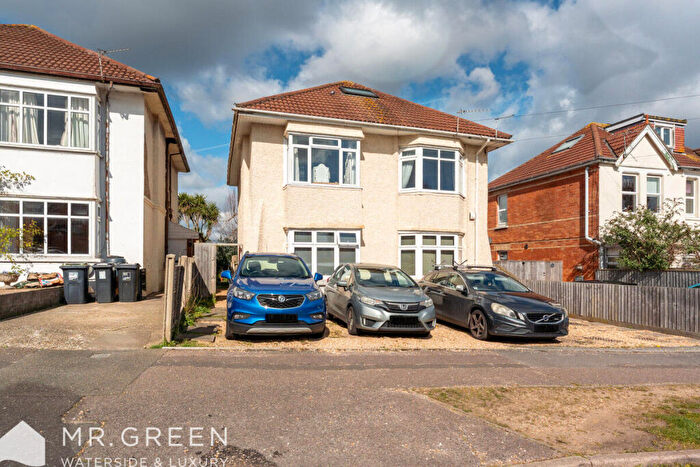
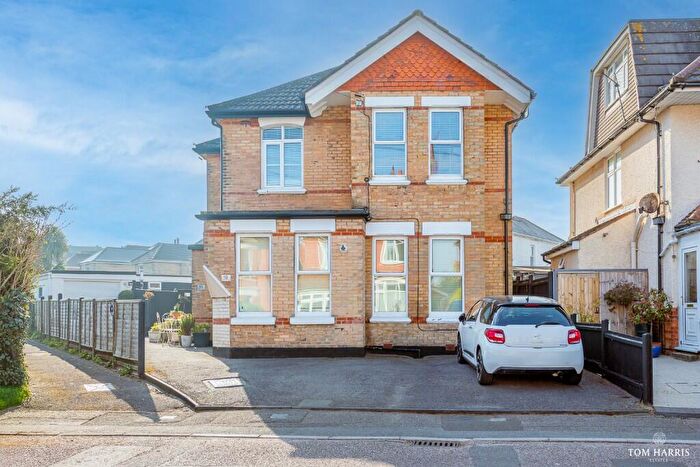
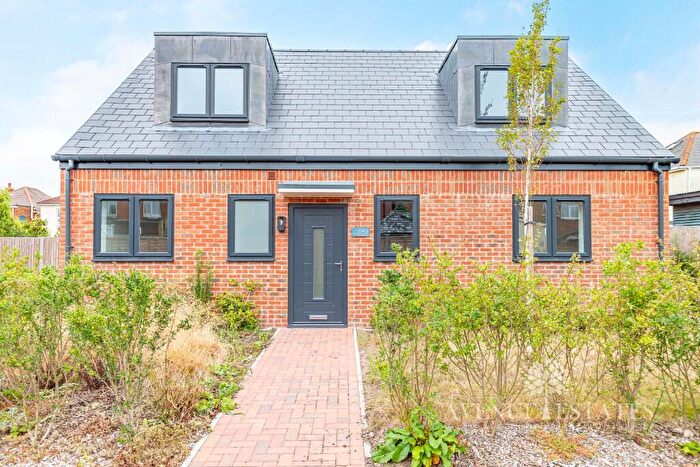
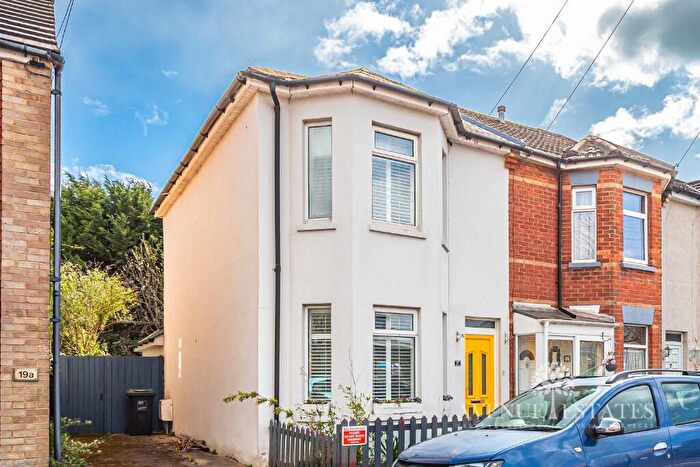
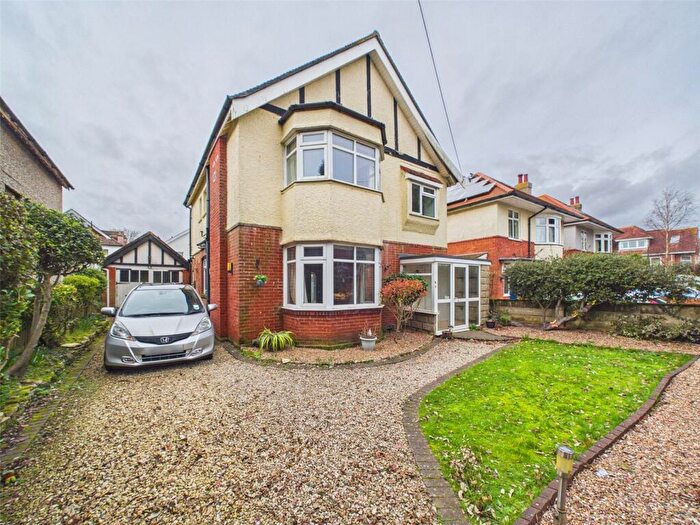
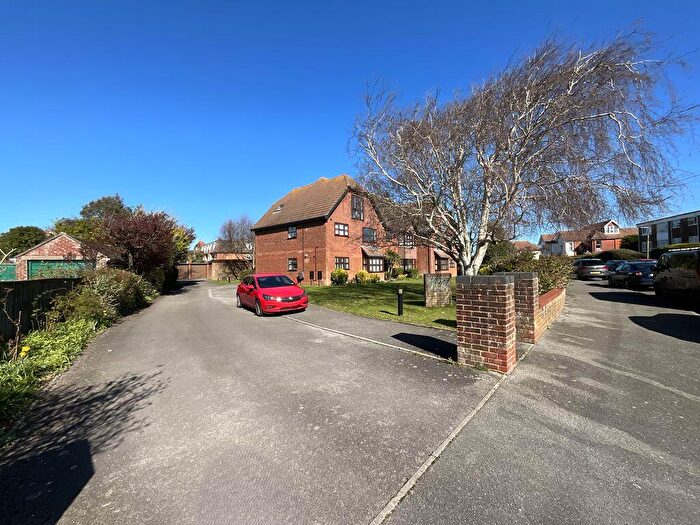
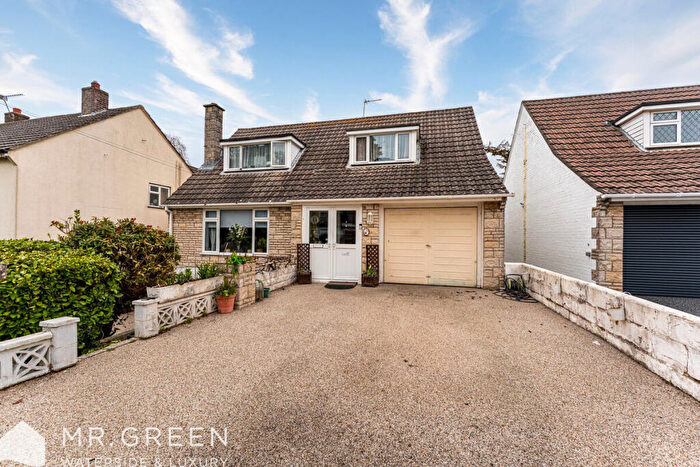
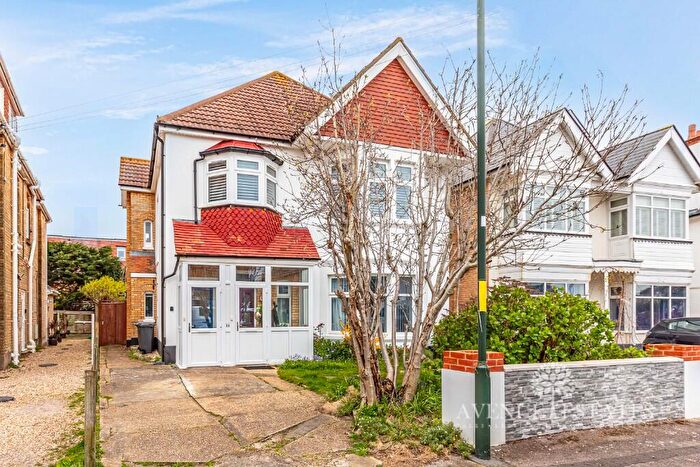
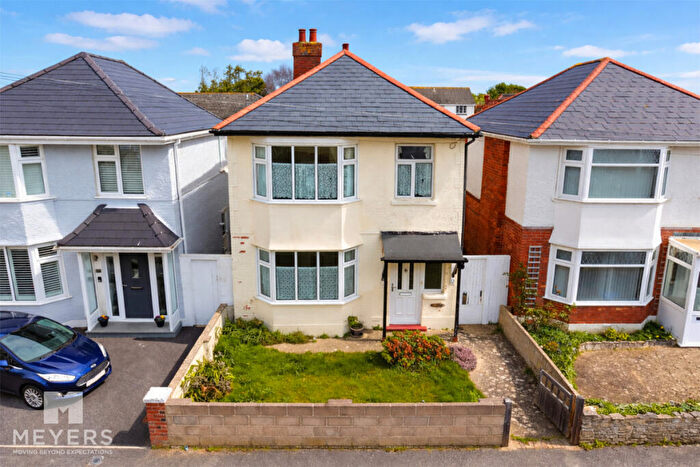
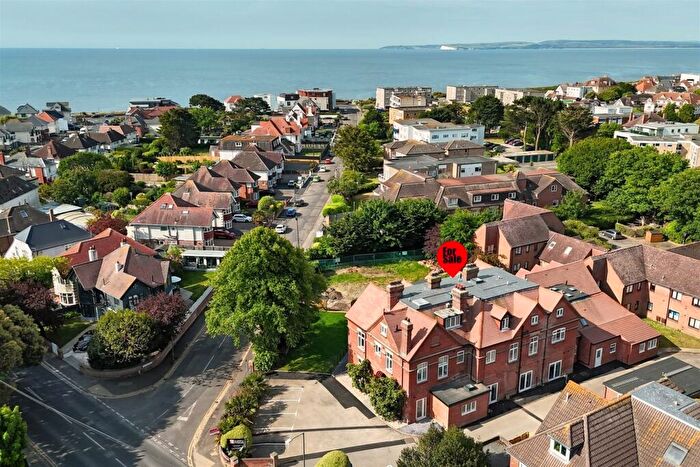
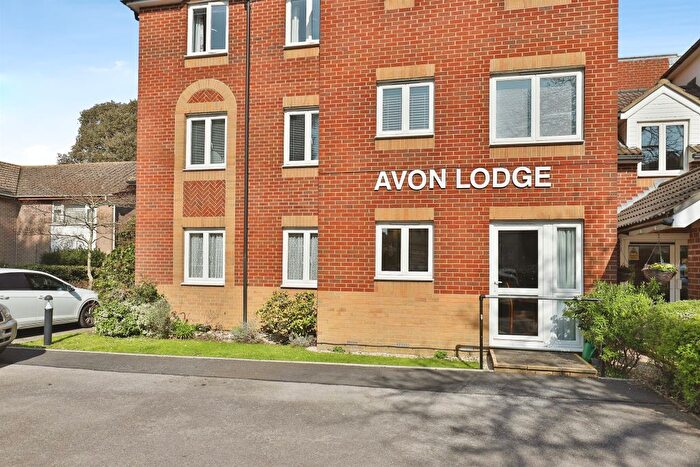
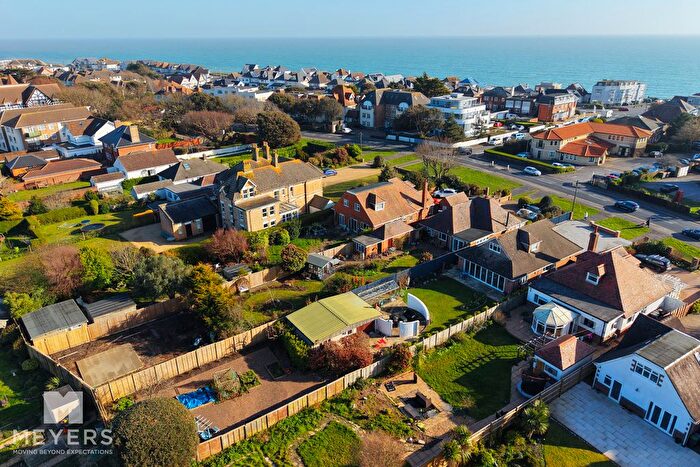
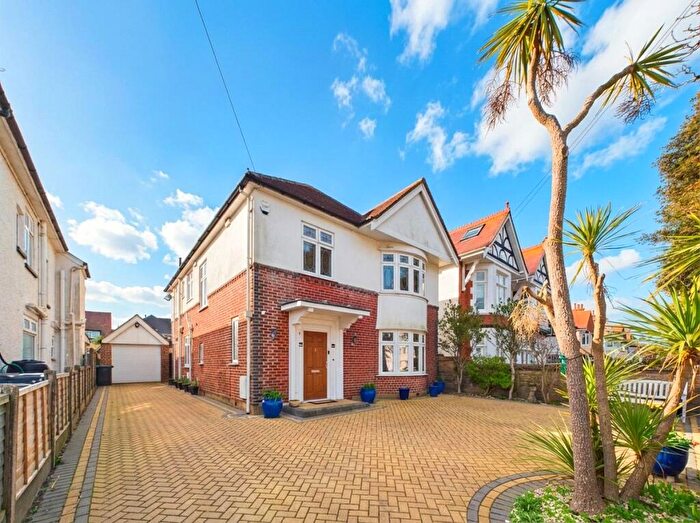
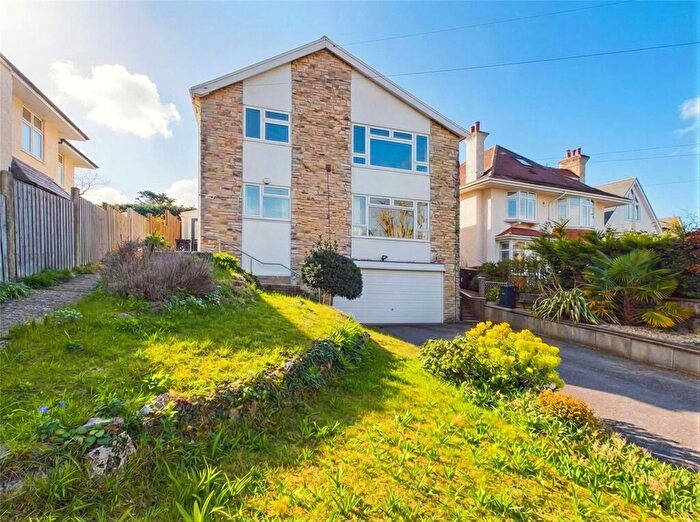
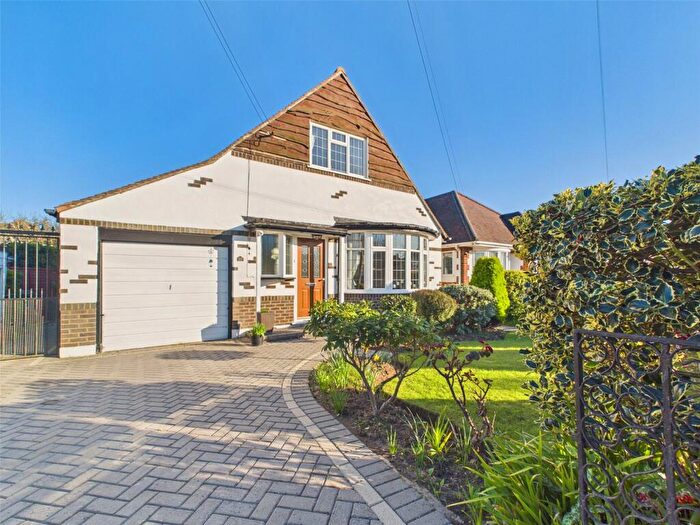
Properties for sale in West Southbourne
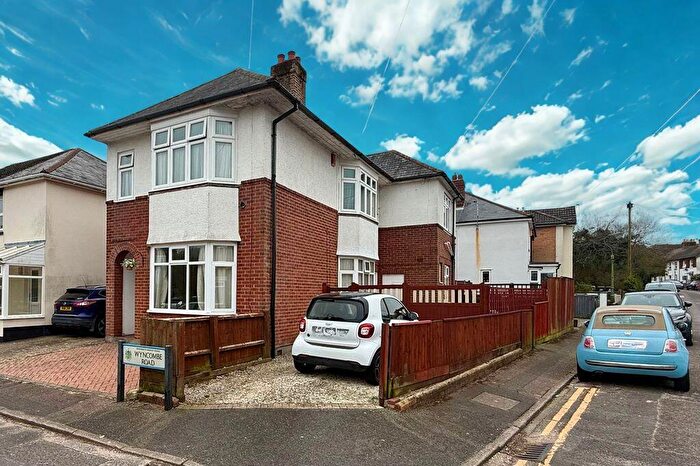
![]()
If you are looking to sell your house, let it out, or receive a property valuation, an expert can help you.
Click the button below to get started.

Roads and Postcodes in West Southbourne
Navigate through our locations to find the location of your next house in West Southbourne, Bournemouth for sale or to rent.
Transport near West Southbourne

- FAQ
- Price Paid By Year
- Property Type Price
Frequently asked questions about West Southbourne
What is the average price for a property for sale in West Southbourne?
The average price for a property for sale in West Southbourne is £412,239. This amount is 20% higher than the average price in Bournemouth. There are 2,544 property listings for sale in West Southbourne.
What streets have the most expensive properties for sale in West Southbourne?
The streets with the most expensive properties for sale in West Southbourne are Apple Grove at an average of £935,000, Carbery Avenue at an average of £780,000 and Lombard Avenue at an average of £745,000.
What streets have the most affordable properties for sale in West Southbourne?
The streets with the most affordable properties for sale in West Southbourne are Kittiwake Close at an average of £186,500, Douglas Mews at an average of £208,500 and Kingfisher Close at an average of £210,000.
Which train stations are available in or near West Southbourne?
Some of the train stations available in or near West Southbourne are Pokesdown, Christchurch and Bournemouth.
Property Price Paid in West Southbourne by Year
The average sold property price by year was:
| Year | Average Sold Price | Price Change |
Sold Properties
|
|---|---|---|---|
| 2026 | £267,333 | -48% |
3 Properties |
| 2025 | £394,342 | -6% |
147 Properties |
| 2024 | £416,456 | -4% |
147 Properties |
| 2023 | £433,508 | -2% |
115 Properties |
| 2022 | £444,067 | 12% |
170 Properties |
| 2021 | £390,302 | 11% |
207 Properties |
| 2020 | £347,768 | 9% |
148 Properties |
| 2019 | £316,229 | -4% |
179 Properties |
| 2018 | £329,269 | 15% |
155 Properties |
| 2017 | £280,322 | -5% |
192 Properties |
| 2016 | £293,715 | 2% |
216 Properties |
| 2015 | £288,169 | 18% |
235 Properties |
| 2014 | £235,052 | 4% |
241 Properties |
| 2013 | £226,306 | 1% |
163 Properties |
| 2012 | £225,067 | -5% |
143 Properties |
| 2011 | £236,628 | 6% |
151 Properties |
| 2010 | £221,263 | 12% |
153 Properties |
| 2009 | £194,391 | -17% |
149 Properties |
| 2008 | £226,714 | -1% |
150 Properties |
| 2007 | £228,718 | 5% |
282 Properties |
| 2006 | £216,931 | 11% |
326 Properties |
| 2005 | £193,570 | -12% |
255 Properties |
| 2004 | £217,120 | 21% |
302 Properties |
| 2003 | £170,495 | 10% |
290 Properties |
| 2002 | £154,046 | 20% |
340 Properties |
| 2001 | £123,449 | 4% |
352 Properties |
| 2000 | £118,423 | 24% |
271 Properties |
| 1999 | £90,034 | 4% |
320 Properties |
| 1998 | £86,424 | 16% |
276 Properties |
| 1997 | £72,532 | 10% |
214 Properties |
| 1996 | £65,328 | 8% |
228 Properties |
| 1995 | £60,117 | - |
176 Properties |
Property Price per Property Type in West Southbourne
Here you can find historic sold price data in order to help with your property search.
The average Property Paid Price for specific property types in the last three years are:
| Property Type | Average Sold Price | Sold Properties |
|---|---|---|
| Flat | £288,817.00 | 185 Flats |
| Semi Detached House | £405,568.00 | 60 Semi Detached Houses |
| Detached House | £583,890.00 | 144 Detached Houses |
| Terraced House | £347,708.00 | 23 Terraced Houses |