
Houses for sale & to rent in Bournemouth, England
House Prices in Bournemouth
Properties in Bournemouth have
an average house price of
£342k
and had 8,771 Property Transactions
within the last 3 years.¹
Bournemouth is a location in
England with
81,951 households², where the most expensive property was sold for £2.63M.
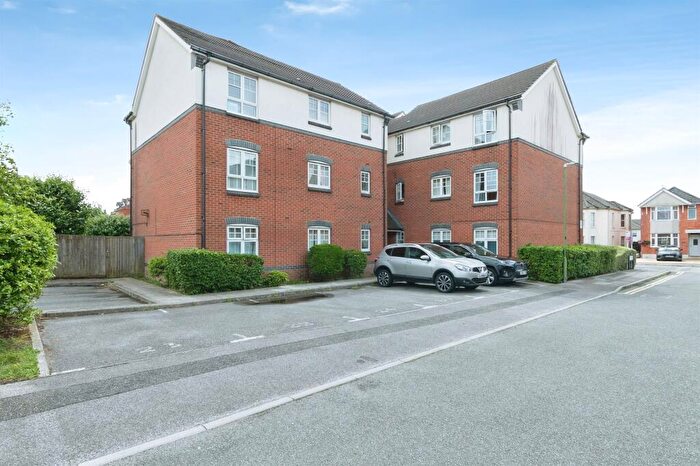
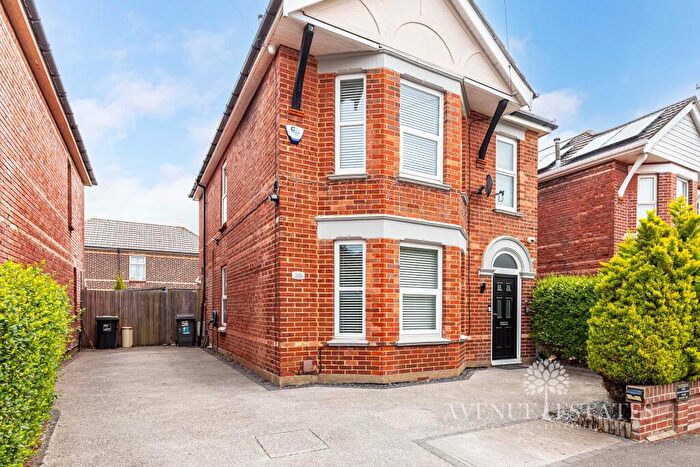
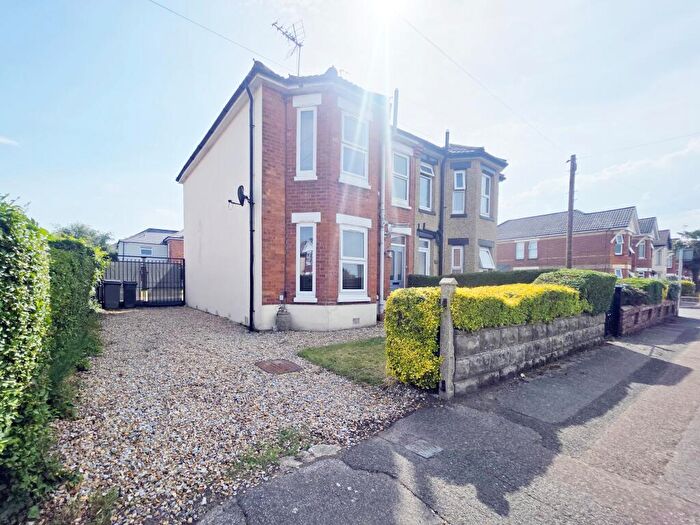
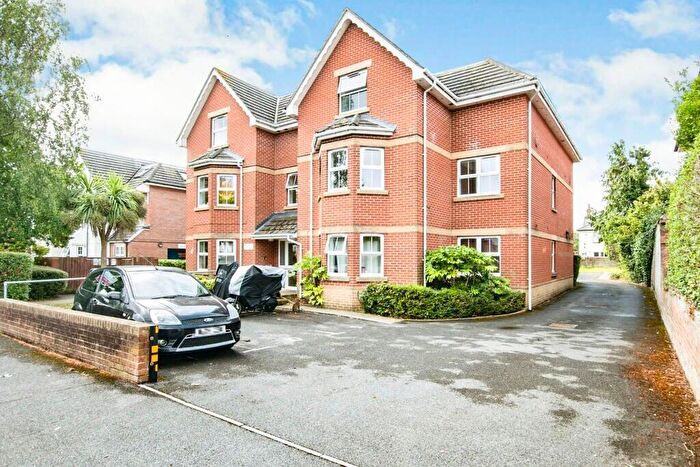
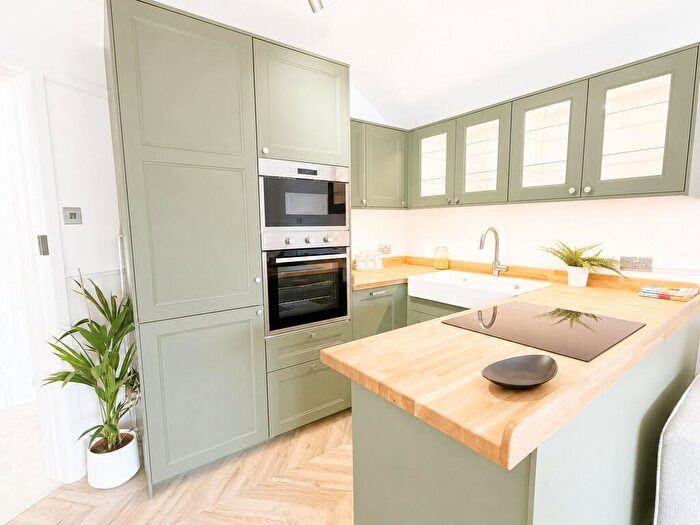
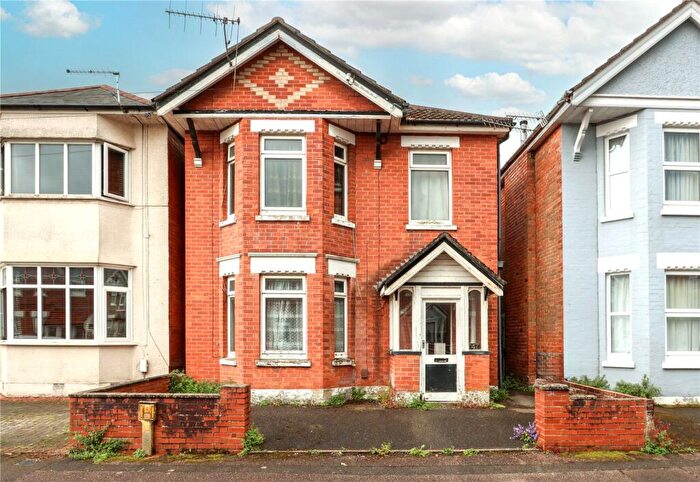
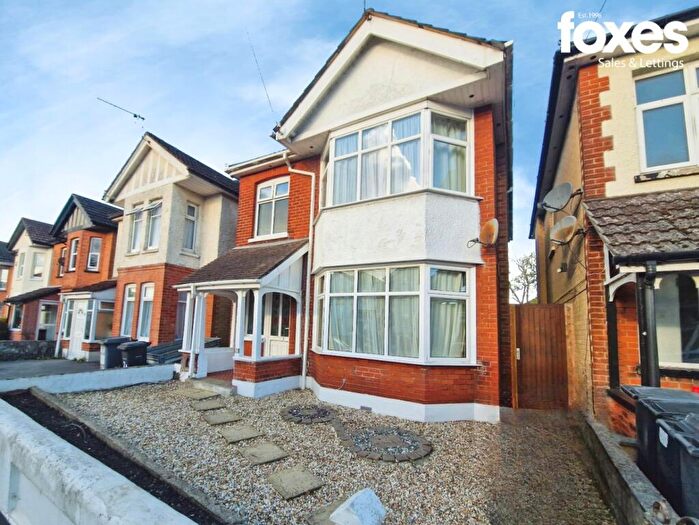
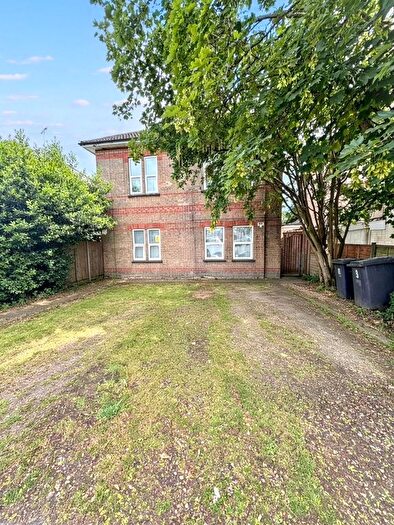
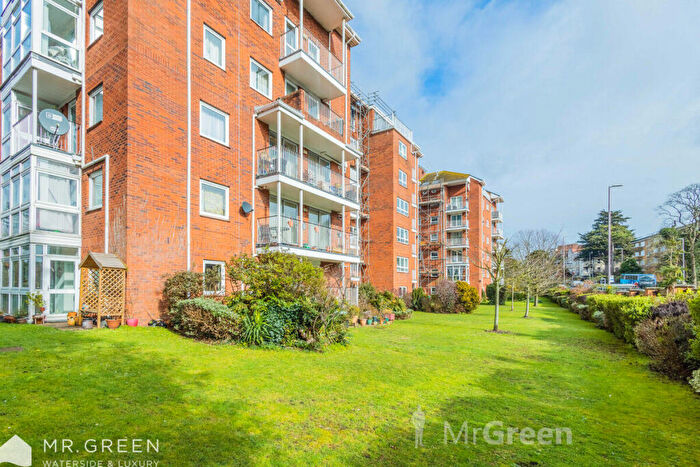
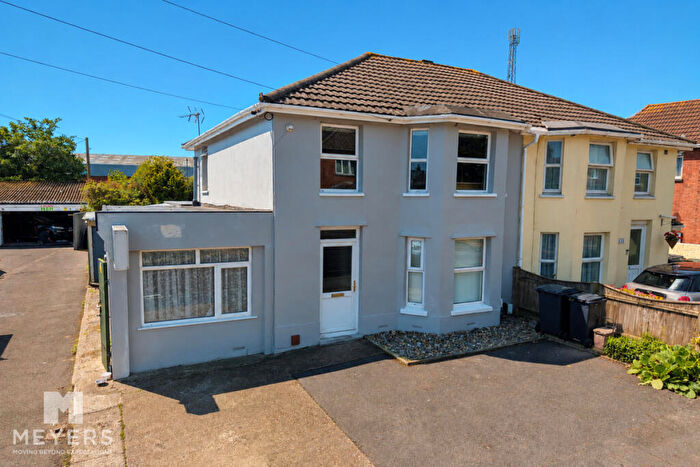
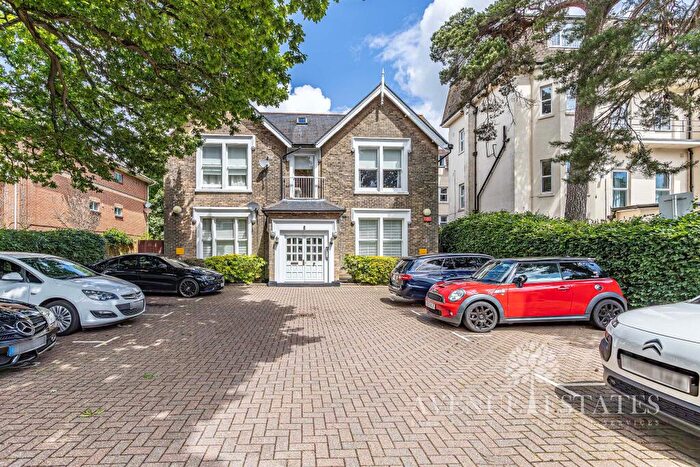
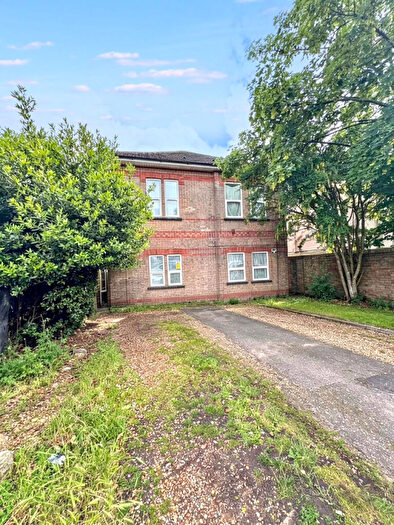
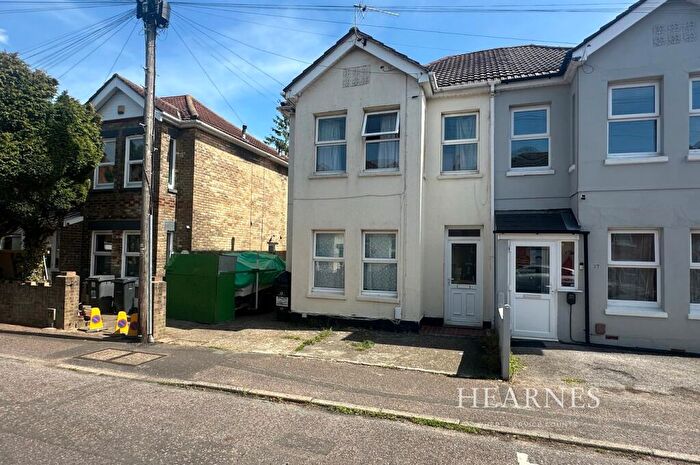
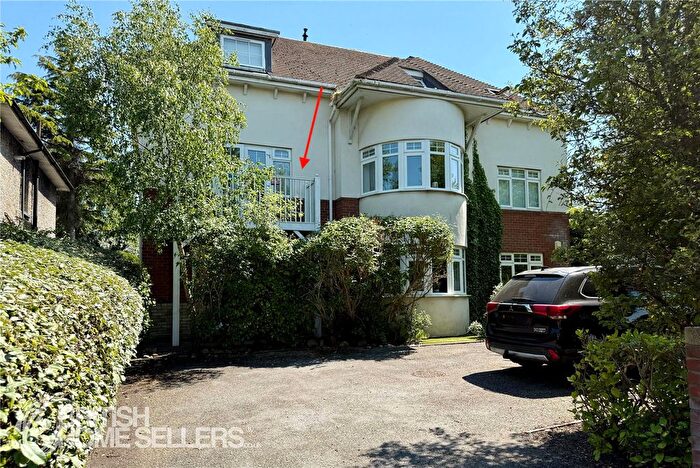
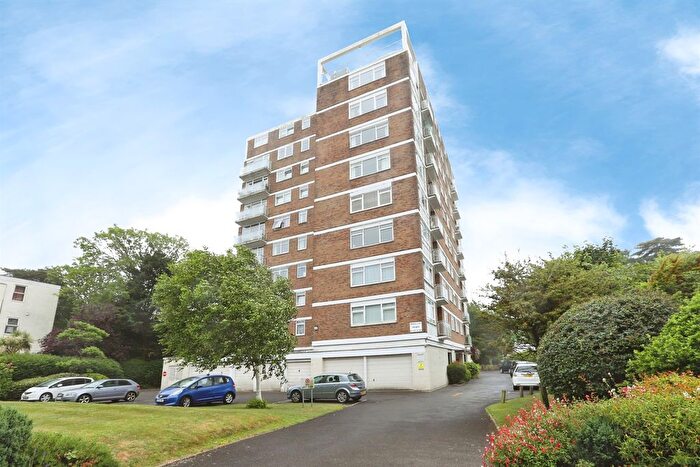
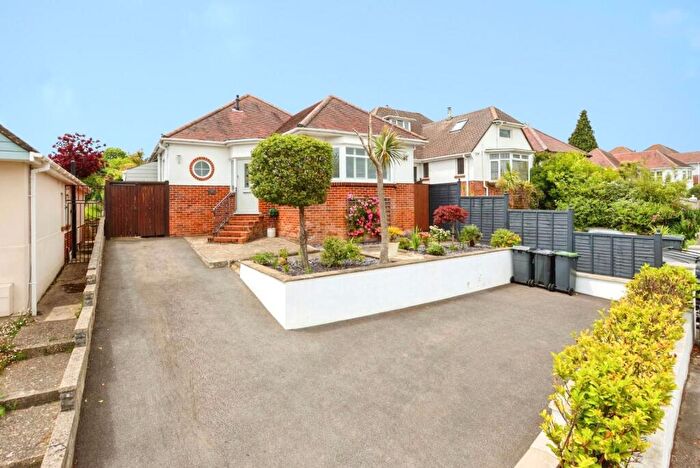
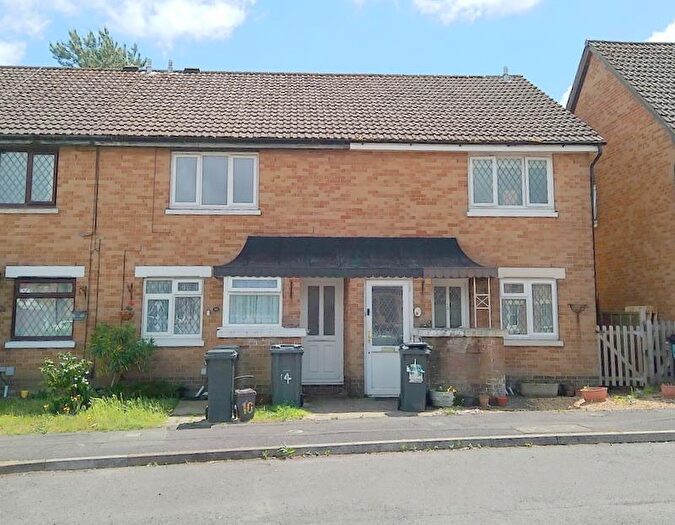
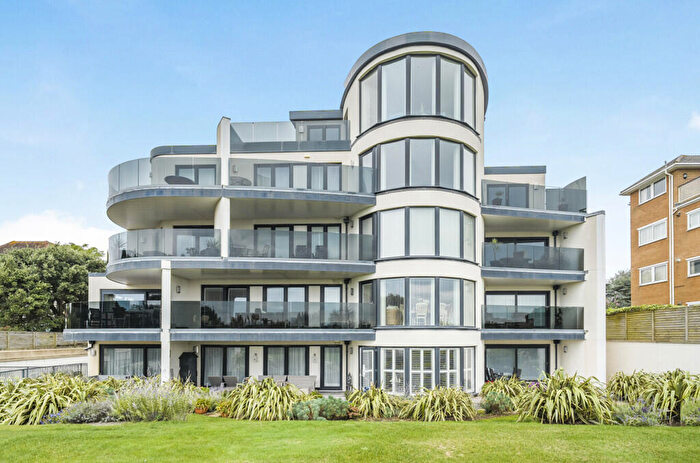
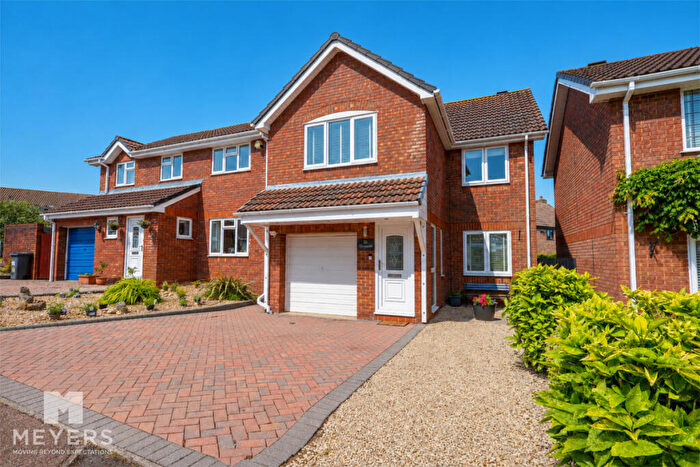
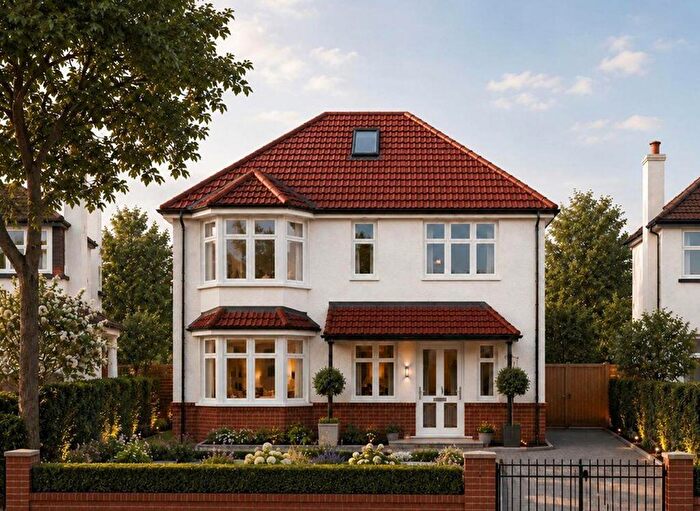
Properties for sale in Bournemouth
![]()
If you are looking to sell your house, let it out, or receive a property valuation, an expert can help you.
Click the button below to get started.


Towns in Bournemouth
Navigate through our locations to find the location of your next house in Bournemouth, England for sale or to rent.
Transport in Bournemouth
Please see below transportation links in this area:

- FAQ
- Price Paid By Year
- Property Type Price
Frequently asked questions about Bournemouth
What is the average price for a property for sale in Bournemouth?
The average price for a property for sale in Bournemouth is £341,913. This amount is 5% lower than the average price in England. There are more than 10,000 property listings for sale in Bournemouth.
Which train stations are available in or near Bournemouth?
Some of the train stations available in or near Bournemouth are Bournemouth, Pokesdown and Branksome.
Property Price Paid in Bournemouth by Year
The average sold property price by year was:
| Year | Average Sold Price | Price Change |
Sold Properties
|
|---|---|---|---|
| 2026 | £347,271 | 2% |
400 Properties |
| 2025 | £340,643 | 0,4% |
2,688 Properties |
| 2024 | £339,315 | -2% |
2,902 Properties |
| 2023 | £345,081 | 2% |
2,781 Properties |
| 2022 | £337,514 | 5% |
3,673 Properties |
| 2021 | £321,984 | 6% |
4,582 Properties |
| 2020 | £301,948 | 7% |
3,108 Properties |
| 2019 | £281,100 | 1% |
3,460 Properties |
| 2018 | £277,536 | 5% |
3,834 Properties |
| 2017 | £264,901 | 6% |
3,996 Properties |
| 2016 | £248,106 | 2% |
4,350 Properties |
| 2015 | £243,706 | 6% |
4,359 Properties |
| 2014 | £228,026 | 5% |
4,253 Properties |
| 2013 | £216,956 | - |
3,429 Properties |
| 2012 | £216,916 | -0,4% |
2,758 Properties |
| 2011 | £217,744 | -2% |
2,916 Properties |
| 2010 | £221,723 | 10% |
2,802 Properties |
| 2009 | £199,974 | -8% |
3,012 Properties |
| 2008 | £216,066 | -2% |
3,088 Properties |
| 2007 | £220,998 | 6% |
6,029 Properties |
| 2006 | £206,878 | 6% |
6,203 Properties |
| 2005 | £195,175 | 1% |
4,804 Properties |
| 2004 | £192,248 | 10% |
5,829 Properties |
| 2003 | £173,552 | 16% |
5,925 Properties |
| 2002 | £146,638 | 19% |
6,477 Properties |
| 2001 | £119,119 | 11% |
5,907 Properties |
| 2000 | £105,677 | 17% |
5,280 Properties |
| 1999 | £87,626 | 10% |
5,954 Properties |
| 1998 | £78,926 | 10% |
5,081 Properties |
| 1997 | £70,866 | 10% |
5,043 Properties |
| 1996 | £63,798 | 6% |
4,557 Properties |
| 1995 | £60,219 | - |
3,449 Properties |
Property Price per Property Type in Bournemouth
Here you can find historic sold price data in order to help with your property search.
The average Property Paid Price for specific property types in the last three years are:
| Property Type | Average Sold Price | Sold Properties |
|---|---|---|
| Semi Detached House | £344,518.00 | 1,109 Semi Detached Houses |
| Terraced House | £314,497.00 | 679 Terraced Houses |
| Detached House | £515,875.00 | 2,839 Detached Houses |
| Flat | £226,528.00 | 4,144 Flats |