
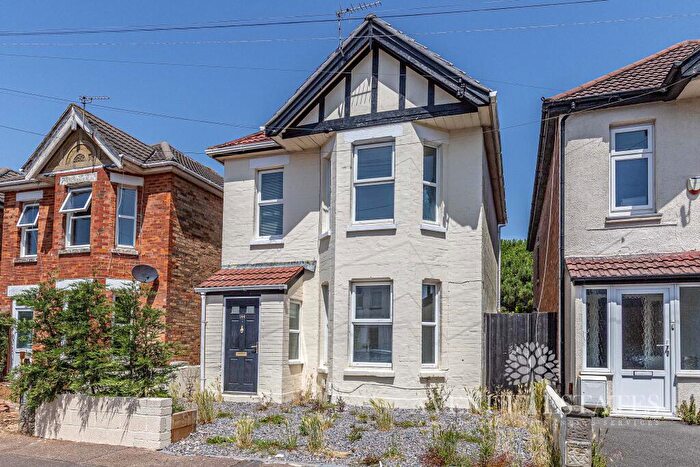
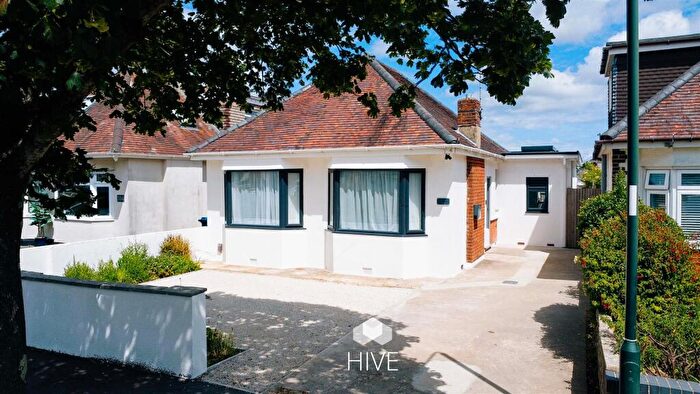
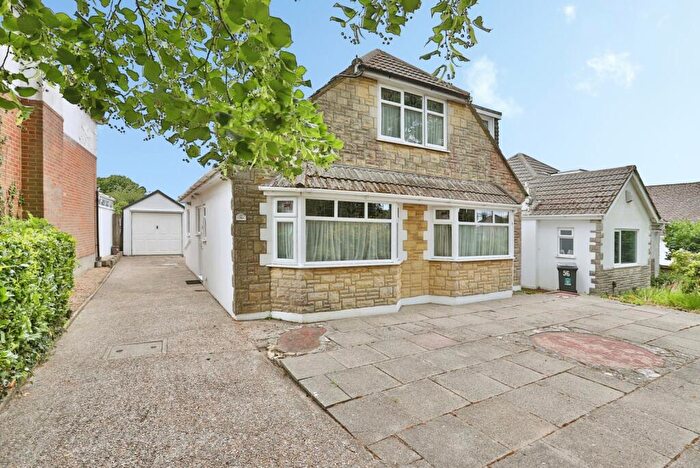
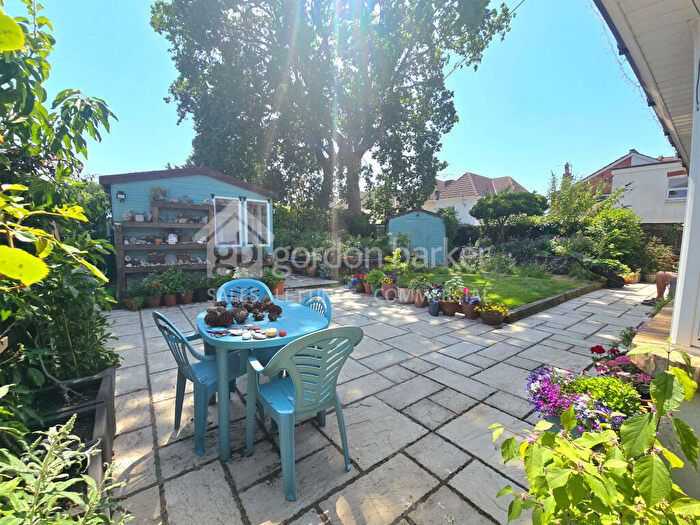
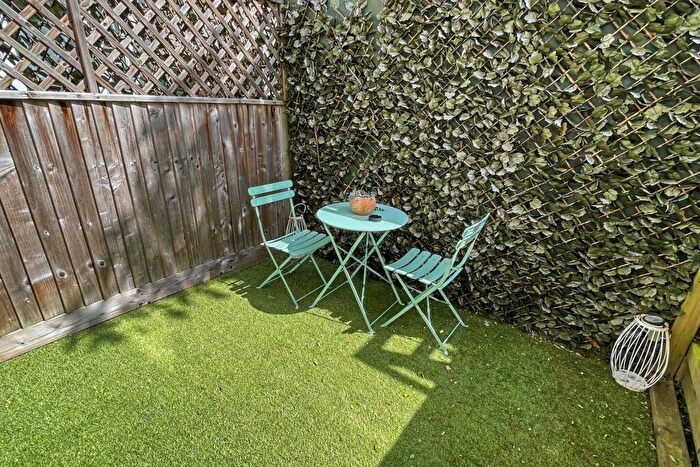
Houses for sale in Bournemouth, Bournemouth
House Prices in Bournemouth
Properties in Bournemouth have an average house price of £342k and had 8,510 Property Transactions within the last 3 years.¹
Bournemouth is an area in Bournemouth with 84,800 households², where the most expensive property was sold for £2.63M.
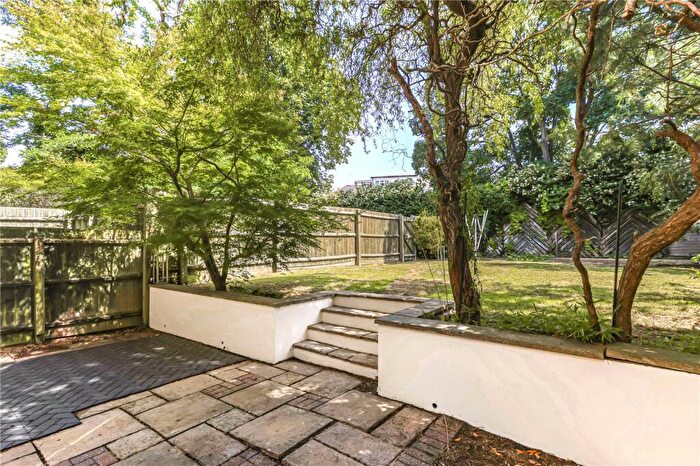
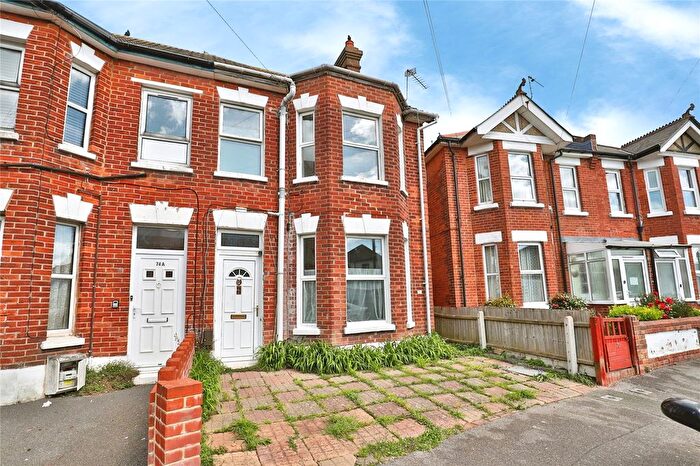
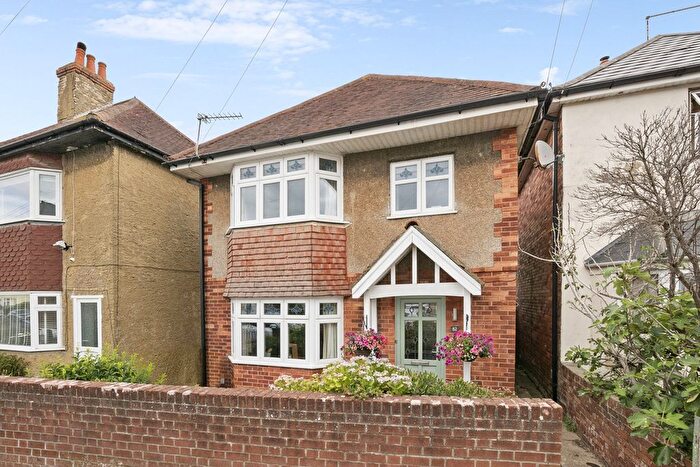
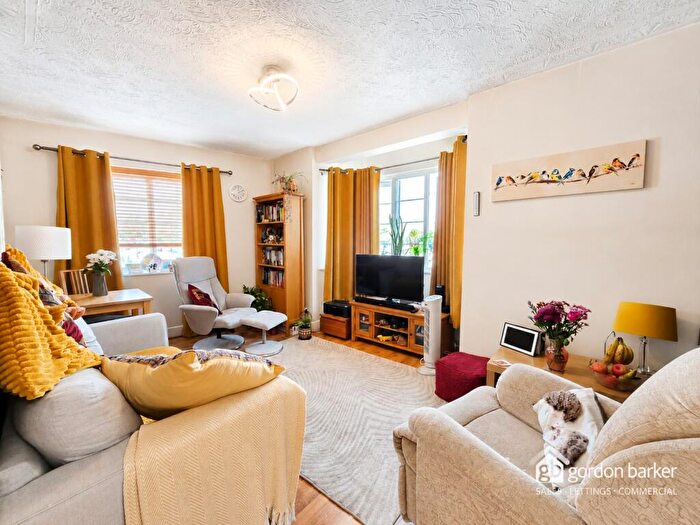
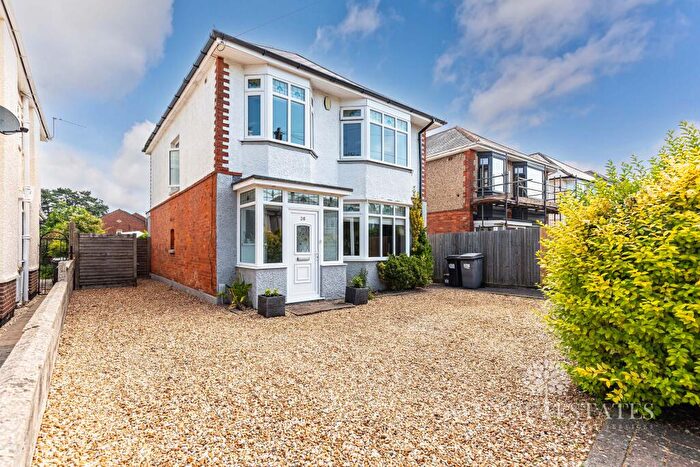
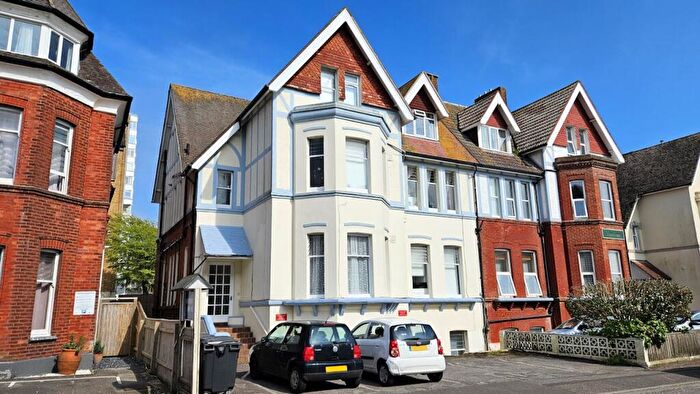
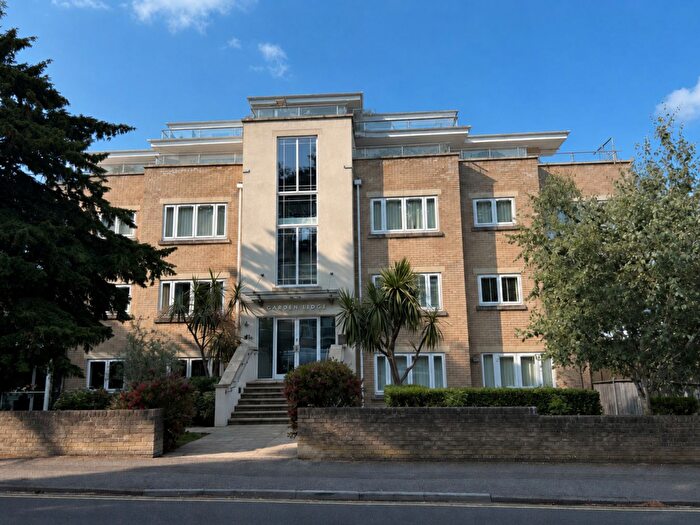
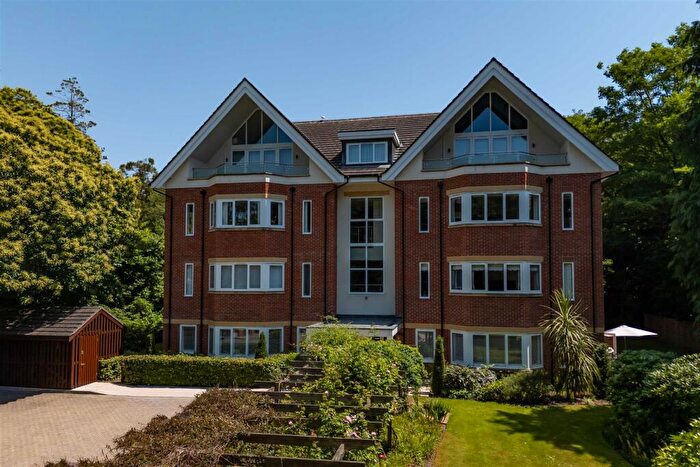
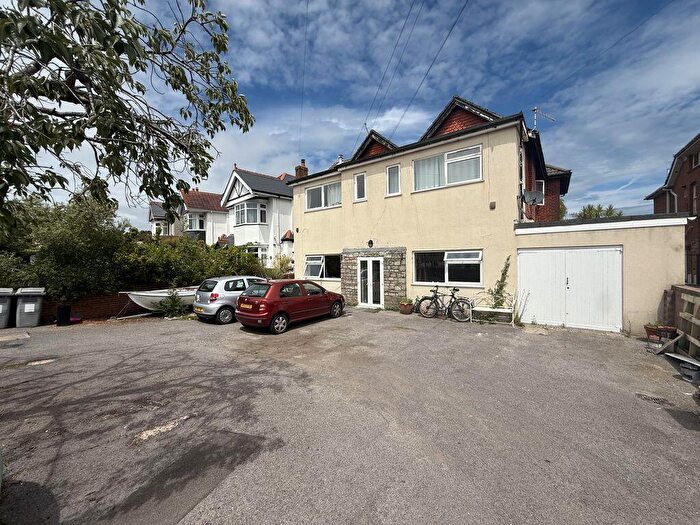
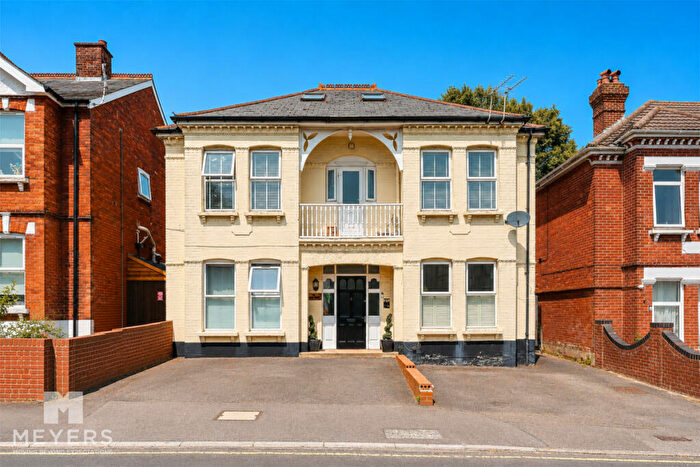
Properties for sale in Bournemouth
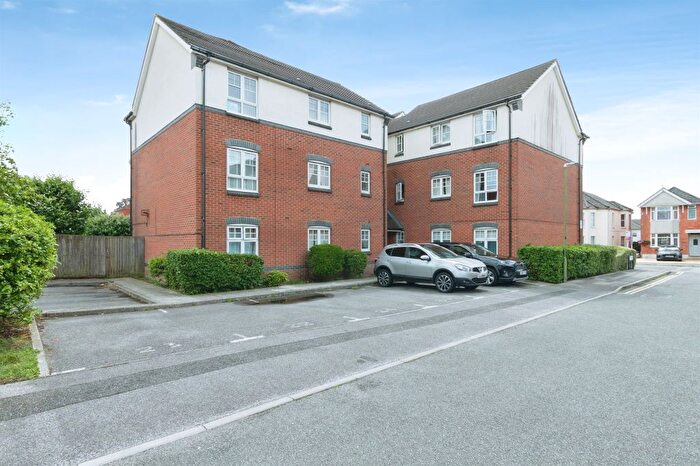
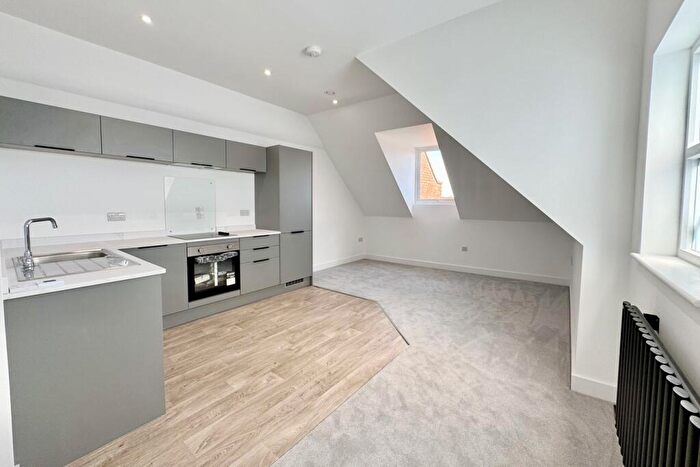
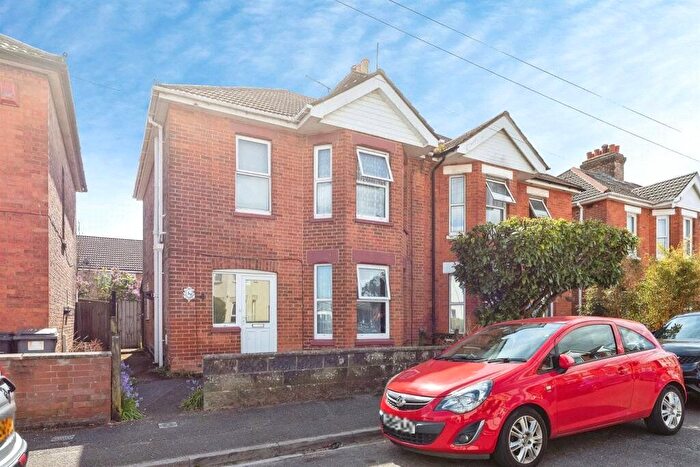
![]()
If you are looking to sell your house, let it out, or receive a property valuation, an expert can help you.
Click the button below to get started.
Neighbourhoods in Bournemouth
Navigate through our locations to find the location of your next house in Bournemouth, Bournemouth for sale or to rent.
- Boscombe East
- Boscombe West
- Central
- East Cliff And Springbourne
- East Southbourne And Tuckton
- Kinson North
- Kinson South
- Littledown And Iford
- Moordown
- Queens Park
- Redhill And Northbourne
- Strouden Park
- Talbot And Branksome Woods
- Throop And Muscliff
- Wallisdown And Winton West
- West Southbourne
- Westbourne And West Cliff
- Winton East
- Bournemouth Central
- East Cliff & Springbourne
- Westbourne & West Cliff
- Boscombe East & Pokesdown
- Littledown & Ilford
- Wallisdown & Winton West
- Redhill & Northbourne
- Kinson
- Muscliff & Strouden Park
- Talbot & Branksome Woods
- East Southbourne & Tuckton
Property price trends in Bournemouth
According to the latest Land Registry data, the average home in Bournemouth sold for £346,528 in 2026. That figure comes from a substantial record of 132,667 sales logged over the past 31 years.
Prices have held fairly steady over the last three years. Compared with 2023, when the typical sale came in around £345,131, values are broadly unchanged.
Looking back five years, average prices are up about 7.6% since 2021, a gain of around £24,544 in cash terms.
Zoom out to the past decade for the fuller picture. Back in 2016, homes here averaged £248,106, so the typical sold price has climbed about 39.7% since then, roughly 3.4% a year. Stretch the view to fifteen years and that annual pace eases back to about 3.1%.
Frequently asked questions about Bournemouth
What is the average price for a property for sale in Bournemouth?
The average price for a property for sale in Bournemouth is £342,354. This amount is 0.31% higher than the average price in Bournemouth. There are more than 10,000 property listings for sale in Bournemouth.
What locations have the most expensive properties for sale in Bournemouth?
The locations with the most expensive properties for sale in Bournemouth are East Southbourne And Tuckton at an average of £495,687, Talbot And Branksome Woods at an average of £494,326 and Littledown And Iford at an average of £475,587.
What locations have the most affordable properties for sale in Bournemouth?
The locations with the most affordable properties for sale in Bournemouth are East Cliff & Springbourne at an average of £197,762, Boscombe West at an average of £200,931 and Bournemouth Central at an average of £220,870.
Which train stations are available in or near Bournemouth?
Some of the train stations available in or near Bournemouth are Bournemouth, Pokesdown and Branksome.
Property Price Paid in Bournemouth by Year
The average sold property price by year was:
| Year | Average Sold Price | Price Change |
Sold Properties
|
|---|---|---|---|
| 2026 | £346,528 | 1% |
253 Properties |
| 2025 | £342,260 | 1% |
2,576 Properties |
| 2024 | £339,411 | -2% |
2,901 Properties |
| 2023 | £345,131 | 2% |
2,780 Properties |
| 2022 | £337,518 | 5% |
3,673 Properties |
| 2021 | £321,984 | 6% |
4,582 Properties |
| 2020 | £301,996 | 7% |
3,107 Properties |
| 2019 | £281,100 | 1% |
3,460 Properties |
| 2018 | £277,536 | 5% |
3,834 Properties |
| 2017 | £264,901 | 6% |
3,996 Properties |
Property Price per Property Type in Bournemouth
Here you can find historic sold price data in order to help with your property search.
The average Property Paid Price for specific property types in the last three years are:
| Property Type | Average Sold Price | Sold Properties |
|---|---|---|
| Semi Detached House | £343,704.00 | 1,068 Semi Detached Houses |
| Terraced House | £314,144.00 | 658 Terraced Houses |
| Detached House | £517,935.00 | 2,750 Detached Houses |
| Flat | £226,903.00 | 4,034 Flats |
Transport in Bournemouth
Please see below transportation links in this area:
