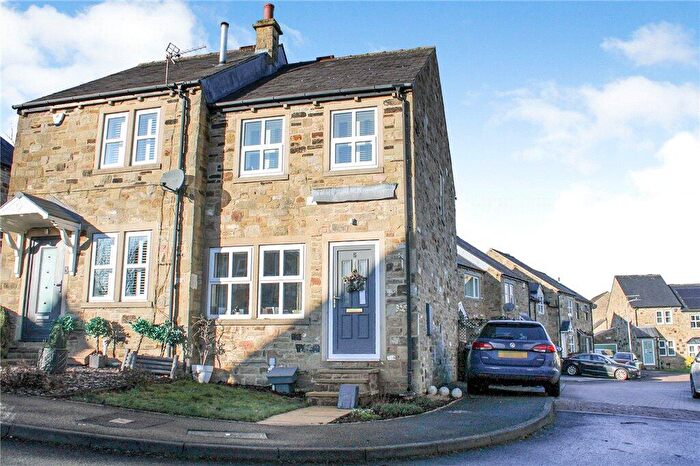
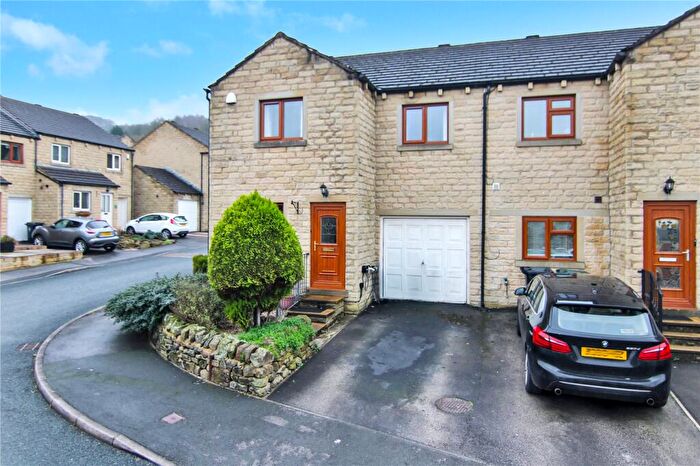
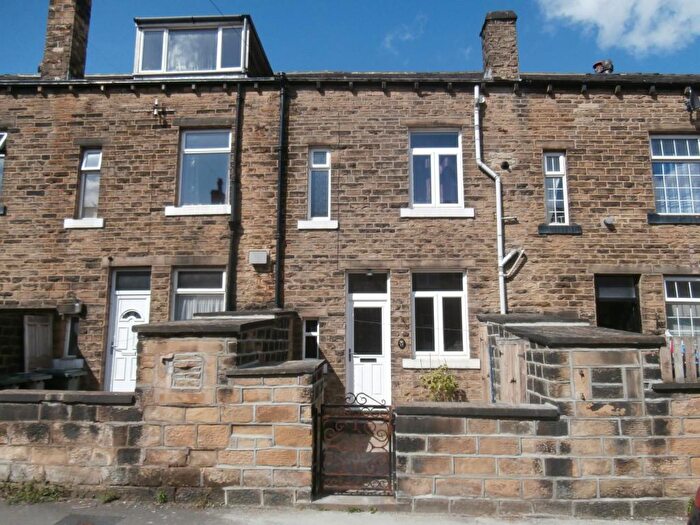
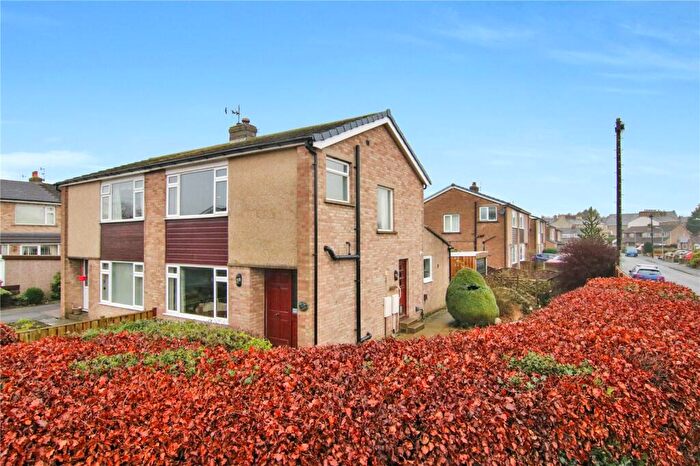
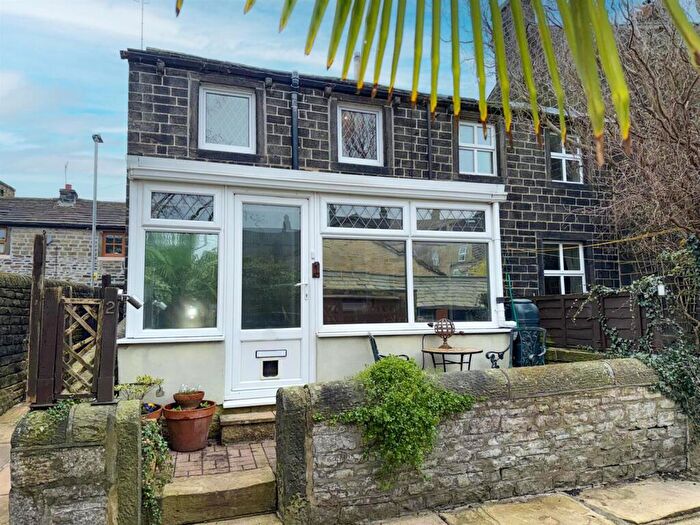
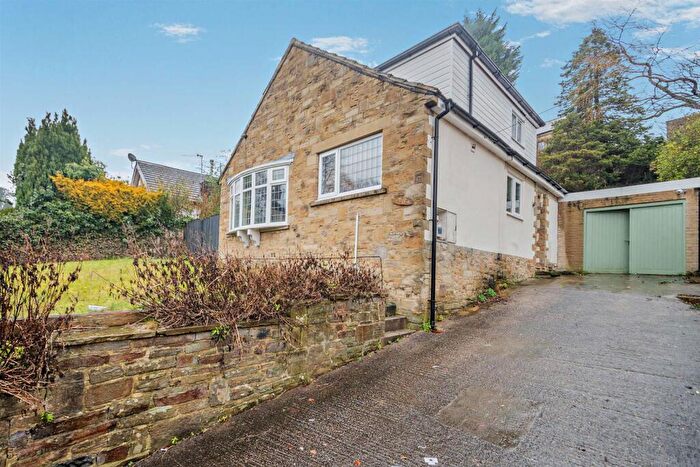
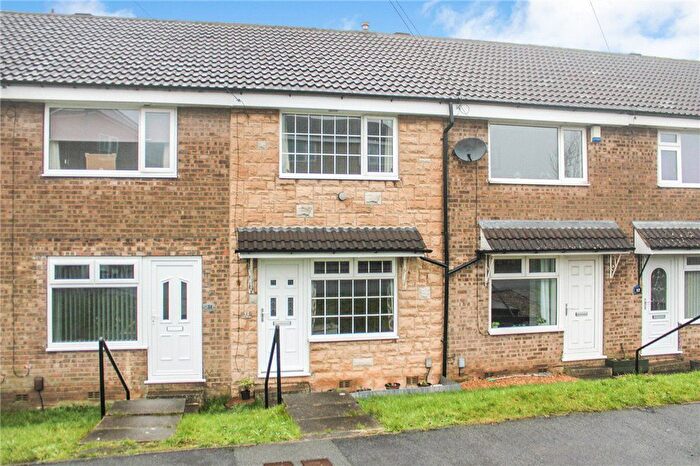
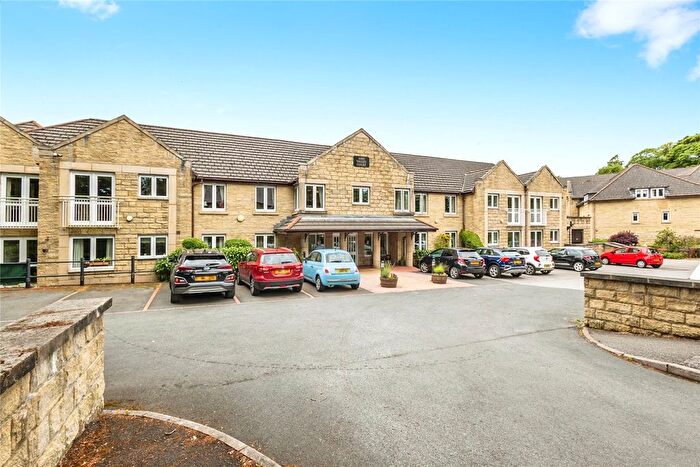
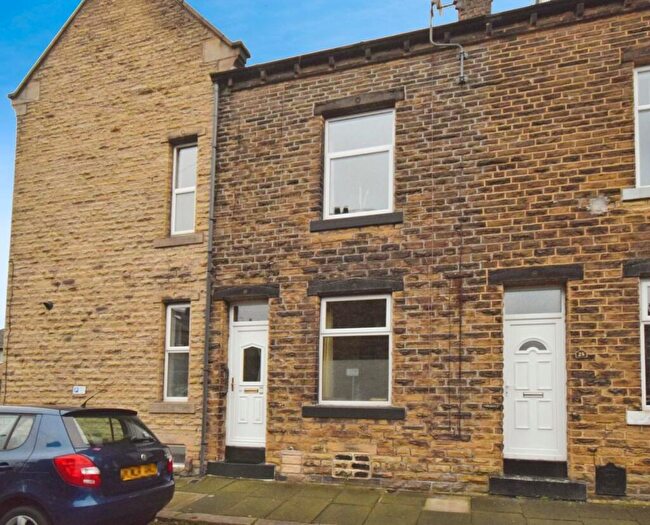
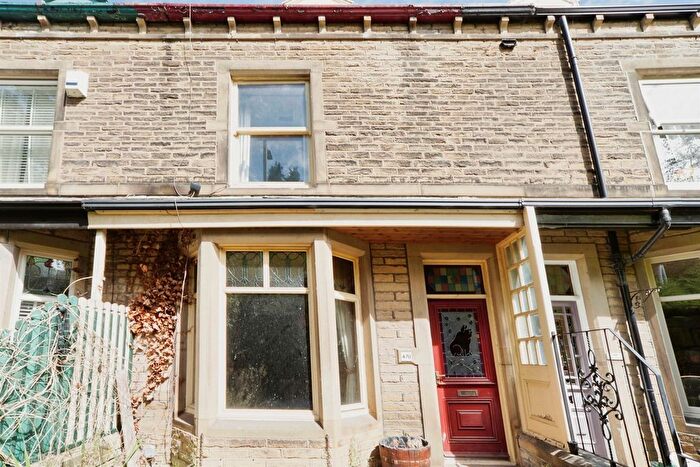
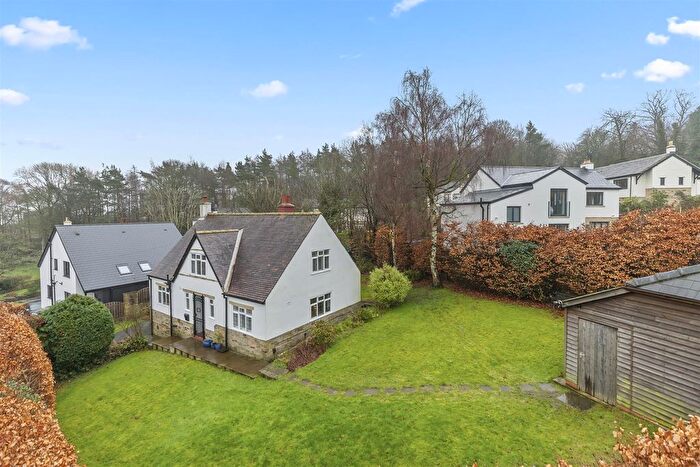
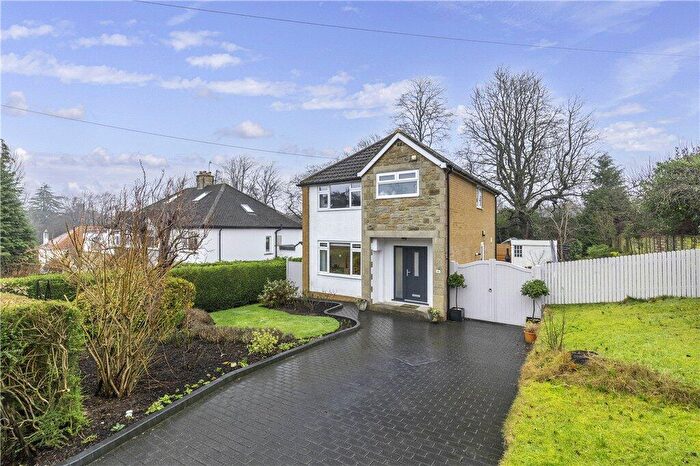
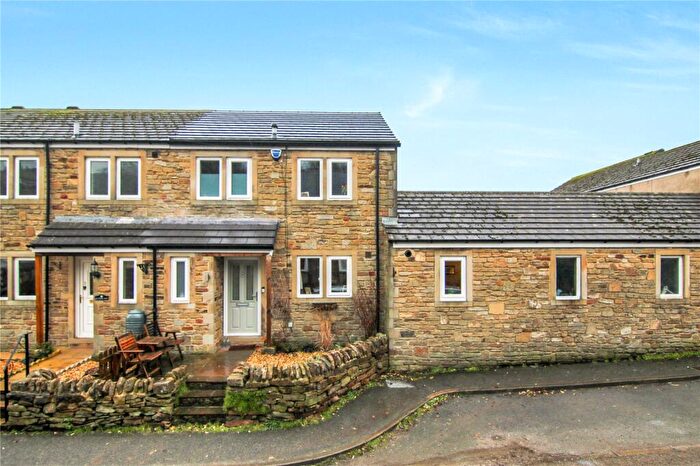
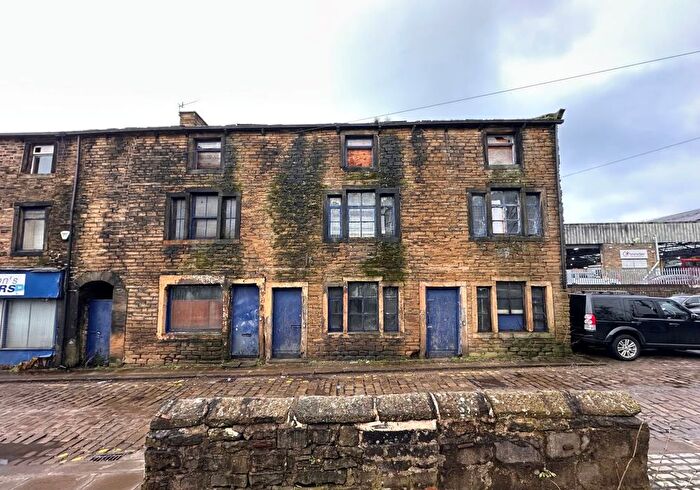
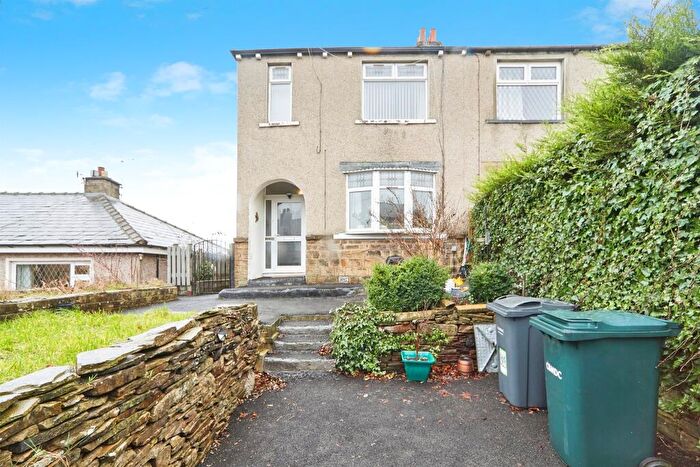
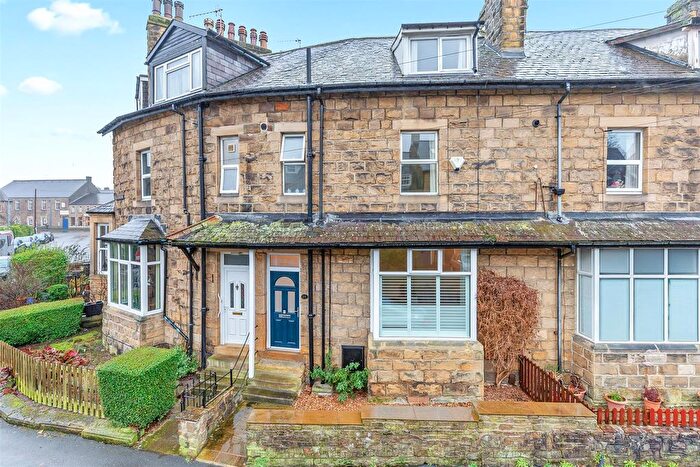
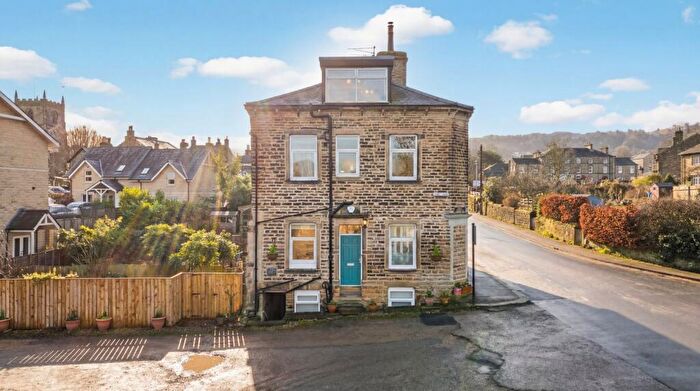
Houses for sale & to rent in Keighley, Bradford
House Prices in Keighley
Properties in Keighley have an average house price of £192,406.00 and had 3,193 Property Transactions within the last 3 years.¹
Keighley is an area in Bradford with 31,674 households², where the most expensive property was sold for £1,095,000.00.
Properties for sale in Keighley
Neighbourhoods in Keighley
Navigate through our locations to find the location of your next house in Keighley, Bradford for sale or to rent.
Transport in Keighley
Please see below transportation links in this area:
- FAQ
- Price Paid By Year
- Property Type Price
Frequently asked questions about Keighley
What is the average price for a property for sale in Keighley?
The average price for a property for sale in Keighley is £192,406. This amount is 4% lower than the average price in Bradford. There are more than 10,000 property listings for sale in Keighley.
What locations have the most expensive properties for sale in Keighley?
The locations with the most expensive properties for sale in Keighley are Craven at an average of £244,814, Worth Valley at an average of £208,080 and Keighley East at an average of £190,776.
What locations have the most affordable properties for sale in Keighley?
The locations with the most affordable properties for sale in Keighley are Keighley Central at an average of £143,635 and Keighley West at an average of £156,838.
Which train stations are available in or near Keighley?
Some of the train stations available in or near Keighley are Keighley, Steeton and Silsden and Crossflatts.
Property Price Paid in Keighley by Year
The average sold property price by year was:
| Year | Average Sold Price | Price Change |
Sold Properties
|
|---|---|---|---|
| 2025 | £206,042 | 8% |
974 Properties |
| 2024 | £188,988 | 3% |
1,165 Properties |
| 2023 | £183,582 | 2% |
1,054 Properties |
| 2022 | £179,832 | 1% |
1,409 Properties |
| 2021 | £178,537 | 7% |
1,672 Properties |
| 2020 | £166,294 | 1% |
1,165 Properties |
| 2019 | £163,816 | 3% |
1,477 Properties |
| 2018 | £158,718 | 8% |
1,471 Properties |
| 2017 | £145,342 | -6% |
1,672 Properties |
| 2016 | £153,921 | 6% |
1,297 Properties |
| 2015 | £144,065 | 2% |
1,256 Properties |
| 2014 | £140,533 | 4% |
1,239 Properties |
| 2013 | £135,290 | 3% |
965 Properties |
| 2012 | £131,344 | -4% |
688 Properties |
| 2011 | £136,970 | -5% |
705 Properties |
| 2010 | £143,219 | 5% |
753 Properties |
| 2009 | £135,925 | -7% |
790 Properties |
| 2008 | £145,059 | -1% |
892 Properties |
| 2007 | £146,911 | 6% |
1,875 Properties |
| 2006 | £137,700 | 8% |
2,028 Properties |
| 2005 | £126,078 | 12% |
1,769 Properties |
| 2004 | £111,338 | 17% |
1,940 Properties |
| 2003 | £92,576 | 17% |
2,021 Properties |
| 2002 | £76,889 | 14% |
2,109 Properties |
| 2001 | £66,491 | 12% |
1,943 Properties |
| 2000 | £58,606 | 9% |
1,659 Properties |
| 1999 | £53,169 | -4% |
1,600 Properties |
| 1998 | £55,340 | 6% |
1,488 Properties |
| 1997 | £52,011 | 6% |
1,532 Properties |
| 1996 | £48,904 | 5% |
1,422 Properties |
| 1995 | £46,234 | - |
1,139 Properties |
Property Price per Property Type in Keighley
Here you can find historic sold price data in order to help with your property search.
The average Property Paid Price for specific property types in the last three years are:
| Property Type | Average Sold Price | Sold Properties |
|---|---|---|
| Semi Detached House | £202,219.00 | 976 Semi Detached Houses |
| Terraced House | £144,594.00 | 1,575 Terraced Houses |
| Detached House | £338,599.00 | 511 Detached Houses |
| Flat | £123,855.00 | 131 Flats |

