
Houses for sale in Bradford, England
House Prices in Bradford
Properties in Bradford have
an average house price of
£202k
and had 21,495 Property Transactions
within the last 3 years.¹
Bradford is a location in
England with
210,782 households², where the most expensive property was sold for £4.88M.
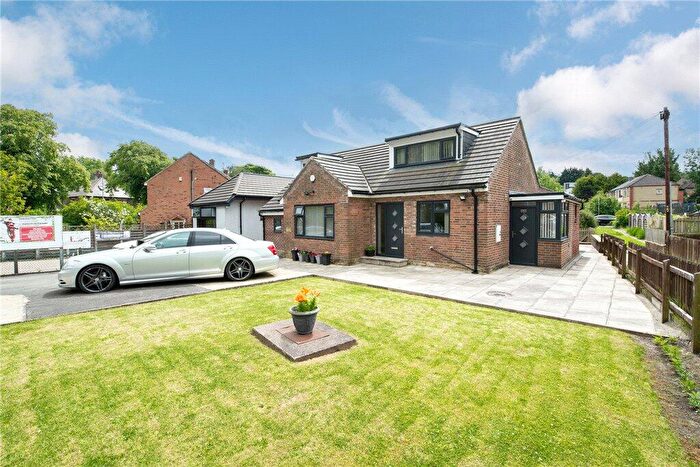
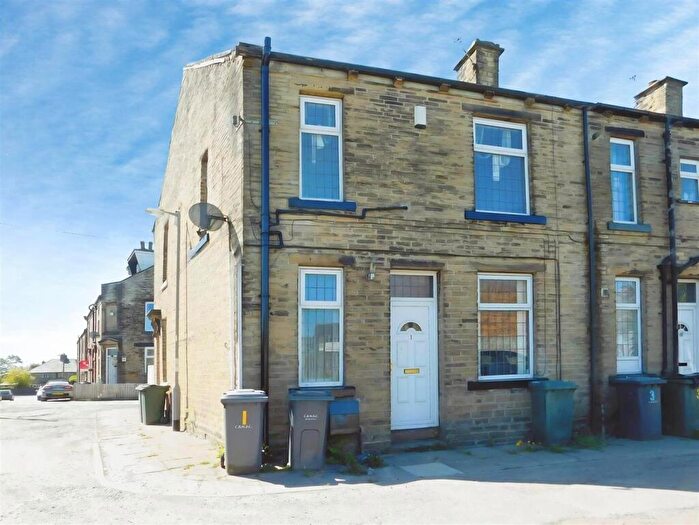
Properties for sale in Bradford
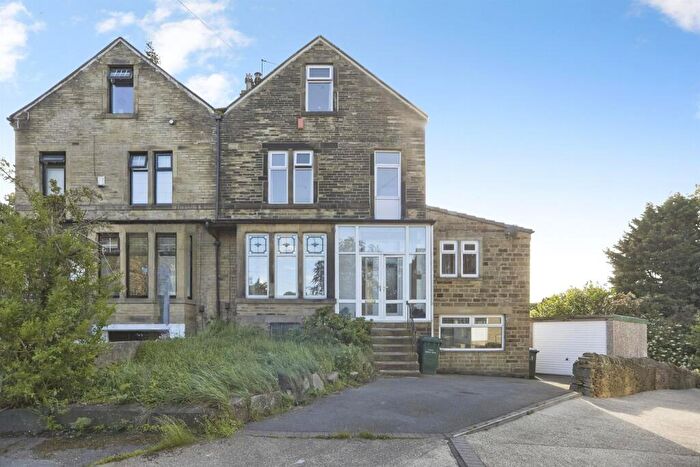

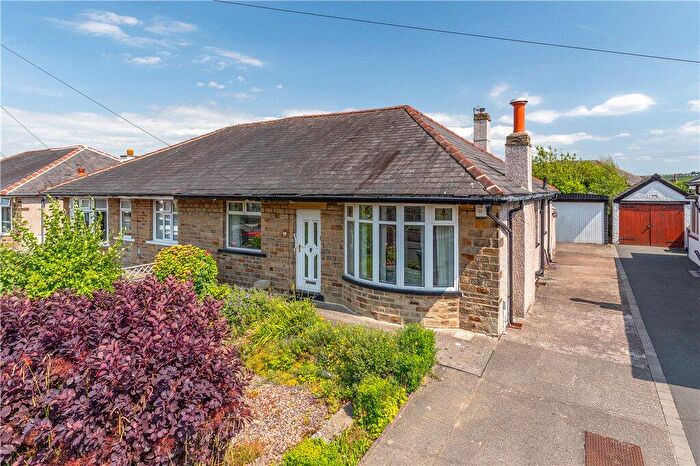
![]()
If you are looking to sell your house, let it out, or receive a property valuation, an expert can help you.
Click the button below to get started.


Towns in Bradford
Navigate through our locations to find the location of your next house in Bradford, England for sale or to rent.
Property price trends in Bradford
According to the latest Land Registry data, the average home in Bradford sold for £210,049 in 2026. That figure comes from a substantial record of 262,101 sales logged over the past 31 years.
Prices have continued to climb over the last three years. Compared with 2023, when the typical sale came in around £196,110, that's a rise of roughly 7.1%.
Looking back five years, average prices are up about 12.5% since 2021, a gain of around £23,356 in cash terms.
Zoom out to the past decade for the fuller picture. Back in 2016, homes here averaged £154,459, so the typical sold price has climbed about 36% since then, roughly 3.1% a year. Stretch the view to fifteen years and that annual pace eases back to about 2.7%.
Frequently asked questions about Bradford
What is the average price for a property for sale in Bradford?
The average price for a property for sale in Bradford is £202,272. This amount is 44% lower than the average price in England. There are more than 10,000 property listings for sale in Bradford.
What locations have the most expensive properties for sale in Bradford?
The locations with the most expensive properties for sale in Bradford are Ilkley at an average of £471,217, Leeds at an average of £389,833 and Bingley at an average of £245,786.
What locations have the most affordable properties for sale in Bradford?
The locations with the most affordable properties for sale in Bradford are Bradford at an average of £158,466, Keighley at an average of £192,766 and Halifax at an average of £204,999.
Which train stations are available in or near Bradford?
Some of the train stations available in or near Bradford are Saltaire, Shipley and Frizinghall.
Property Price Paid in Bradford by Year
The average sold property price by year was:
| Year | Average Sold Price | Price Change |
Sold Properties
|
|---|---|---|---|
| 2026 | £210,049 | -1% |
1,312 Properties |
| 2025 | £211,275 | 7% |
6,966 Properties |
| 2024 | £197,347 | 1% |
6,885 Properties |
| 2023 | £196,110 | 3% |
6,332 Properties |
| 2022 | £189,374 | 1% |
7,790 Properties |
| 2021 | £186,693 | 7% |
9,184 Properties |
| 2020 | £173,327 | 4% |
6,827 Properties |
| 2019 | £166,145 | 2% |
8,161 Properties |
| 2018 | £163,338 | 2% |
8,149 Properties |
| 2017 | £160,177 | 4% |
8,240 Properties |
Property Price per Property Type in Bradford
Here you can find historic sold price data in order to help with your property search.
The average Property Paid Price for specific property types in the last three years are:
| Property Type | Average Sold Price | Sold Properties |
|---|---|---|
| Semi Detached House | £206,623.00 | 7,581 Semi Detached Houses |
| Terraced House | £149,228.00 | 8,967 Terraced Houses |
| Detached House | £401,767.00 | 2,917 Detached Houses |
| Flat | £133,666.00 | 2,030 Flats |
Transport in Bradford
Please see below transportation links in this area:
