
Houses for sale in Bingley, Bradford
House Prices in Bingley
Properties in Bingley have an average house price of £246k and had 1,233 Property Transactions within the last 3 years.¹
Bingley is an area in Bradford with 11,658 households², where the most expensive property was sold for £1.44M.
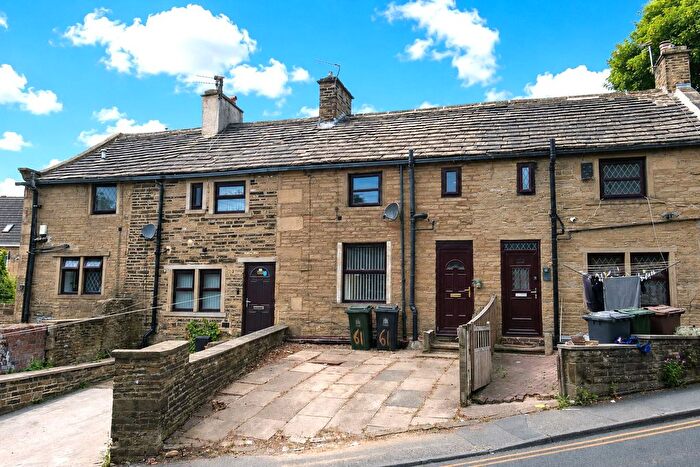
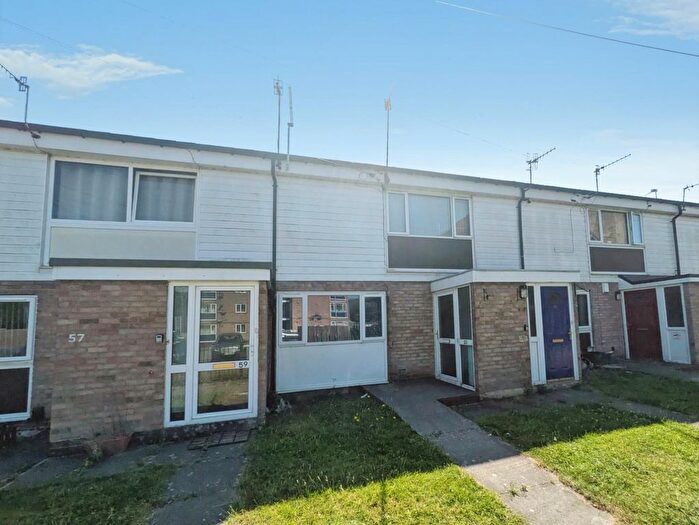
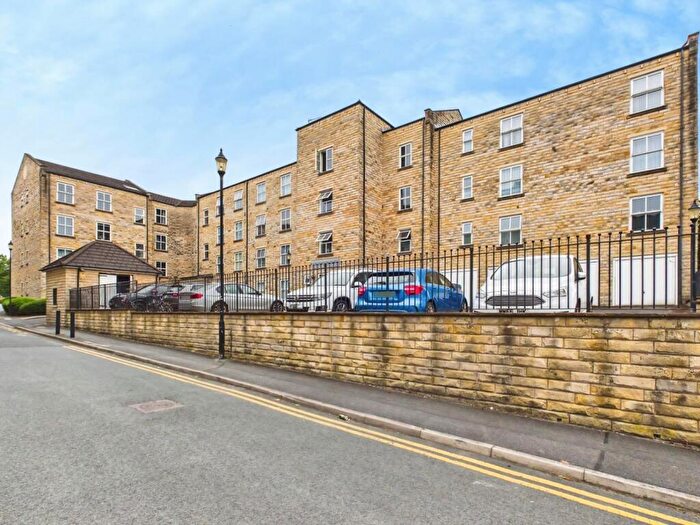
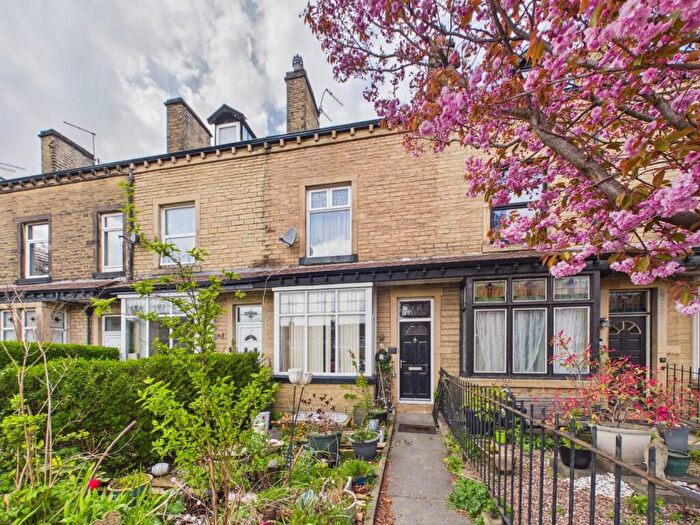
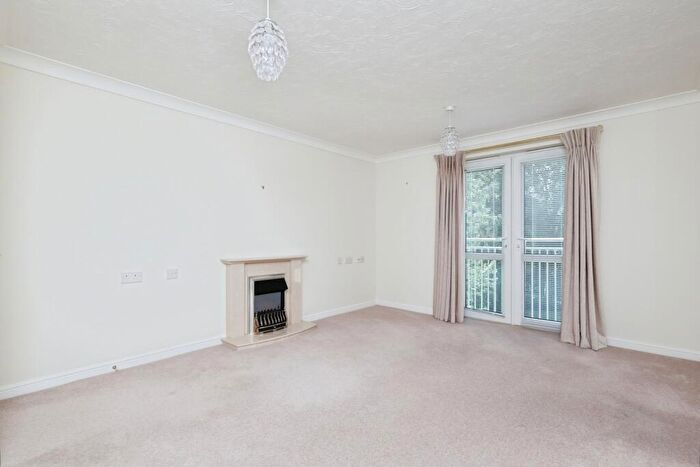
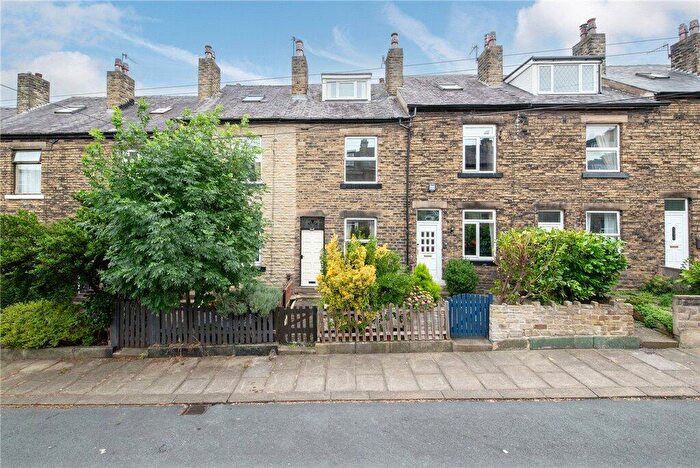
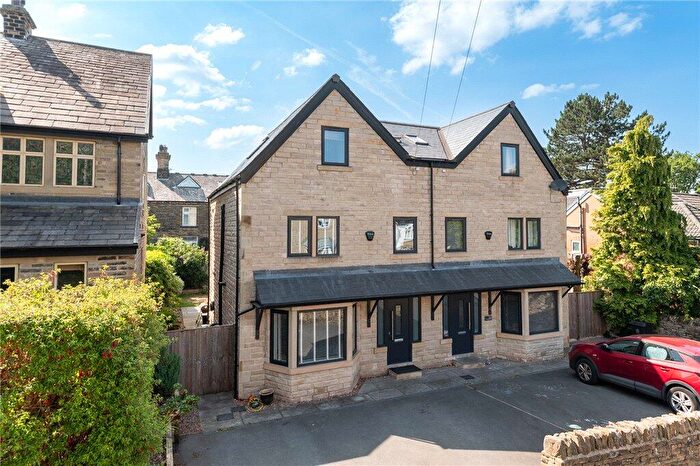
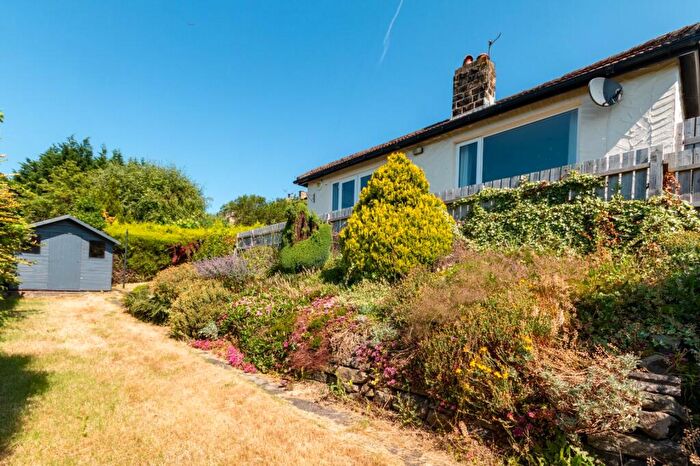
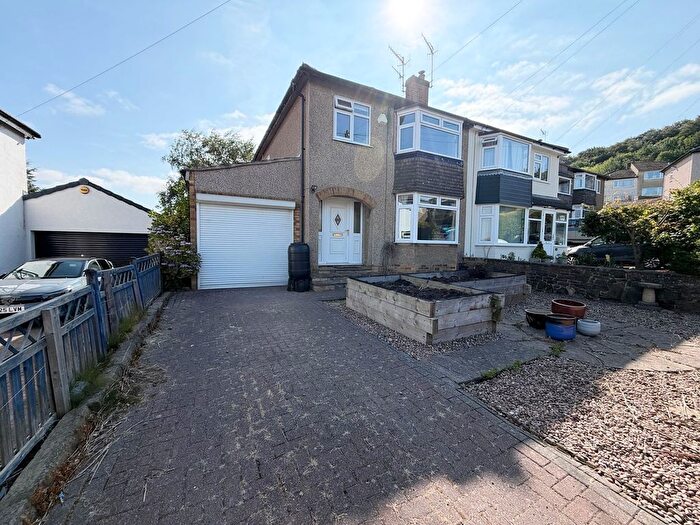
Properties for sale in Bingley
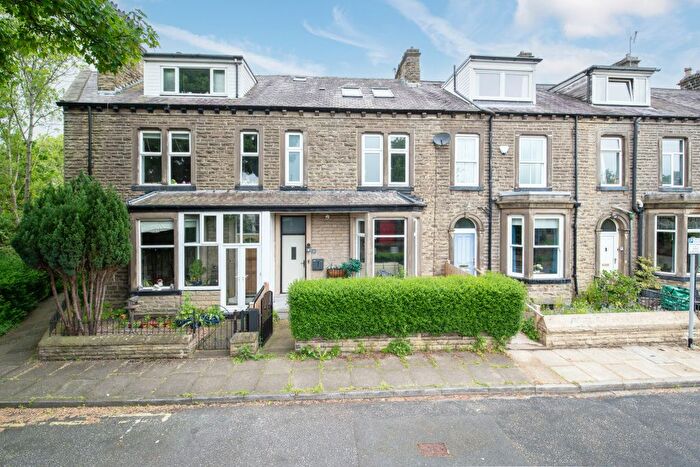

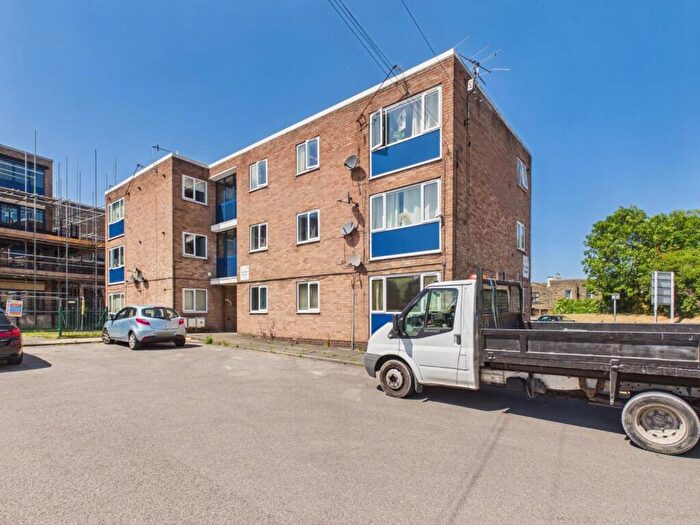
![]()
If you are looking to sell your house, let it out, or receive a property valuation, an expert can help you.
Click the button below to get started.


Neighbourhoods in Bingley
Navigate through our locations to find the location of your next house in Bingley, Bradford for sale or to rent.
Property price trends in Bingley
According to the latest Land Registry data, the average home in Bingley sold for £261,230 in 2026. That figure comes from a substantial record of 16,084 sales logged over the past 31 years.
Prices have moved up over the last three years. Compared with 2023, when the typical sale came in around £249,108, that's a rise of roughly 4.9%.
Looking back five years, average prices are up about 13.4% since 2021, a gain of around £30,894 in cash terms.
Zoom out to the past decade for the fuller picture. Back in 2016, homes here averaged £193,185, so the typical sold price has climbed about 35.2% since then, roughly 3.1% a year. Stretch the view to fifteen years and that annual pace eases back to about 2.7%.
Frequently asked questions about Bingley
What is the average price for a property for sale in Bingley?
The average price for a property for sale in Bingley is £245,786. This amount is 22% higher than the average price in Bradford. There are 5,826 property listings for sale in Bingley.
What locations have the most expensive properties for sale in Bingley?
The locations with the most expensive properties for sale in Bingley are Heaton at an average of £385,600 and Keighley East at an average of £354,625.
What locations have the most affordable properties for sale in Bingley?
The locations with the most affordable properties for sale in Bingley are Bingley Rural at an average of £242,988 and Bingley at an average of £245,536.
Which train stations are available in or near Bingley?
Some of the train stations available in or near Bingley are Bingley, Crossflatts and Saltaire.
Property Price Paid in Bingley by Year
The average sold property price by year was:
| Year | Average Sold Price | Price Change |
Sold Properties
|
|---|---|---|---|
| 2026 | £261,230 | 3% |
26 Properties |
| 2025 | £252,397 | 7% |
450 Properties |
| 2024 | £234,810 | -6% |
412 Properties |
| 2023 | £249,108 | 2% |
345 Properties |
| 2022 | £243,485 | 5% |
478 Properties |
| 2021 | £230,336 | 3% |
630 Properties |
| 2020 | £222,754 | 7% |
429 Properties |
| 2019 | £207,129 | 5% |
508 Properties |
| 2018 | £196,014 | -4% |
489 Properties |
| 2017 | £203,623 | 5% |
552 Properties |
Property Price per Property Type in Bingley
Here you can find historic sold price data in order to help with your property search.
The average Property Paid Price for specific property types in the last three years are:
| Property Type | Average Sold Price | Sold Properties |
|---|---|---|
| Semi Detached House | £251,719.00 | 384 Semi Detached Houses |
| Detached House | £438,252.00 | 227 Detached Houses |
| Terraced House | £193,441.00 | 423 Terraced Houses |
| Flat | £126,060.00 | 199 Flats |
Transport in Bingley
Please see below transportation links in this area:
