
Houses for sale in Bingley, Shipley
House Prices in Bingley
Properties in Bingley have an average house price of £575k and had 1 Property Transaction within the last 3 years¹.
Bingley is an area in Shipley, Bradford with 21 households², where the most expensive property was sold for £575k.
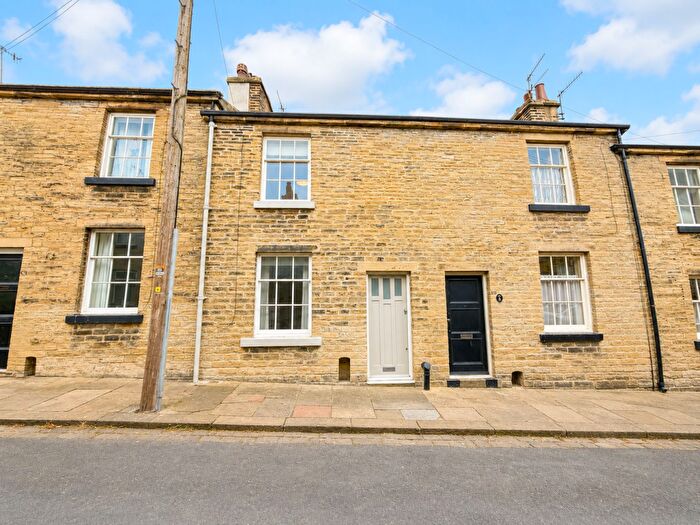
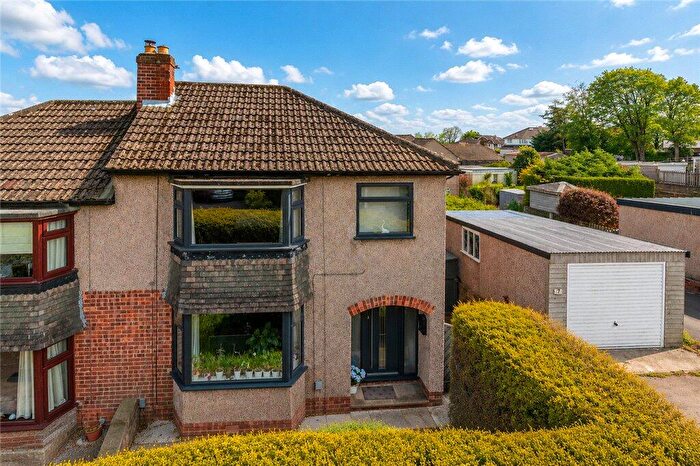
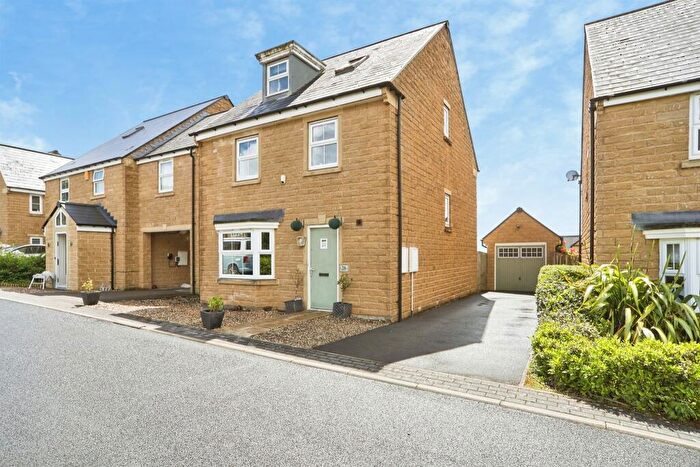
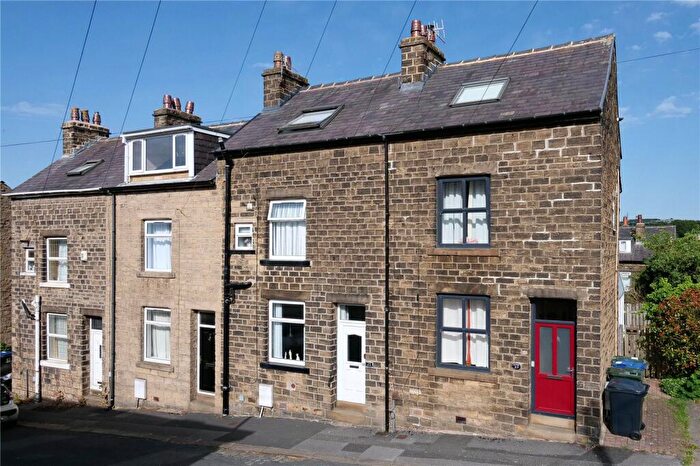
Properties for sale in Bingley
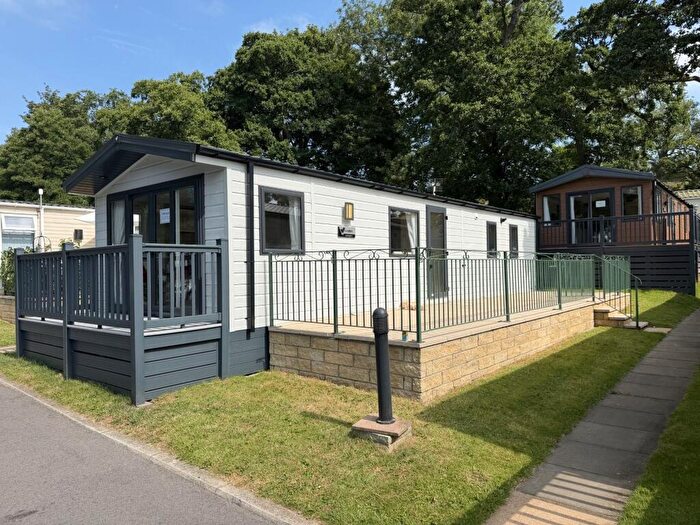
![]()
If you are looking to sell your house, let it out, or receive a property valuation, an expert can help you.
Click the button below to get started.
Roads and Postcodes in Bingley
Navigate through our locations to find the location of your next house in Bingley, Shipley for sale or to rent.
Property price trends in Bingley
According to the latest Land Registry data, the average home in Bingley sold for £575,000 in 2025. That figure comes from 23 sales logged over the past 30 years.
Prices have continued to climb over the last three years. Compared with 2021, when the typical sale came in around £475,000, that's a rise of roughly 21.1%.
Looking back five years, average prices are up about 63.7% since 2019, a gain of around £223,750 in cash terms.
Zoom out to the past decade for the fuller picture. Back in 2015, homes here averaged £100,000, so the typical sold price has climbed about 475% since then, roughly 19.1% a year.
Frequently asked questions about Bingley
What is the average price for a property for sale in Bingley?
The average price for a property for sale in Bingley is £575,000. This amount is 147% higher than the average price in Shipley. There are 1,308 property listings for sale in Bingley.
Which train stations are available in or near Bingley?
Some of the train stations available in or near Bingley are Baildon, Saltaire and Shipley.
Property Price Paid in Bingley by Year
The average sold property price by year was:
| Year | Average Sold Price | Price Change |
Sold Properties
|
|---|---|---|---|
| 2025 | £575,000 | 17% |
1 Property |
| 2021 | £475,000 | 26% |
2 Properties |
| 2019 | £351,250 | 52% |
2 Properties |
| 2016 | £167,000 | 40% |
1 Property |
| 2015 | £100,000 | -318% |
1 Property |
| 2014 | £417,500 | 7% |
2 Properties |
| 2013 | £390,000 | 8% |
1 Property |
| 2006 | £360,000 | 49% |
1 Property |
| 2004 | £182,000 | -20% |
1 Property |
| 2003 | £218,500 | 56% |
2 Properties |
Property Price per Property Type in Bingley
Here you can find historic sold price data in order to help with your property search.
The average Property Paid Price for specific property types in the last three years are:
| Property Type | Average Sold Price | Sold Properties |
|---|---|---|
| Terraced House | £575,000.00 | 1 Terraced House |
