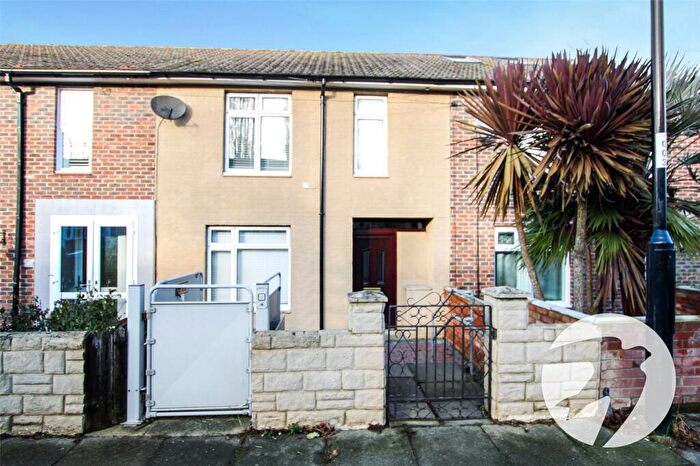
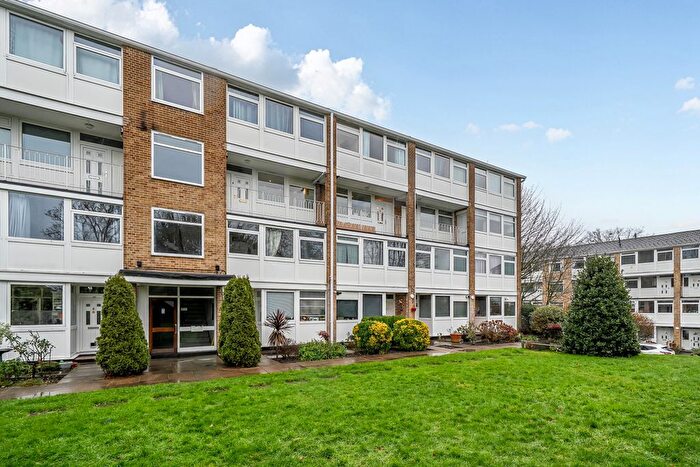
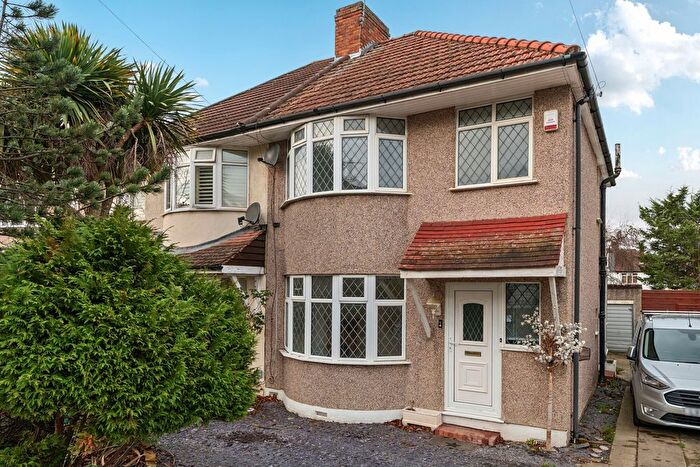
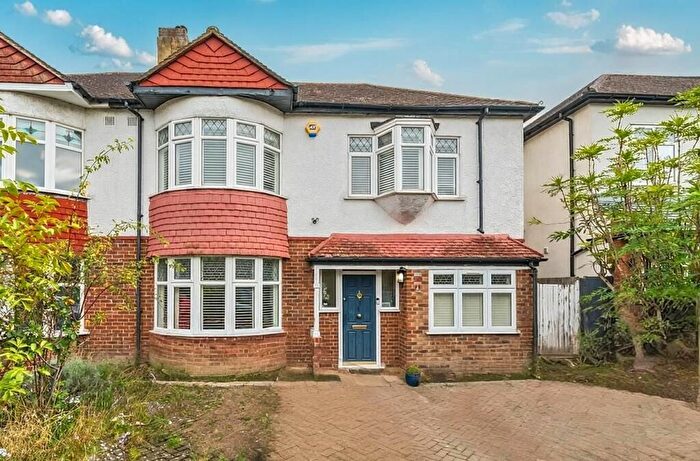
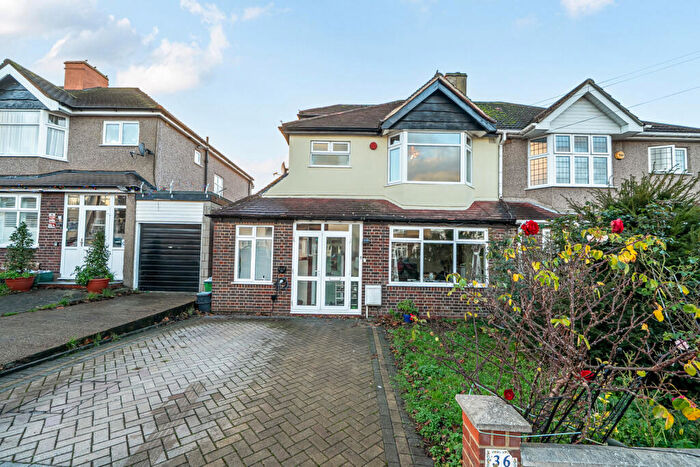
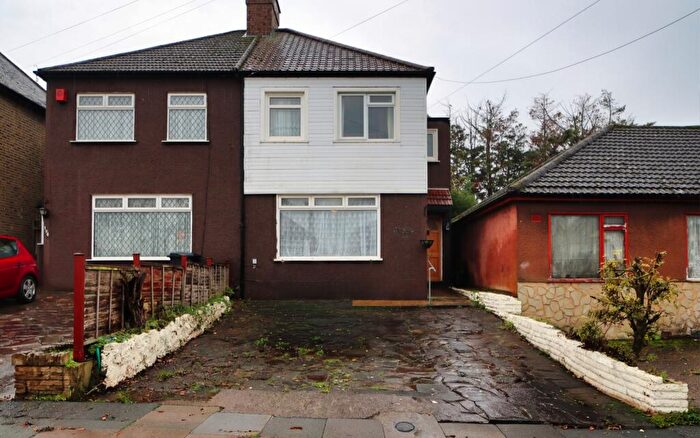
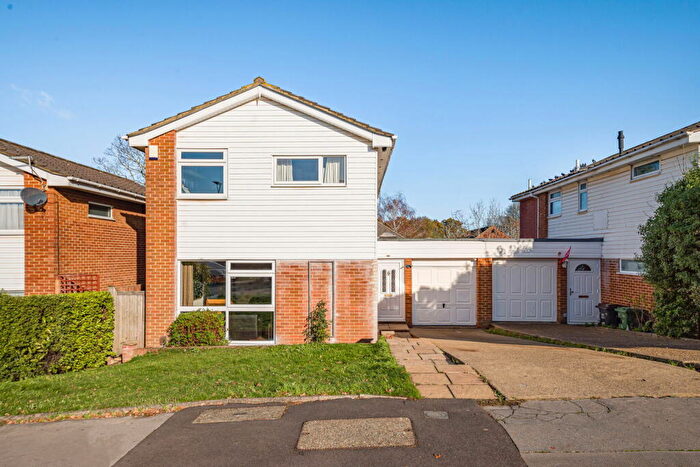
Houses for sale & to rent in Mottingham And Chislehurst North, London
House Prices in Mottingham And Chislehurst North
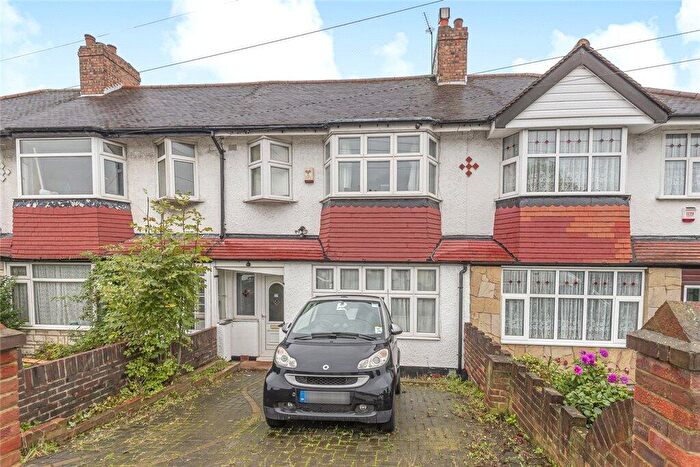
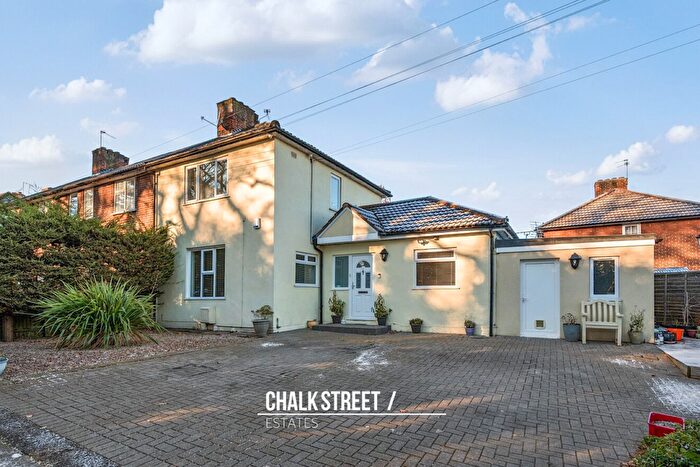
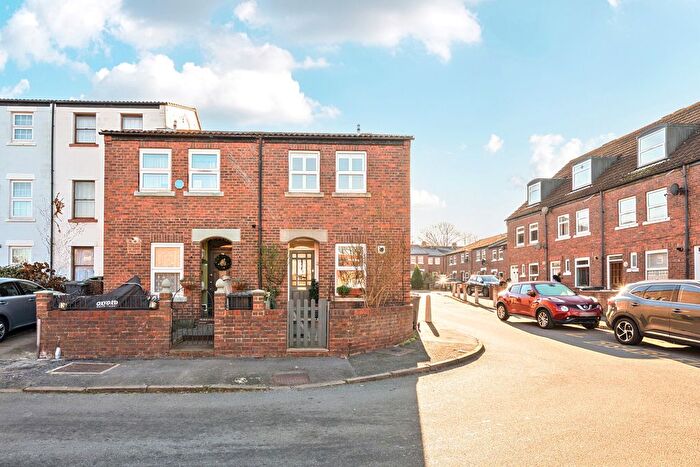
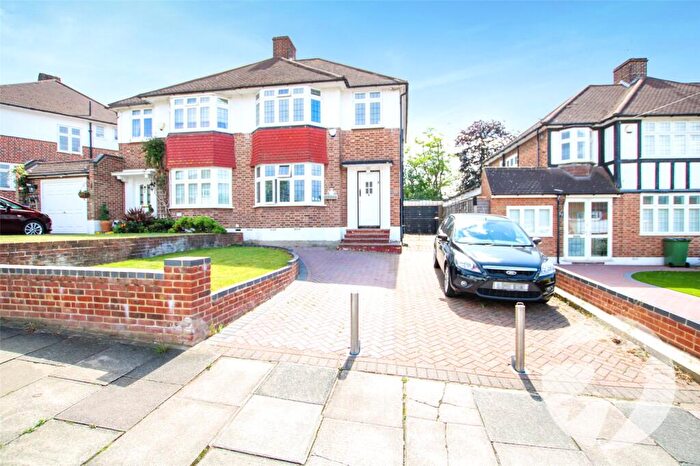
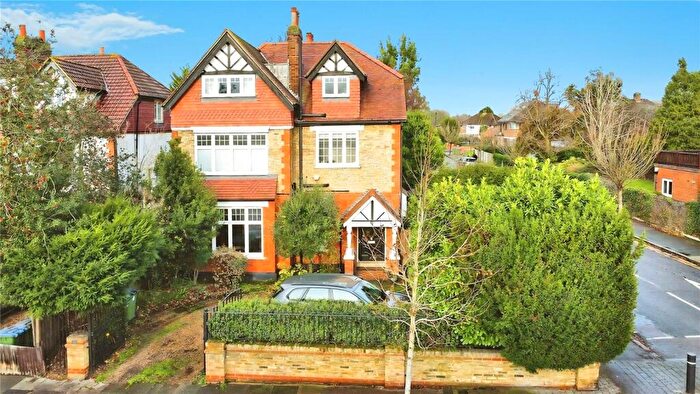
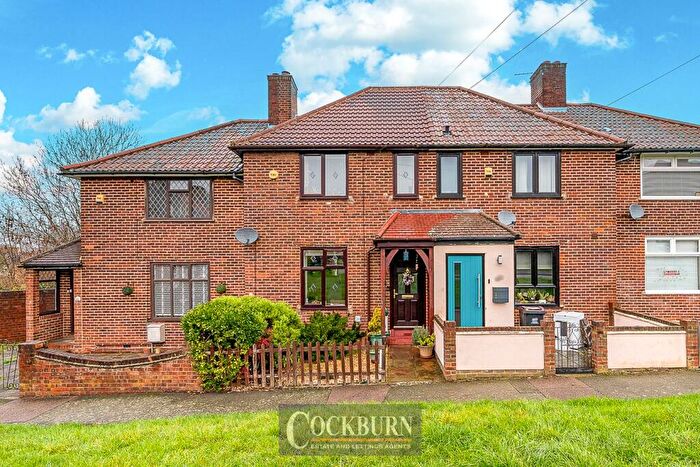
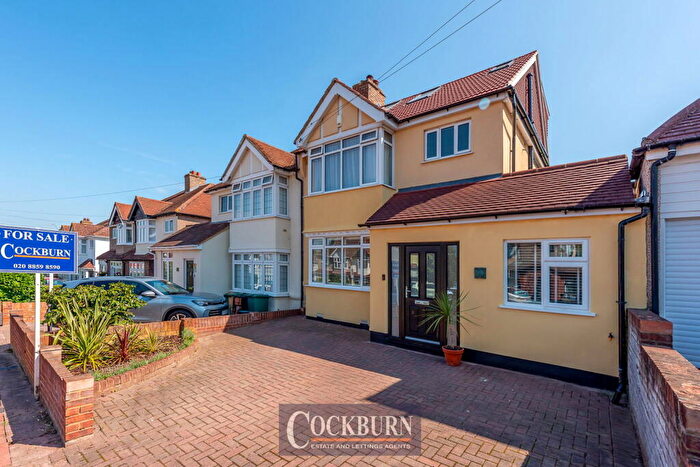
Properties in this part of Mottingham And Chislehurst North within London have an average house price of £417,546.00 and had 329 Property Transactions within the last 3 years¹. This area has 3,626 households² , where the most expensive property was sold for £1,395,000.00.
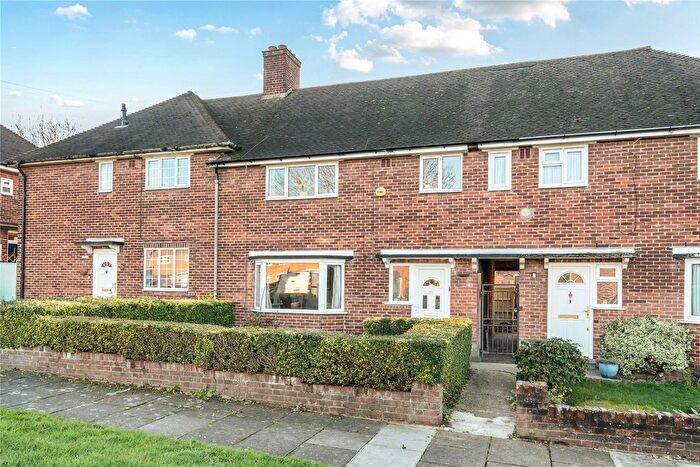
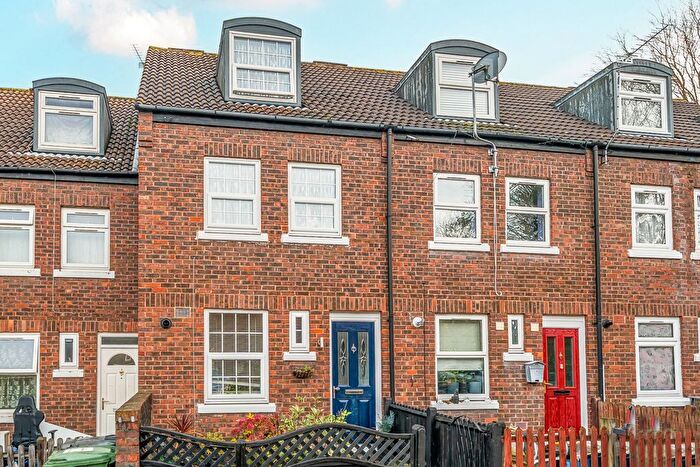
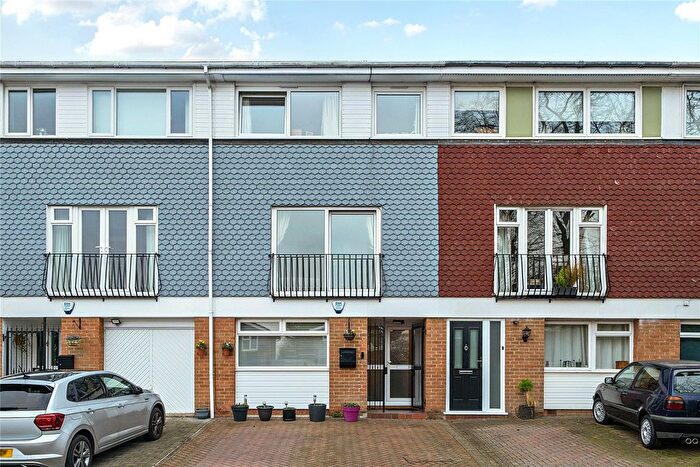
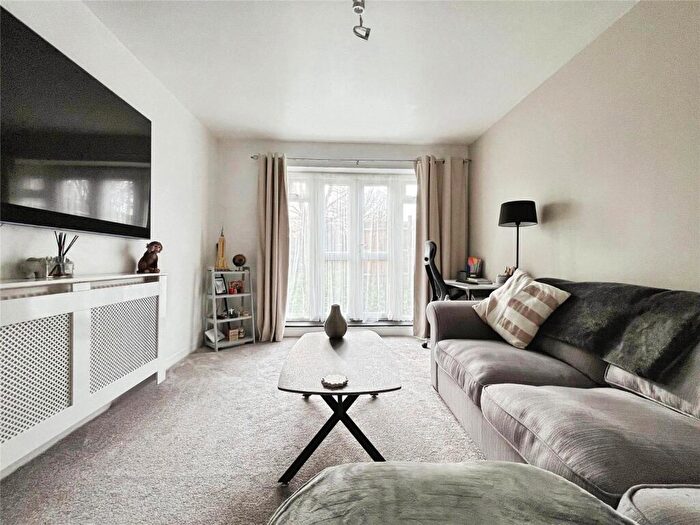
Properties for sale in Mottingham And Chislehurst North
Roads and Postcodes in Mottingham And Chislehurst North
Navigate through our locations to find the location of your next house in Mottingham And Chislehurst North, London for sale or to rent.
| Streets | Postcodes |
|---|---|
| Albert Road | SE9 4SW |
| Avondale Road | SE9 4SN |
| Ballantyne Close | SE9 4EH |
| Beaconsfield Parade | SE9 4EA |
| Beaconsfield Road | SE9 4DJ SE9 4DP SE9 4DS SE9 4DT SE9 4DU SE9 4DX SE9 4DY SE9 4ED SE9 4EE SE9 4EF SE9 4EG SE9 4TS |
| Belvoir Close | SE9 4TD SE9 4TE |
| Bilsby Grove | SE9 4BS |
| Blanchard Close | SE9 4TZ |
| Calcott Walk | SE9 4BN |
| Carters Hill Close | SE9 4RS |
| Castlecombe Road | SE9 4AP SE9 4AR SE9 4AS SE9 4AT SE9 4AU |
| Castleton Road | SE9 4DB SE9 4DD SE9 4DE |
| Cattistock Road | SE9 4AN SE9 4AW |
| Cedar Mount | SE9 4RU |
| Charminster Road | SE9 4BL SE9 4BP SE9 4BW |
| Chilham Road | SE9 4BE SE9 4BG |
| Clarence Road | SE9 4SH SE9 4SJ |
| College View | SE9 4QG |
| Court Farm Road | SE9 4JH SE9 4JL SE9 4JN SE9 4JS SE9 4JW SE9 4JZ SE9 4LA SE9 4LB |
| Cranley Parade | SE9 4DZ |
| Devonshire Road | SE9 4QP |
| Dittisham Road | SE9 4BH SE9 4BJ |
| Dorset Road | SE9 4QS SE9 4QX SE9 4QY SE9 4QU |
| Duddington Close | SE9 4JD |
| Dunkery Road | SE9 4HP SE9 4HR SE9 4HS SE9 4HT SE9 4HU SE9 4HW SE9 4HY SE9 4LP SE9 4LR |
| Elmhurst Road | SE9 4DN SE9 4DW |
| Escott Gardens | SE9 4BQ |
| Framlingham Crescent | SE9 4AB SE9 4AE SE9 4AF SE9 4AG SE9 4AH SE9 4AJ |
| Gardeners Close | SE9 4DF SE9 4DG |
| Grove Park Road | SE9 4NP SE9 4NS SE9 4QA SE9 4QB SE9 4NT SE9 4QE SE9 4QF |
| Hall View | SE9 4RB |
| Harting Road | SE9 4JP SE9 4JR |
| Hassop Walk | SE9 4JT SE9 4JU |
| Haven Close | SE9 4SB |
| Highcombe Close | SE9 4QH SE9 4QJ SE9 4QL |
| Horley Road | SE9 4LE SE9 4LF |
| Horning Close | SE9 4EQ |
| Ickleton Road | SE9 4BD |
| Kersey Gardens | SE9 4JX SE9 4JY |
| Kimmeridge Road | SE9 4EB SE9 4LD |
| King & Queen Close | SE9 4AZ |
| Kippington Drive | SE9 4RG |
| Layzell Walk | SE9 4QD |
| Lianne Grove | SE9 4AD |
| Lulworth Road | SE9 4DL |
| Marvels Lane | SE12 9PN |
| Mells Crescent | SE9 4NF |
| Model Farm Close | SE9 4DR |
| Morston Gardens | SE9 4NE |
| Mottingham Gardens | SE9 4RL |
| Mottingham Lane | SE9 4RP SE9 4RT SE9 4RW SE9 4RX |
| Mottingham Road | SE9 4QQ SE9 4QR SE9 4QW SE9 4QZ SE9 4SL SE9 4SR SE9 4SU SE9 4SZ SE9 4TL SE9 4TN SE9 4QN SE9 4SP |
| Nunnington Close | SE9 4TA |
| Offenham Road | SE9 4LY |
| Portland Crescent | SE9 4TT |
| Portland Road | SE9 4TP SE9 4TR SE9 4TW |
| Prestbury Square | SE9 4LZ SE9 4NA SE9 4NB |
| Ravenscroft Crescent | SE9 4LL |
| Ravensworth Road | SE9 4LN SE9 4LT SE9 4LU SE9 4LW SE9 4LX |
| Scotts Terrace | SE9 4QT |
| Sennen Walk | SE9 4UA |
| Shottery Close | SE9 4TB |
| Silverdale Drive | SE9 4DH |
| Smarden Grove | SE9 4LS |
| St Keverne Road | SE9 4AA SE9 4AL SE9 4AQ |
| Steyning Grove | SE9 4NG SE9 4NQ |
| Teign Mews | SE9 4RA |
| Tenterden Close | SE9 4AX |
| The Crossway | SE9 4JJ |
| Thursley Road | SE9 4HL SE9 4HN |
| Wayside Grove | SE9 4ND |
| Widecombe Road | SE9 4HH SE9 4HJ SE9 4HQ |
Transport near Mottingham And Chislehurst North
-
Mottingham Station
-
Grove Park Station
-
Elmstead Woods Station
-
New Eltham Station
-
Sundridge Park Station
-
Eltham Station
-
Chislehurst Station
-
Lee Station
-
Bromley North Station
-
Bickley Station
- FAQ
- Price Paid By Year
- Property Type Price
Frequently asked questions about Mottingham And Chislehurst North
What is the average price for a property for sale in Mottingham And Chislehurst North?
The average price for a property for sale in Mottingham And Chislehurst North is £417,546. This amount is 6% lower than the average price in London. There are 1,535 property listings for sale in Mottingham And Chislehurst North.
What streets have the most expensive properties for sale in Mottingham And Chislehurst North?
The streets with the most expensive properties for sale in Mottingham And Chislehurst North are The Crossway at an average of £905,000, Layzell Walk at an average of £842,500 and Mottingham Lane at an average of £707,200.
What streets have the most affordable properties for sale in Mottingham And Chislehurst North?
The streets with the most affordable properties for sale in Mottingham And Chislehurst North are Horning Close at an average of £205,000, Model Farm Close at an average of £250,775 and Escott Gardens at an average of £253,500.
Which train stations are available in or near Mottingham And Chislehurst North?
Some of the train stations available in or near Mottingham And Chislehurst North are Mottingham, Grove Park and Elmstead Woods.
Property Price Paid in Mottingham And Chislehurst North by Year
The average sold property price by year was:
| Year | Average Sold Price | Price Change |
Sold Properties
|
|---|---|---|---|
| 2025 | £446,250 | 4% |
58 Properties |
| 2024 | £426,287 | 3% |
100 Properties |
| 2023 | £413,464 | 4% |
65 Properties |
| 2022 | £396,097 | 3% |
106 Properties |
| 2021 | £385,271 | -3% |
130 Properties |
| 2020 | £395,742 | -7% |
90 Properties |
| 2019 | £424,592 | 12% |
97 Properties |
| 2018 | £375,763 | 4% |
99 Properties |
| 2017 | £362,553 | 7% |
122 Properties |
| 2016 | £337,111 | 10% |
133 Properties |
| 2015 | £302,376 | 9% |
161 Properties |
| 2014 | £275,773 | 4% |
144 Properties |
| 2013 | £264,301 | 8% |
116 Properties |
| 2012 | £243,487 | 12% |
98 Properties |
| 2011 | £215,447 | -12% |
88 Properties |
| 2010 | £241,740 | 15% |
90 Properties |
| 2009 | £205,103 | -1% |
65 Properties |
| 2008 | £206,171 | -4% |
93 Properties |
| 2007 | £213,549 | 6% |
197 Properties |
| 2006 | £201,668 | 9% |
199 Properties |
| 2005 | £184,261 | 3% |
163 Properties |
| 2004 | £178,960 | 12% |
167 Properties |
| 2003 | £157,077 | 11% |
143 Properties |
| 2002 | £139,525 | 17% |
185 Properties |
| 2001 | £116,486 | 11% |
156 Properties |
| 2000 | £104,092 | 22% |
144 Properties |
| 1999 | £81,054 | 2% |
143 Properties |
| 1998 | £79,645 | 11% |
107 Properties |
| 1997 | £70,611 | 16% |
138 Properties |
| 1996 | £59,666 | -17% |
150 Properties |
| 1995 | £69,702 | - |
103 Properties |
Property Price per Property Type in Mottingham And Chislehurst North
Here you can find historic sold price data in order to help with your property search.
The average Property Paid Price for specific property types in the last three years are:
| Property Type | Average Sold Price | Sold Properties |
|---|---|---|
| Semi Detached House | £548,771.00 | 47 Semi Detached Houses |
| Detached House | £929,266.00 | 15 Detached Houses |
| Terraced House | £398,976.00 | 194 Terraced Houses |
| Flat | £277,261.00 | 73 Flats |

