
Houses for sale & to rent in SE19 2HN, Tudor Place, Crystal Palace, London
House Prices in SE19 2HN, Tudor Place, Crystal Palace
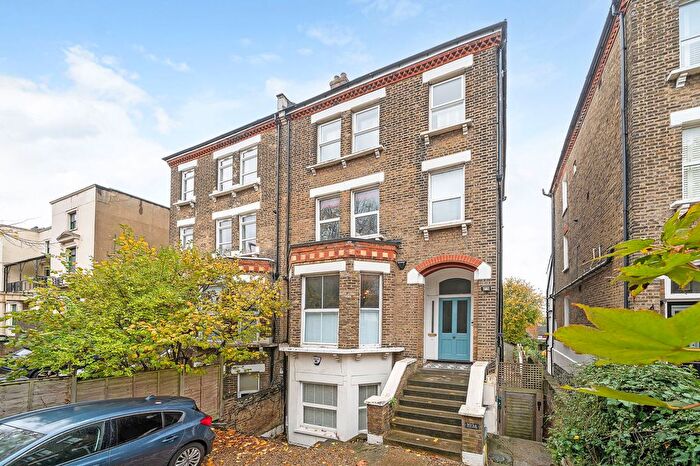
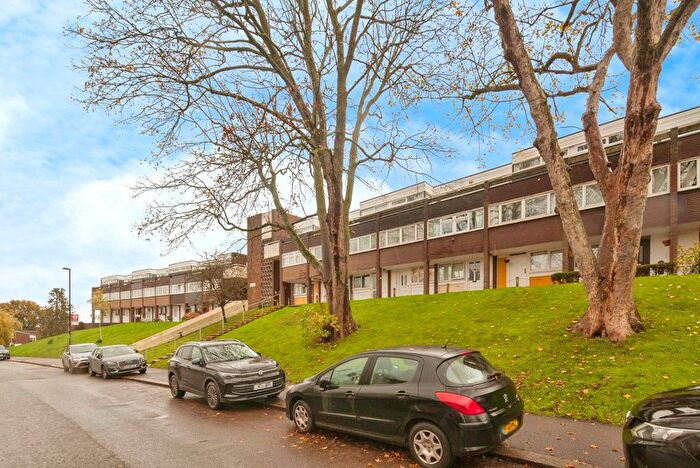
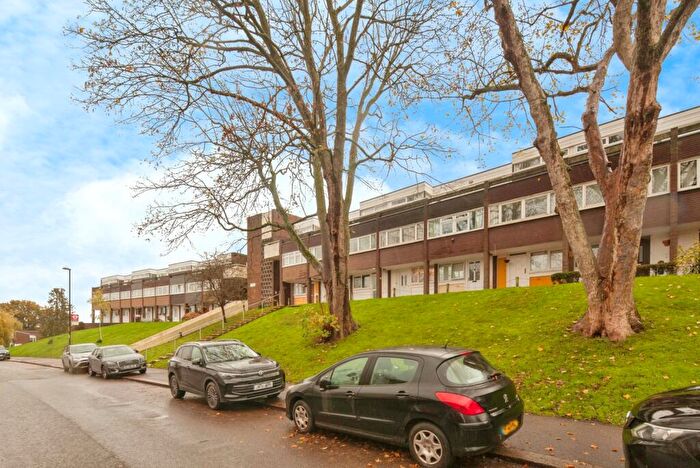
Properties in SE19 2HN have no sales history available within the last 3 years. SE19 2HN is a postcode in Tudor Place located in Crystal Palace, an area in London, Bromley London Borough, with 4 households².
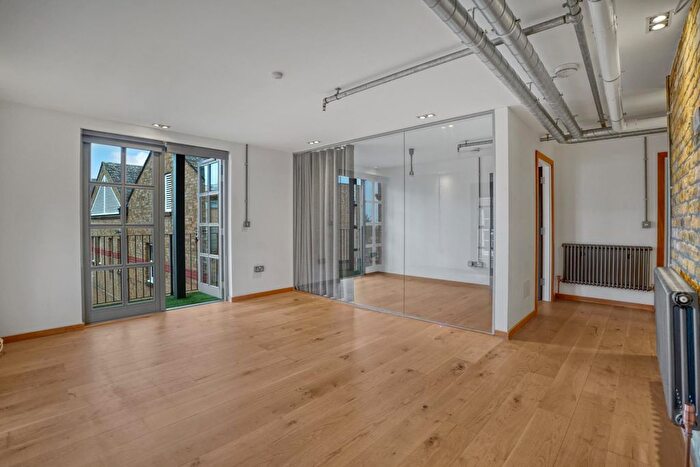
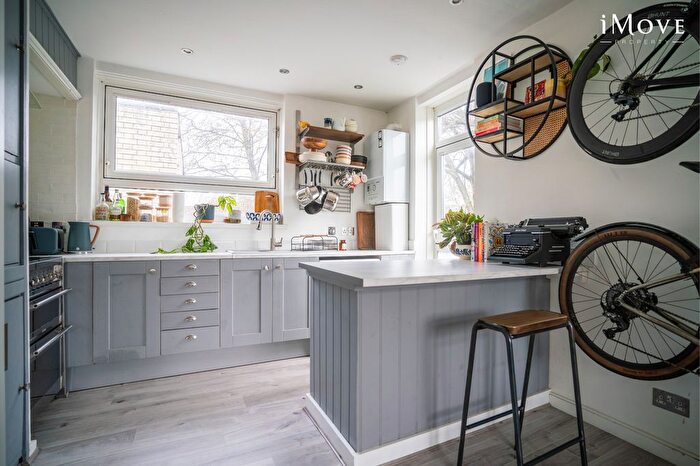
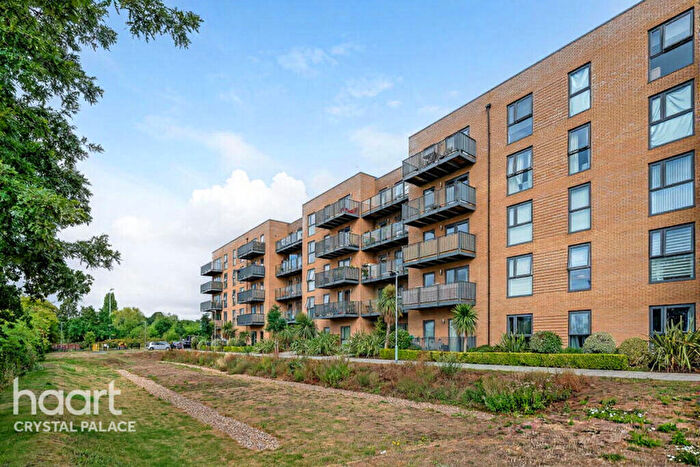
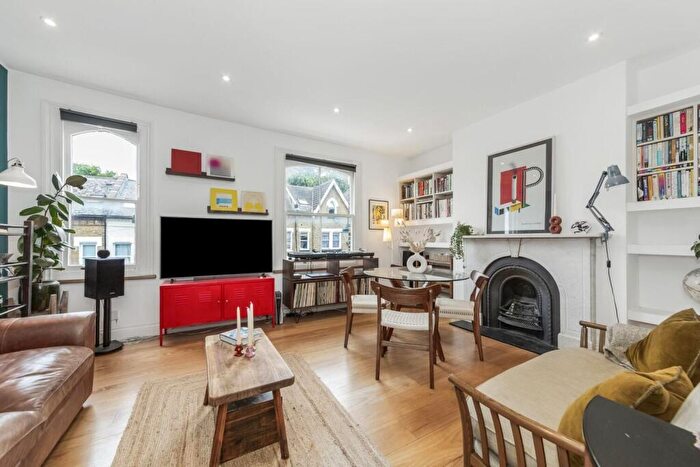
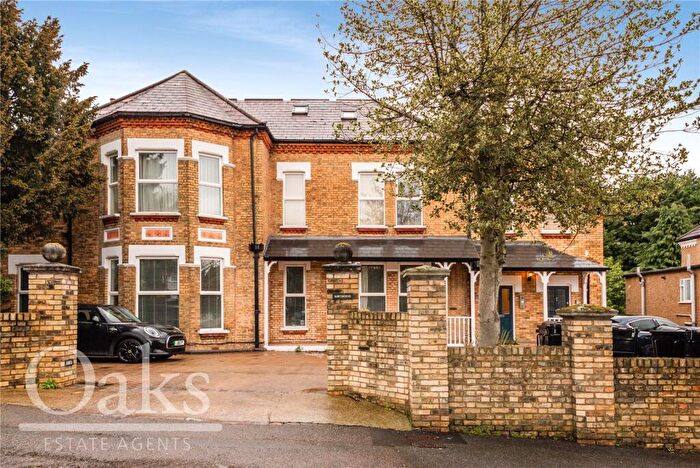
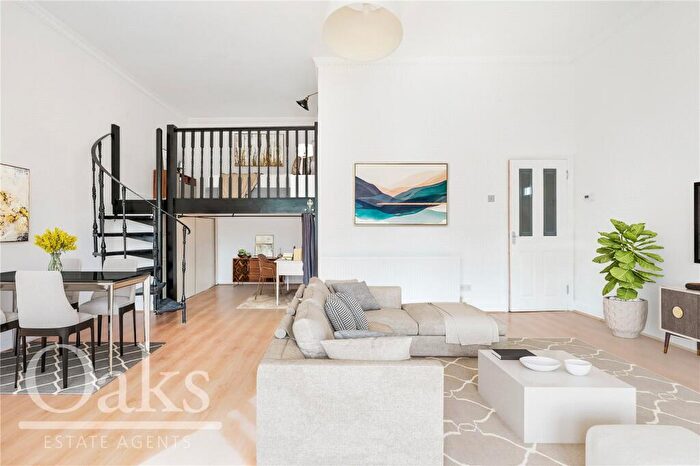
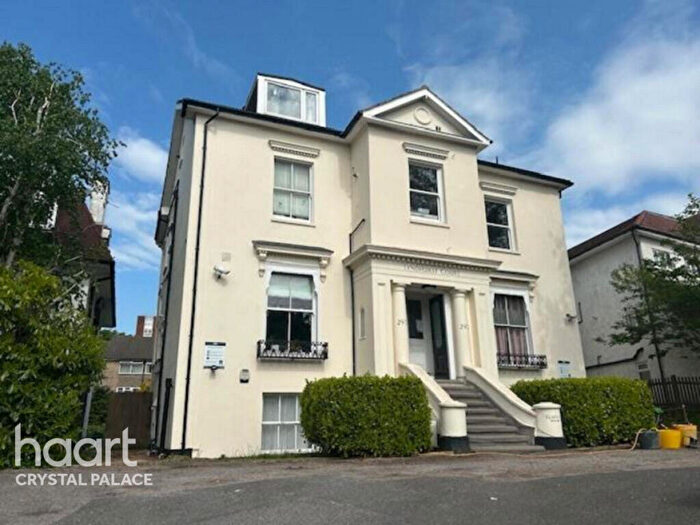
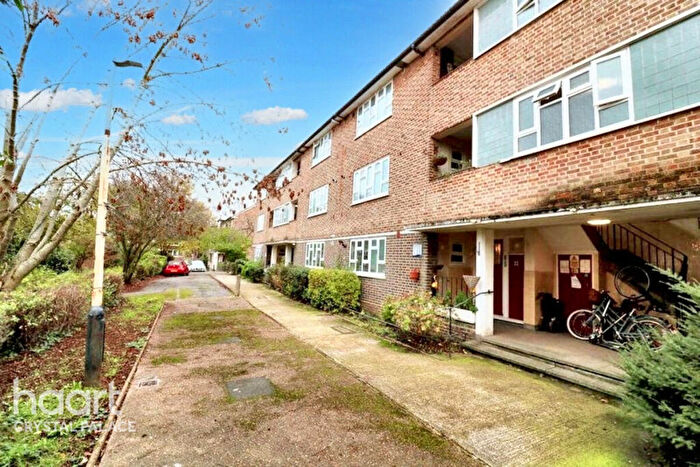
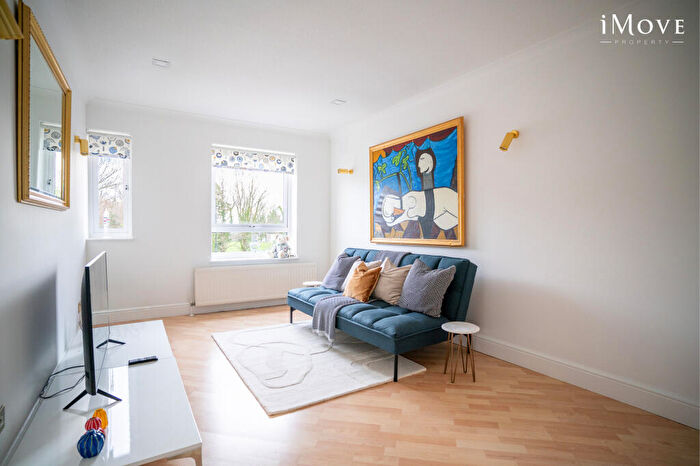
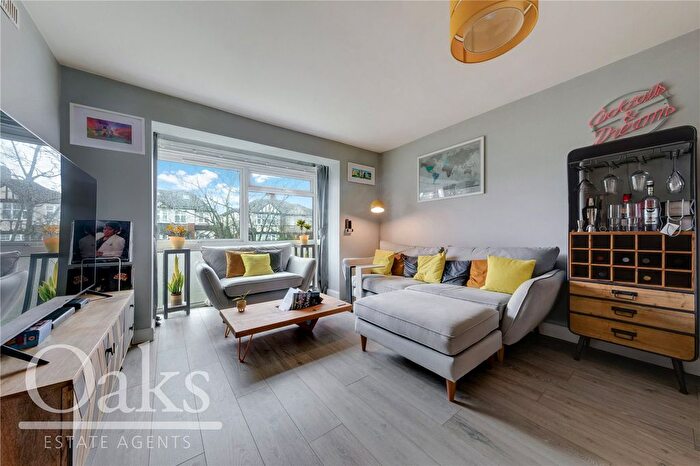
Properties for sale near SE19 2HN, Tudor Place

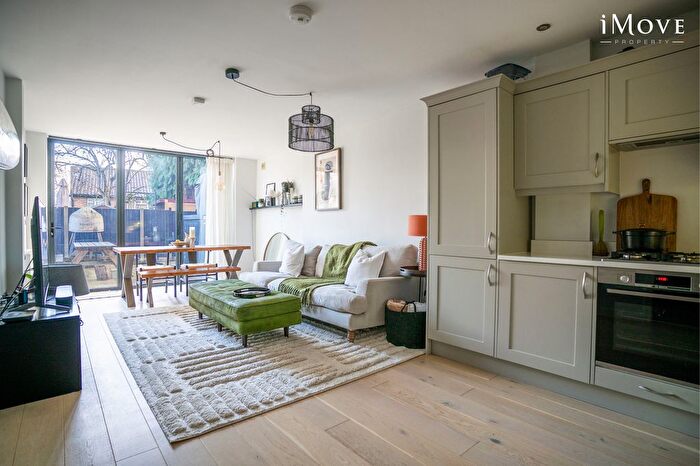
![]()
If you are looking to sell your house, let it out, or receive a property valuation, an expert can help you.
Click the button below to get started.


Price Paid in Tudor Place, SE19 2HN, Crystal Palace
2 Tudor Place, SE19 2HN, Crystal Palace London
Property 2 has been sold 3 times. The last time it was sold was in 30/07/2021 and the sold price was £800,000.00.
This flat, sold as a freehold on 30/07/2021, is a 99 sqm semi-detached house with an EPC rating of D.
| Date | Price | Property Type | Tenure | Classification |
|---|---|---|---|---|
| 30/07/2021 | £800,000.00 | Flat | freehold | Established Building |
| 09/03/2018 | £770,000.00 | Flat | freehold | Established Building |
| 18/08/2005 | £245,000.00 | Flat | freehold | Established Building |
1 Tudor Place, SE19 2HN, Crystal Palace London
Property 1 has been sold 1 time. The last time it was sold was in 24/11/1999 and the sold price was £190,000.00.
This is a Flat which was sold as a freehold in 24/11/1999
| Date | Price | Property Type | Tenure | Classification |
|---|---|---|---|---|
| 24/11/1999 | £190,000.00 | Flat | freehold | Established Building |
3 Tudor Place Belvedere Road, SE19 2HN, Crystal Palace London
This is a 122 square meter Semi-detached House with an EPC rating of D. Currently, there is no transaction history available for this property.
Transport near SE19 2HN, Tudor Place
-

 Crystal Palace Station
 -
Gipsy Hill Station
-
Anerley Station
-
Penge West Station
-
Penge East Station
-
Sydenham Hill Station
-
Sydenham Station
-
 Birkbeck Station
 -
Norwood Junction Station
-
Harrington Road Station
House price paid reports for SE19 2HN, Tudor Place
Click on the buttons below to see price paid reports by year or property price:
- Price Paid By Year
Property Price Paid in SE19 2HN, Tudor Place by Year
The average sold property price by year was:
| Year | Average Sold Price | Price Change |
Sold Properties
|
|---|---|---|---|
| 2021 | £800,000 | 4% |
1 Property |
| 2018 | £770,000 | 68% |
1 Property |
| 2005 | £245,000 | 22% |
1 Property |
| 1999 | £190,000 | - |
1 Property |