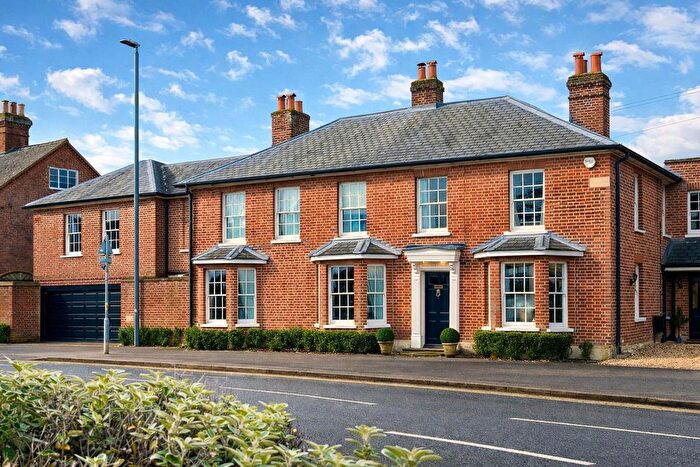
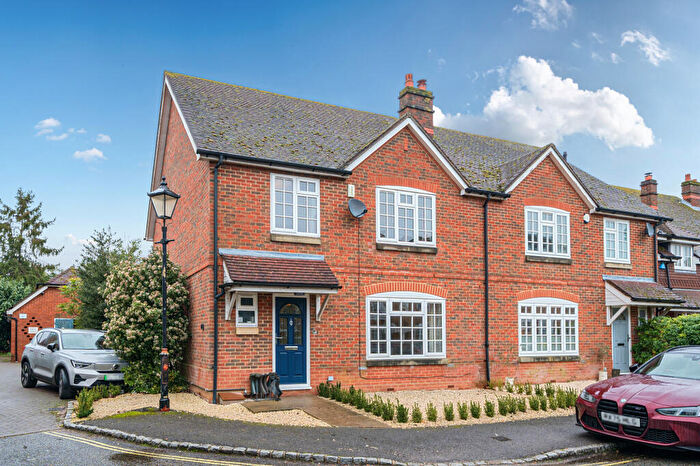
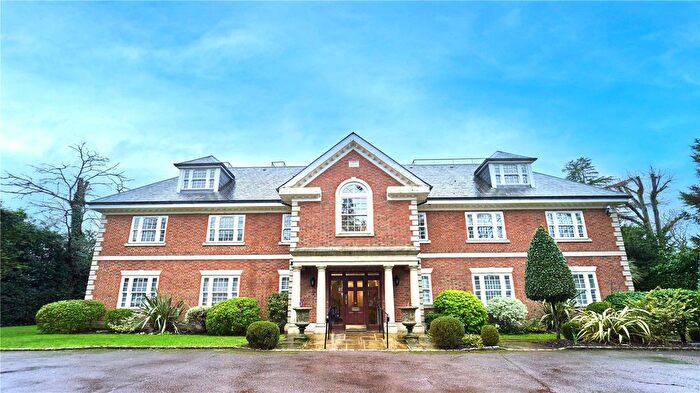
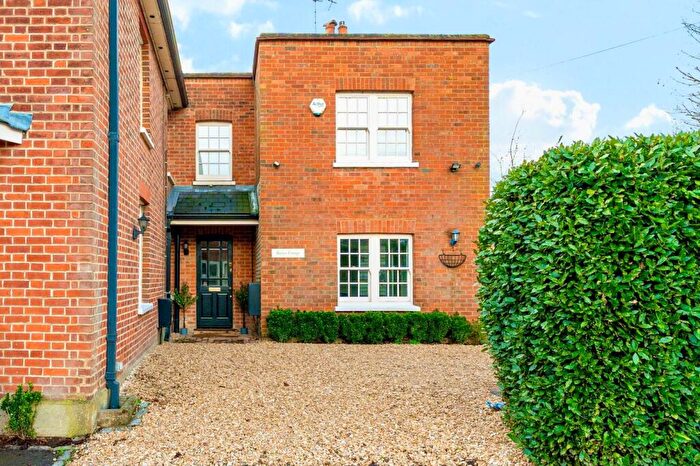
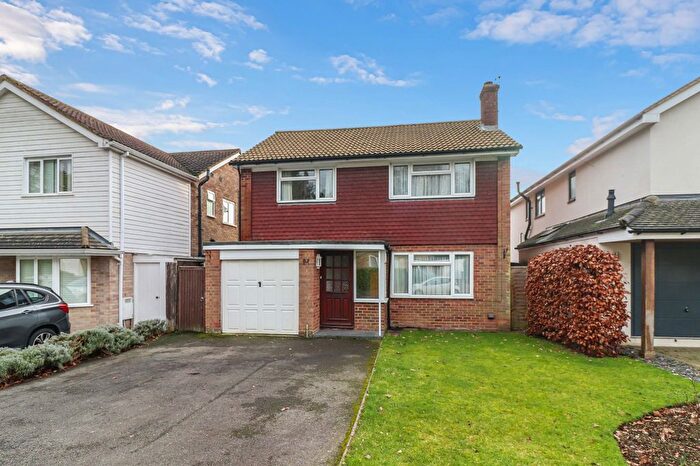
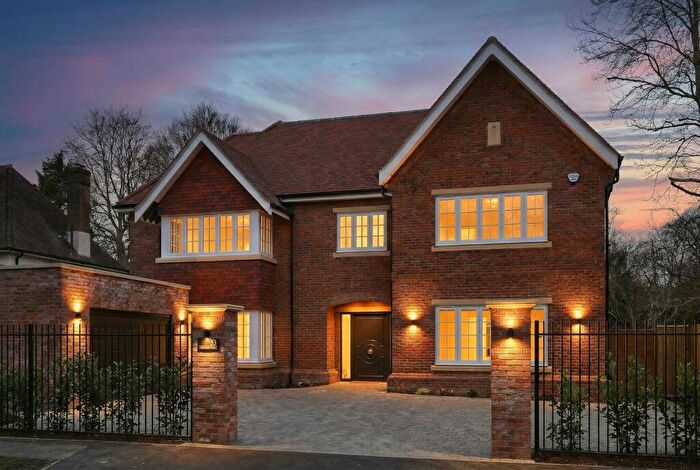
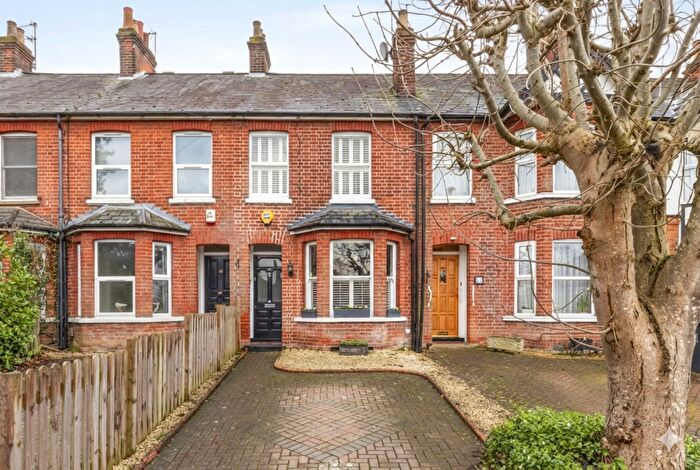
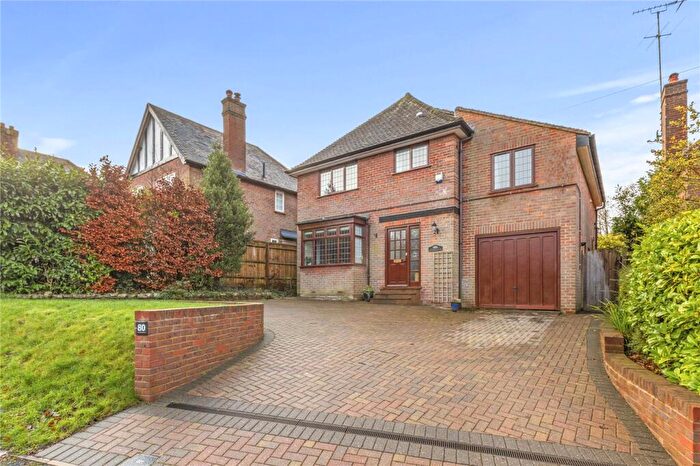
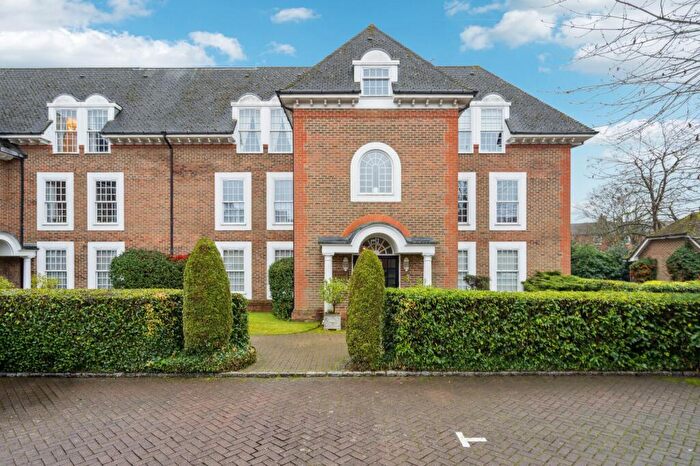
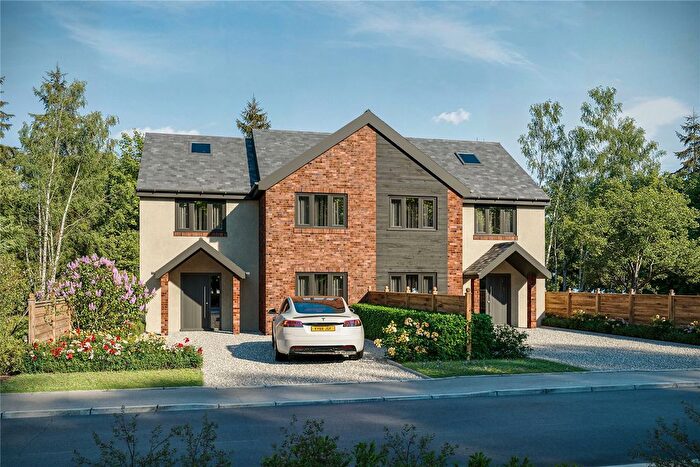
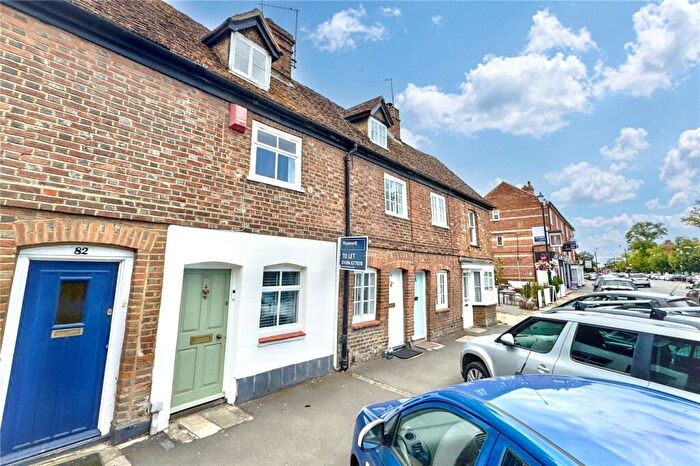
Houses for sale & to rent in Beaconsfield South, Beaconsfield
House Prices in Beaconsfield South
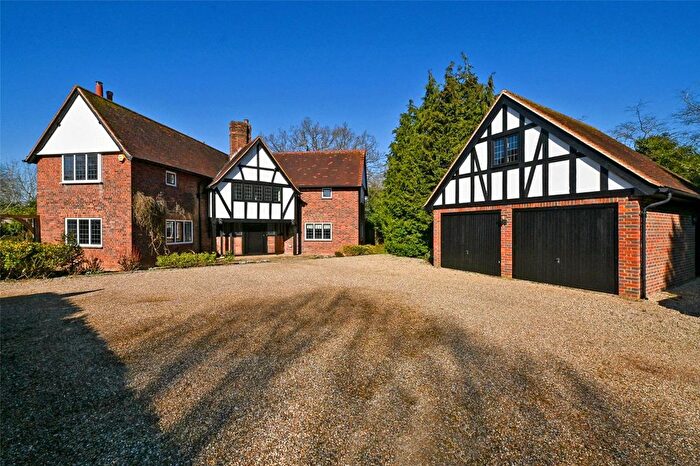
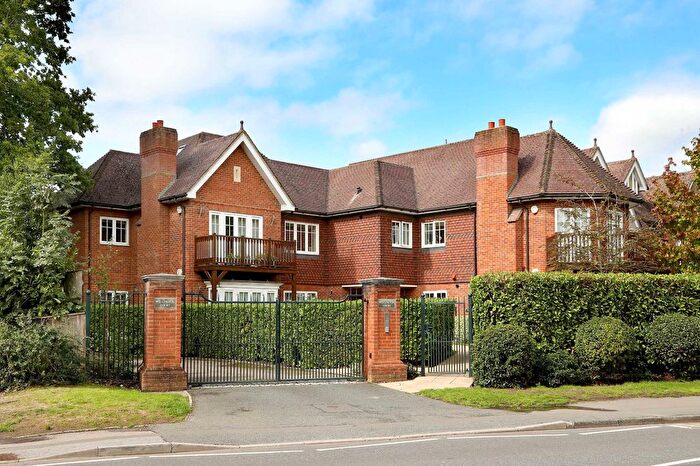
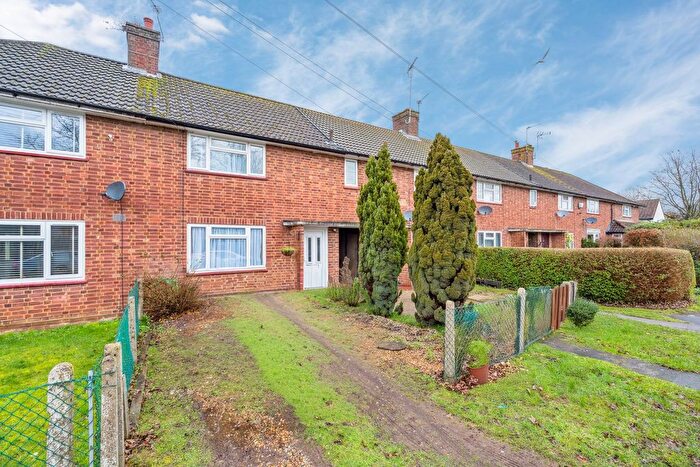
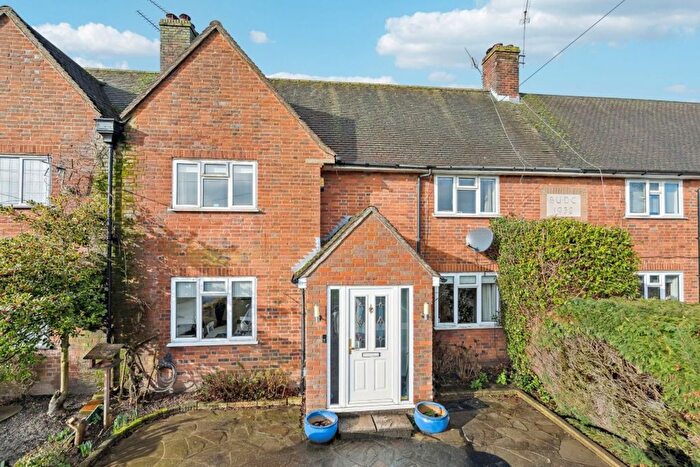
Properties in Beaconsfield South have an average house price of £871,883.00 and had 140 Property Transactions within the last 3 years¹.
Beaconsfield South is an area in Beaconsfield, Buckinghamshire with 1,376 households², where the most expensive property was sold for £4,042,211.00.
Properties for sale in Beaconsfield South
Roads and Postcodes in Beaconsfield South
Navigate through our locations to find the location of your next house in Beaconsfield South, Beaconsfield for sale or to rent.
| Streets | Postcodes |
|---|---|
| Amersham Road | HP9 2EL HP9 2HA |
| Aylesbury End | HP9 1LS HP9 1LT HP9 1LU HP9 1LW |
| Blue Dragon Yard | HP9 1GW |
| Burnham Avenue | HP9 2JA |
| Butlers Court Road | HP9 1SF HP9 1SG HP9 1SQ |
| Candlemas Lane | HP9 1AE HP9 1AF HP9 1AH |
| Candlemas Mead | HP9 1AP HP9 1AR |
| Crosby Close | HP9 2JU |
| Crossways | HP9 2HX |
| Factory Yard | HP9 1NA |
| Fernhurst Close | HP9 1AN |
| Grosvenor Villas | HP9 1LY |
| Hedgerley Lane | HP9 2JP HP9 2JS HP9 2JT |
| Horseshoe Crescent | HP9 1LJ HP9 1LL |
| Lakes Lane | HP9 2JZ HP9 2LA HP9 2LB |
| London End | HP9 2HN HP9 2HW HP9 2JB HP9 2JD HP9 2JH |
| Lord Reith Place | HP9 2GE |
| Malthouse Square | HP9 2LD HP9 2LE |
| Market Place | HP9 2DS |
| Meadow Lane | HP9 1AL |
| Old Lodge Drive | HP9 1RX |
| Old Town Close | HP9 1LF |
| Orchard Green | HP9 2BF |
| Orchard Road | HP9 2DZ |
| Park Lane | HP9 2HR HP9 2HS HP9 2HT |
| Peacock Close | HP9 2FG |
| Pyebush Lane | HP9 2RX |
| Queen Elizabeth Crescent | HP9 1BX |
| Redwood Place | HP9 1RP |
| Rockingham Place | HP9 2ET |
| Rolfe Close | HP9 1RU |
| Ronald Road | HP9 1AJ |
| Shepherds Close | HP9 2EA |
| Shepherds Lane | HP9 2DT HP9 2DU |
| St Josephs Mews | HP9 1GA |
| St Marys Court | HP9 2LG |
| Station Road | HP9 1FW HP9 1LG HP9 1UT |
| The Broadway | HP9 1ND |
| The Ferns | HP9 2LF |
| The Mead | HP9 1AW |
| The Spinney | HP9 1RZ HP9 1SA HP9 1SB |
| Timmis Court | HP9 1BZ |
| Wattleton Road | HP9 1RS HP9 1RW HP9 1RY HP9 1SD |
| Wheeler Place | HP9 1GY |
| White Hart Meadow | HP9 1LN |
| Wilton Park | HP9 2WH |
| Windsor End | HP9 2JJ HP9 2JN HP9 2JW HP9 2JY |
| Wycombe End | HP9 1LX HP9 1LZ HP9 1NB HP9 1XA |
| Yew Tree Close | HP9 2DX HP9 2DY |
Transport near Beaconsfield South
- FAQ
- Price Paid By Year
- Property Type Price
Frequently asked questions about Beaconsfield South
What is the average price for a property for sale in Beaconsfield South?
The average price for a property for sale in Beaconsfield South is £871,883. This amount is 27% lower than the average price in Beaconsfield. There are 503 property listings for sale in Beaconsfield South.
What streets have the most expensive properties for sale in Beaconsfield South?
The streets with the most expensive properties for sale in Beaconsfield South are Redwood Place at an average of £1,662,500, Lord Reith Place at an average of £1,473,333 and Queen Elizabeth Crescent at an average of £1,415,000.
What streets have the most affordable properties for sale in Beaconsfield South?
The streets with the most affordable properties for sale in Beaconsfield South are Timmis Court at an average of £248,250, The Ferns at an average of £250,000 and Hedgerley Lane at an average of £301,666.
Which train stations are available in or near Beaconsfield South?
Some of the train stations available in or near Beaconsfield South are Beaconsfield, Seer Green and Bourne End.
Property Price Paid in Beaconsfield South by Year
The average sold property price by year was:
| Year | Average Sold Price | Price Change |
Sold Properties
|
|---|---|---|---|
| 2025 | £778,391 | -27% |
44 Properties |
| 2024 | £990,336 | 18% |
55 Properties |
| 2023 | £813,317 | -0,3% |
41 Properties |
| 2022 | £816,012 | 8% |
62 Properties |
| 2021 | £750,937 | -5% |
113 Properties |
| 2020 | £788,610 | 11% |
43 Properties |
| 2019 | £704,991 | -4% |
45 Properties |
| 2018 | £732,867 | -10% |
60 Properties |
| 2017 | £807,374 | 14% |
47 Properties |
| 2016 | £690,938 | -2% |
66 Properties |
| 2015 | £708,075 | -5% |
72 Properties |
| 2014 | £745,507 | 21% |
72 Properties |
| 2013 | £587,711 | -21% |
74 Properties |
| 2012 | £711,984 | 19% |
70 Properties |
| 2011 | £574,628 | 8% |
72 Properties |
| 2010 | £529,418 | 20% |
68 Properties |
| 2009 | £420,970 | -16% |
82 Properties |
| 2008 | £487,974 | 3% |
41 Properties |
| 2007 | £473,312 | 4% |
88 Properties |
| 2006 | £454,898 | -5% |
81 Properties |
| 2005 | £477,756 | 19% |
68 Properties |
| 2004 | £388,091 | 3% |
76 Properties |
| 2003 | £376,688 | 5% |
68 Properties |
| 2002 | £359,346 | 2% |
91 Properties |
| 2001 | £353,071 | 34% |
87 Properties |
| 2000 | £234,225 | 16% |
69 Properties |
| 1999 | £197,555 | -4% |
81 Properties |
| 1998 | £206,329 | 17% |
82 Properties |
| 1997 | £170,893 | 14% |
63 Properties |
| 1996 | £147,306 | 1% |
62 Properties |
| 1995 | £146,116 | - |
59 Properties |
Property Price per Property Type in Beaconsfield South
Here you can find historic sold price data in order to help with your property search.
The average Property Paid Price for specific property types in the last three years are:
| Property Type | Average Sold Price | Sold Properties |
|---|---|---|
| Semi Detached House | £706,418.00 | 37 Semi Detached Houses |
| Detached House | £1,240,052.00 | 48 Detached Houses |
| Terraced House | £730,290.00 | 42 Terraced Houses |
| Flat | £440,884.00 | 13 Flats |

