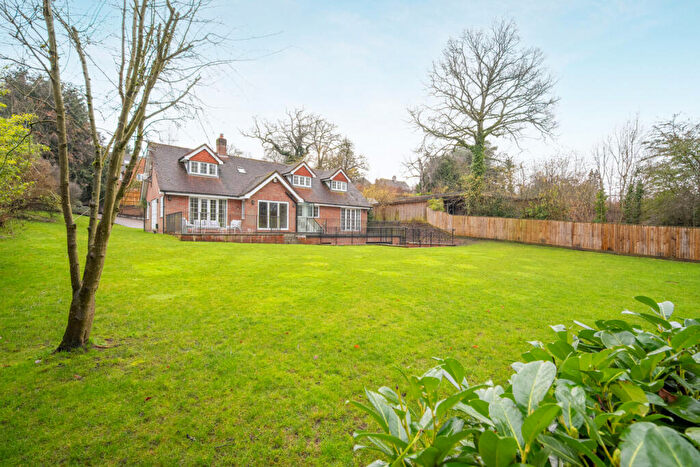
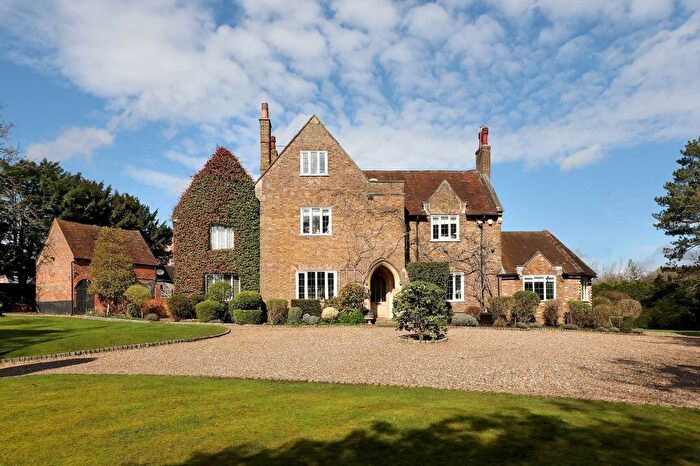
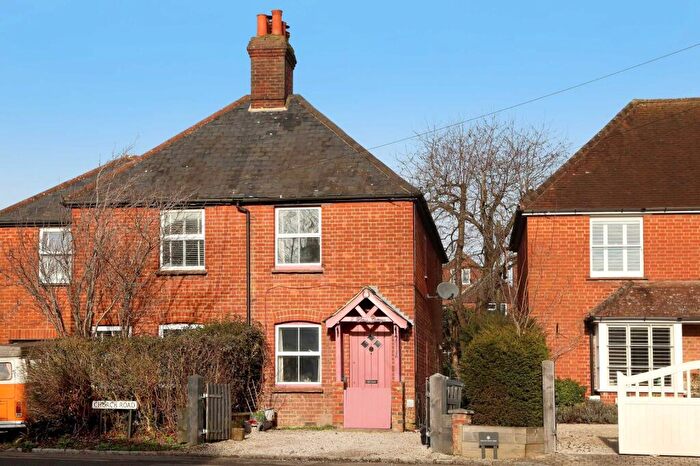
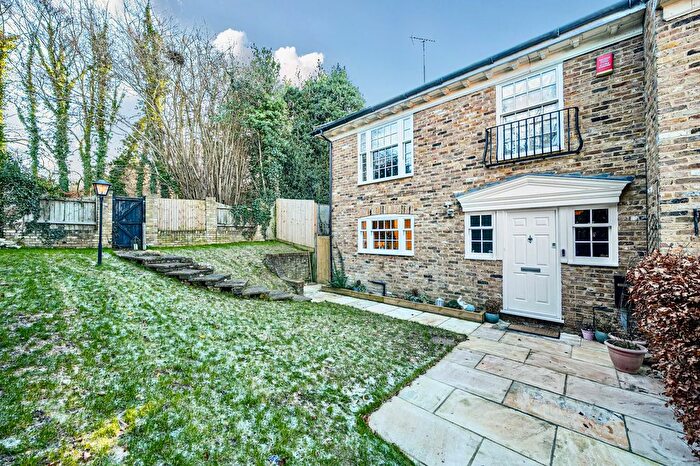
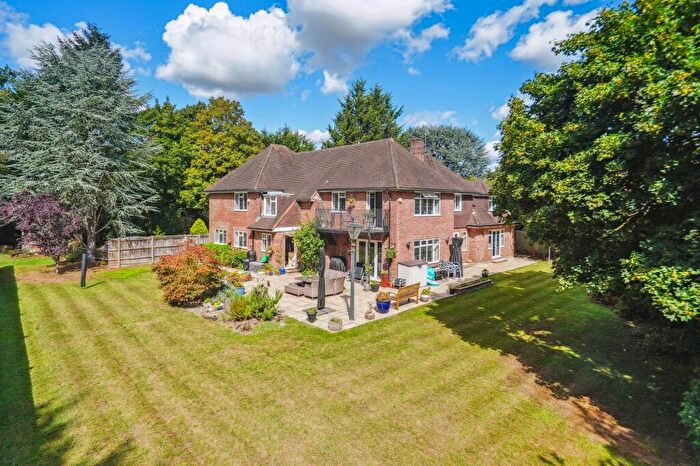
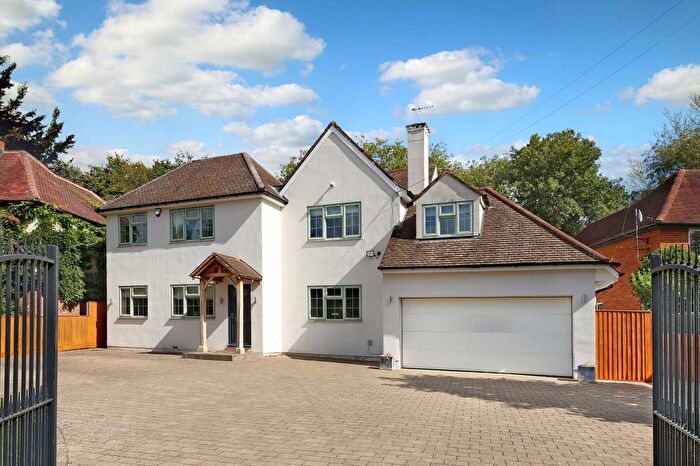
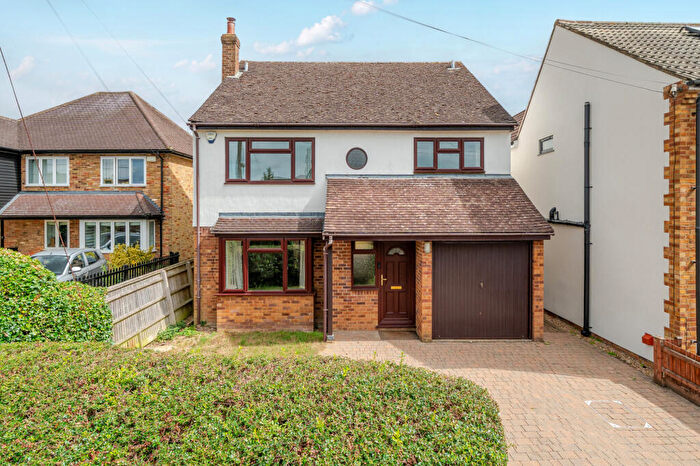
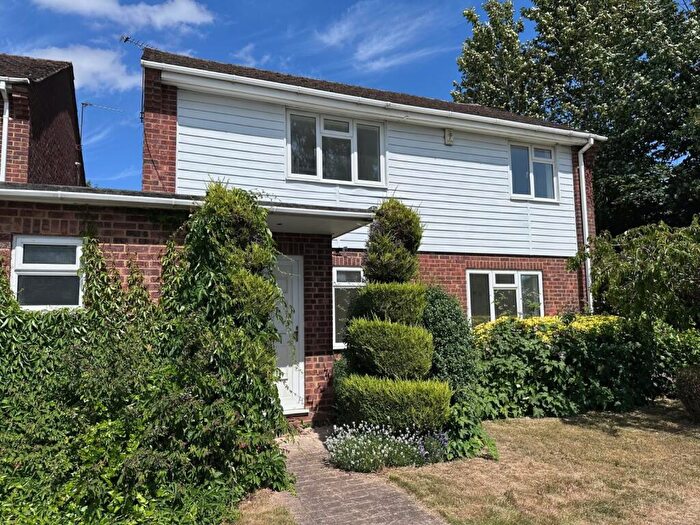
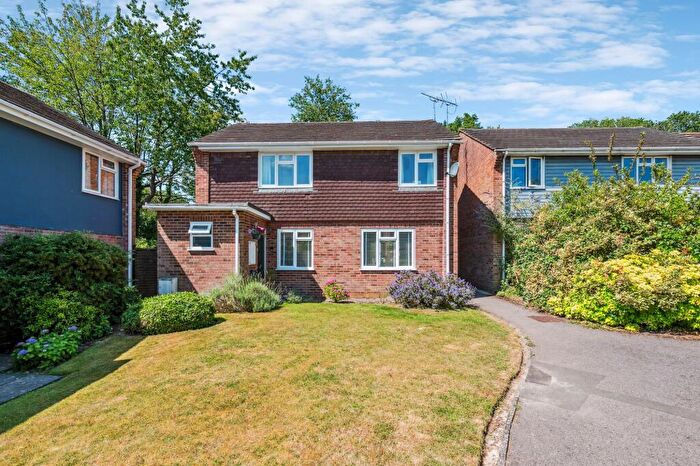
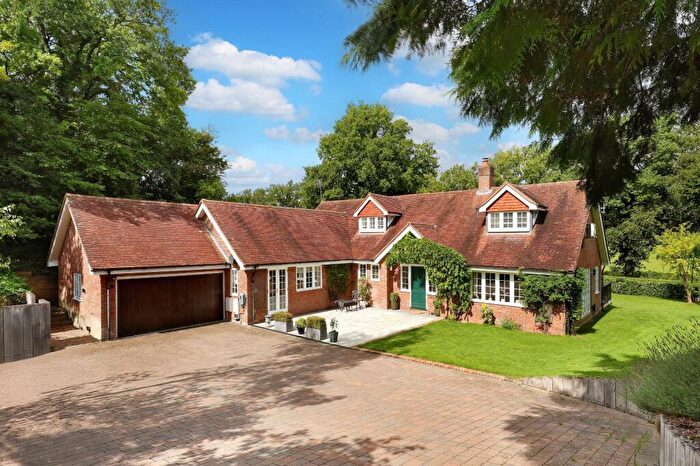
Houses for sale & to rent in Seer Green, Beaconsfield
House Prices in Seer Green
Properties in Seer Green have an average house price of £1,231,319.00 and had 76 Property Transactions within the last 3 years¹.
Seer Green is an area in Beaconsfield, Buckinghamshire with 864 households², where the most expensive property was sold for £5,500,000.00.
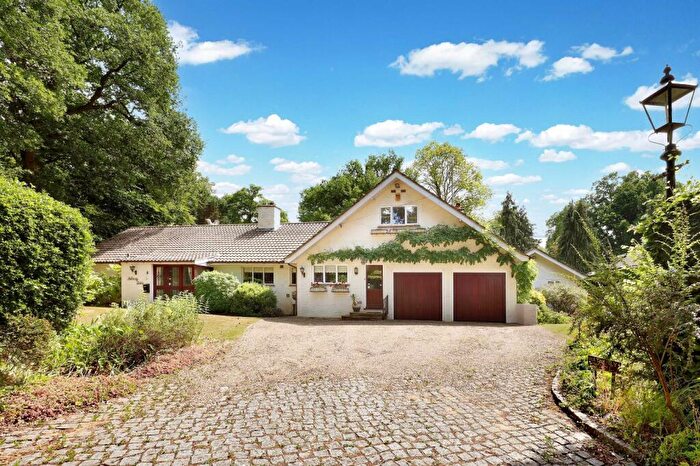
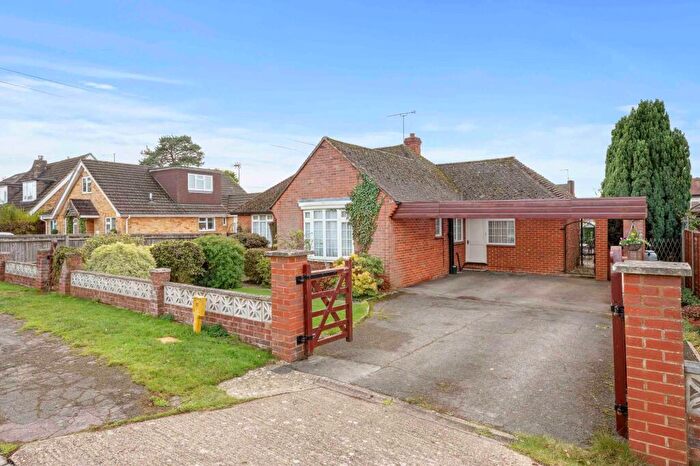
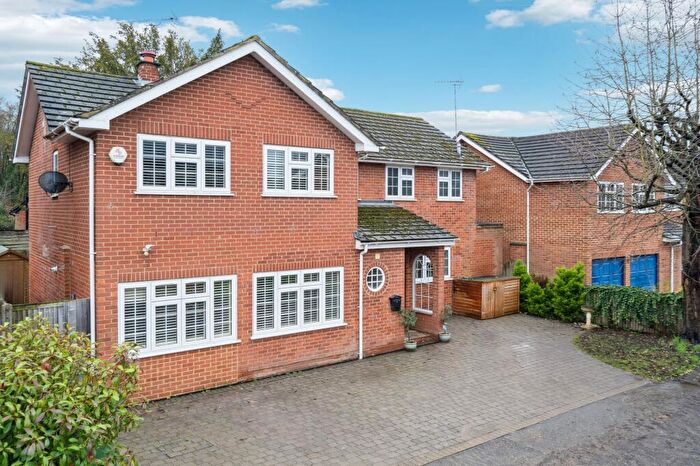
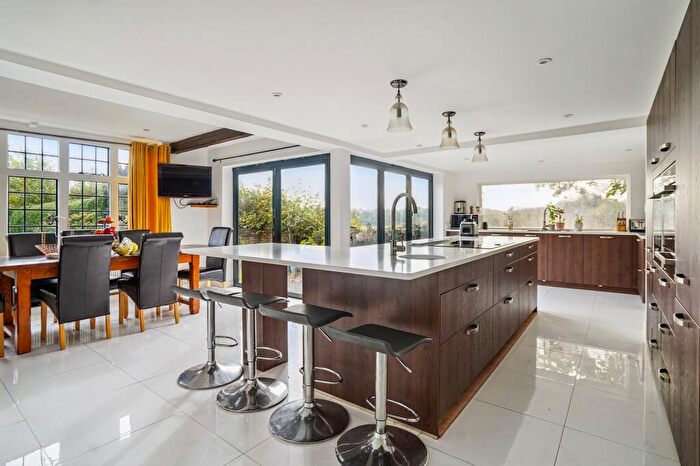
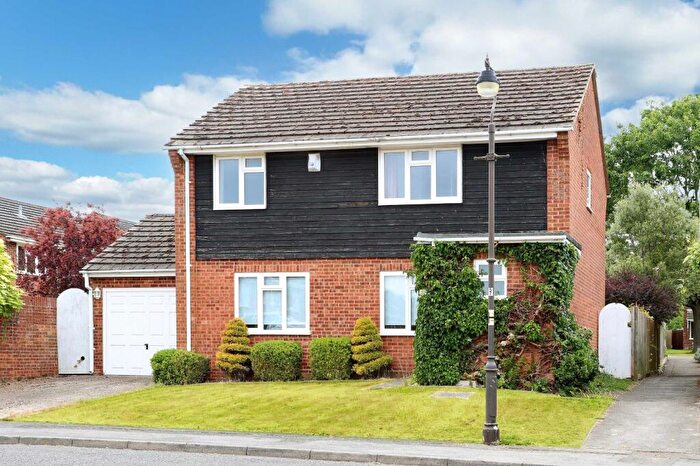
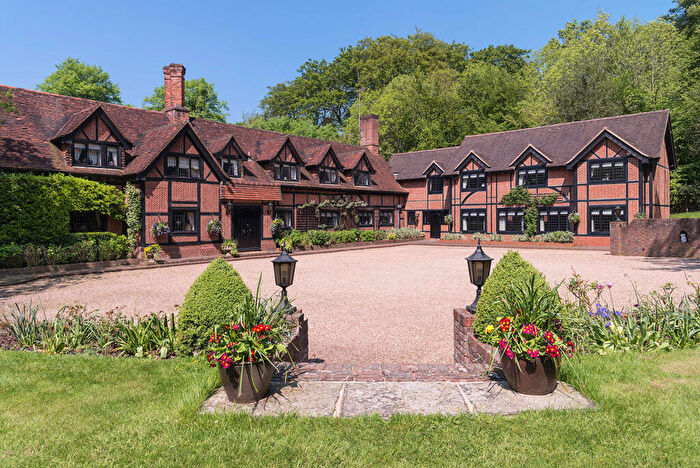
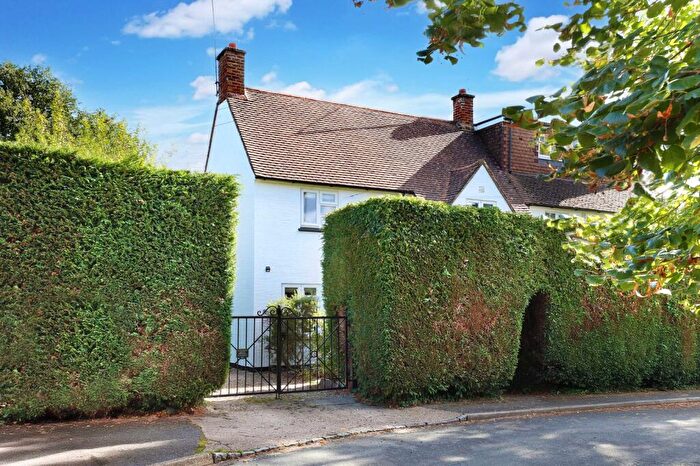
Properties for sale in Seer Green
Previously listed properties in Seer Green
Roads and Postcodes in Seer Green
Navigate through our locations to find the location of your next house in Seer Green, Beaconsfield for sale or to rent.
| Streets | Postcodes |
|---|---|
| Barrards Way | HP9 2YZ |
| Bayne Hill Close | HP9 2QQ |
| Bottom Lane | HP9 2RH HP9 2UH |
| Chalfont Road | HP9 2QP HP9 2YG HP9 2YQ HP9 2YS |
| Cherry Wood Close | HP9 2XY |
| Church Road | HP9 2XZ |
| Coat Wicks | HP9 2YR |
| Culvers Croft | HP9 2YU |
| Dell Lees | HP9 2UJ |
| Drovers Way | HP9 2XF |
| Farmers Way | HP9 2YX HP9 2YY |
| Godolphin Road | HP9 2XQ |
| Greenwood Close | HP9 2SL |
| Gurnells Road | HP9 2XJ |
| Hearnes Close | HP9 2QT |
| Hearnes Meadow | HP9 2YH HP9 2YJ |
| Highlands Road | HP9 2XL HP9 2XN |
| Howard Crescent | HP9 2XP HP9 2XR |
| Howard Road | HP9 2XS HP9 2XT |
| Long Bottom Lane | HP9 2UL |
| Long Grove | HP9 2QH HP9 2YL HP9 2YN HP9 2YW |
| Manor Crescent | HP9 2QX |
| Manor Farm Way | HP9 2YD |
| Manor Road | HP9 2QU |
| Newbarn Lane | HP9 2QZ |
| Orchard Court | HP9 2UZ |
| Orchard Road | HP9 2XH HP9 2XU |
| Paddocks End | HP9 2DR |
| Park Place | HP9 2FJ |
| Pear Tree Close | HP9 2UY |
| Princess Grove | HP9 2GN |
| Raeside Close | HP9 2UB |
| Rawlings Lane | HP9 2RQ |
| School Lane | HP9 2QJ HP9 2YE |
| Seer Mead | HP9 2QL |
| Stable Lane | HP9 2YT |
| The Coppice | HP9 2SH |
| Vicarage Close | HP9 2QG |
| Wood Pond Close | HP9 2XG |
| Worley Place | HP9 2QF |
| Wynnswick Road | HP9 2XW |
Transport near Seer Green
-
Seer Green Station
-
Beaconsfield Station
-
Gerrards Cross Station
-
Amersham Station
-
Chalfont and Latimer Station
-
Chorleywood Station
-
Denham Golf Club Station
- FAQ
- Price Paid By Year
- Property Type Price
Frequently asked questions about Seer Green
What is the average price for a property for sale in Seer Green?
The average price for a property for sale in Seer Green is £1,231,319. This amount is 3% higher than the average price in Beaconsfield. There are 128 property listings for sale in Seer Green.
What streets have the most expensive properties for sale in Seer Green?
The streets with the most expensive properties for sale in Seer Green are Long Bottom Lane at an average of £2,720,000, Long Grove at an average of £2,648,694 and Seer Mead at an average of £1,900,000.
What streets have the most affordable properties for sale in Seer Green?
The streets with the most affordable properties for sale in Seer Green are Farmers Way at an average of £471,000, Hearnes Meadow at an average of £557,500 and Barrards Way at an average of £632,500.
Which train stations are available in or near Seer Green?
Some of the train stations available in or near Seer Green are Seer Green, Beaconsfield and Gerrards Cross.
Which tube stations are available in or near Seer Green?
Some of the tube stations available in or near Seer Green are Amersham, Chalfont and Latimer and Chorleywood.
Property Price Paid in Seer Green by Year
The average sold property price by year was:
| Year | Average Sold Price | Price Change |
Sold Properties
|
|---|---|---|---|
| 2025 | £1,035,285 | -9% |
21 Properties |
| 2024 | £1,127,420 | -29% |
25 Properties |
| 2023 | £1,455,125 | 12% |
30 Properties |
| 2022 | £1,279,293 | 15% |
35 Properties |
| 2021 | £1,089,076 | 16% |
48 Properties |
| 2020 | £915,348 | 8% |
32 Properties |
| 2019 | £838,104 | -16% |
48 Properties |
| 2018 | £968,076 | 19% |
30 Properties |
| 2017 | £780,878 | -50% |
46 Properties |
| 2016 | £1,170,318 | 23% |
29 Properties |
| 2015 | £896,627 | 28% |
33 Properties |
| 2014 | £644,615 | -13% |
36 Properties |
| 2013 | £731,005 | 3% |
45 Properties |
| 2012 | £711,728 | -2% |
35 Properties |
| 2011 | £727,347 | 11% |
23 Properties |
| 2010 | £650,085 | 26% |
37 Properties |
| 2009 | £478,512 | -31% |
36 Properties |
| 2008 | £624,694 | 17% |
19 Properties |
| 2007 | £516,926 | -16% |
41 Properties |
| 2006 | £601,983 | 15% |
63 Properties |
| 2005 | £511,858 | -19% |
41 Properties |
| 2004 | £611,205 | 11% |
52 Properties |
| 2003 | £541,915 | 33% |
36 Properties |
| 2002 | £361,872 | -12% |
51 Properties |
| 2001 | £404,508 | 12% |
47 Properties |
| 2000 | £354,104 | 11% |
60 Properties |
| 1999 | £313,966 | 18% |
69 Properties |
| 1998 | £256,126 | 22% |
39 Properties |
| 1997 | £199,534 | -0,2% |
47 Properties |
| 1996 | £199,890 | 1% |
52 Properties |
| 1995 | £198,682 | - |
43 Properties |
Property Price per Property Type in Seer Green
Here you can find historic sold price data in order to help with your property search.
The average Property Paid Price for specific property types in the last three years are:
| Property Type | Average Sold Price | Sold Properties |
|---|---|---|
| Semi Detached House | £853,325.00 | 20 Semi Detached Houses |
| Detached House | £1,514,890.00 | 48 Detached Houses |
| Terraced House | £496,285.00 | 7 Terraced Houses |
| Flat | £325,000.00 | 1 Flat |

