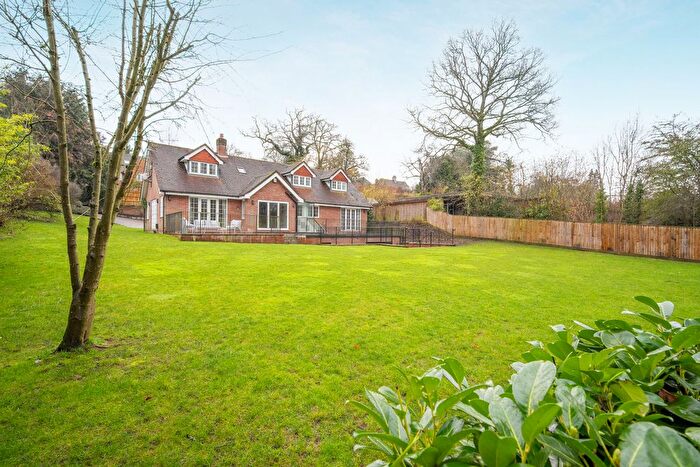
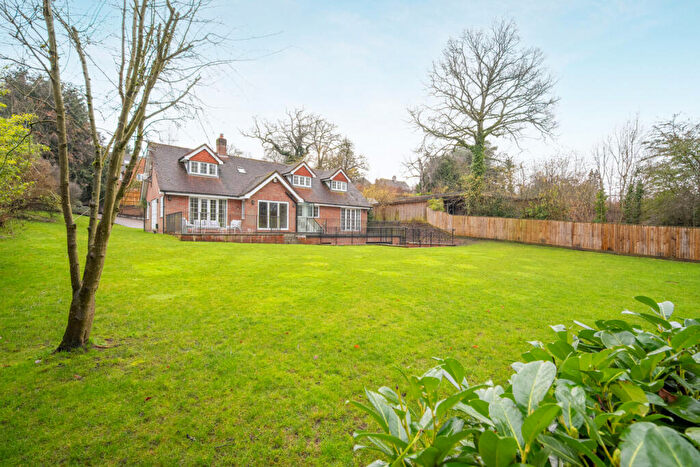
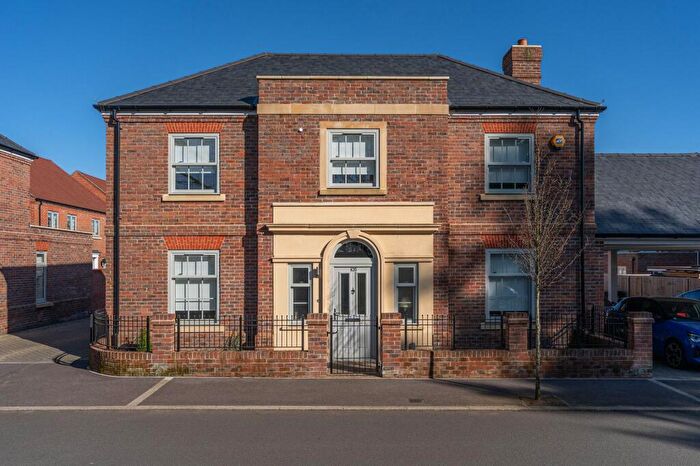
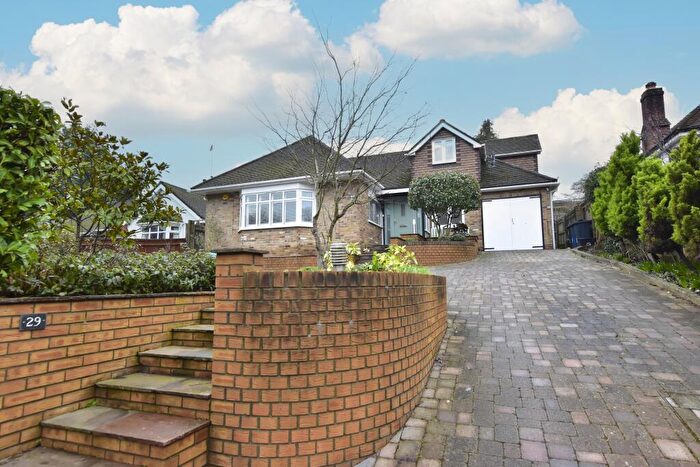
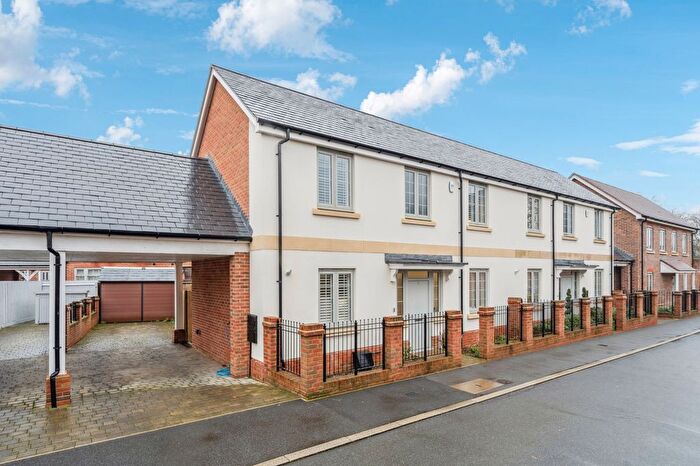
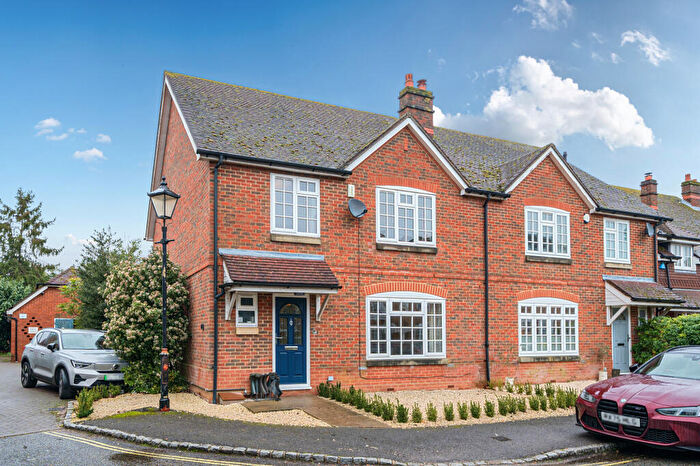
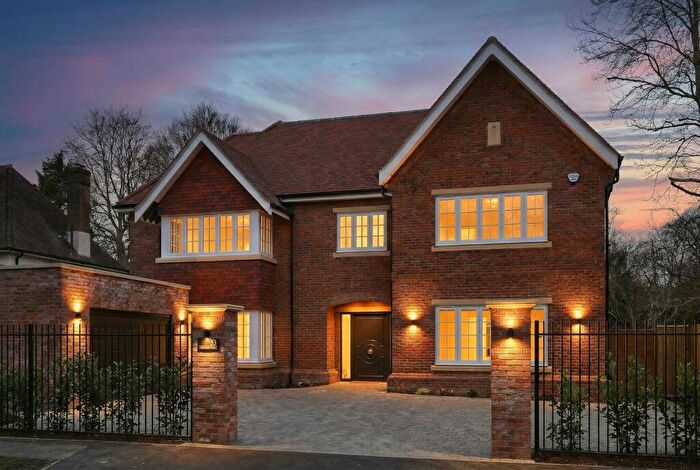
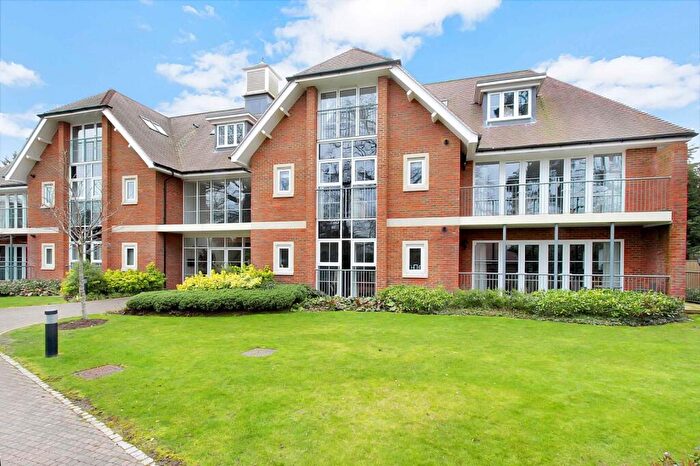
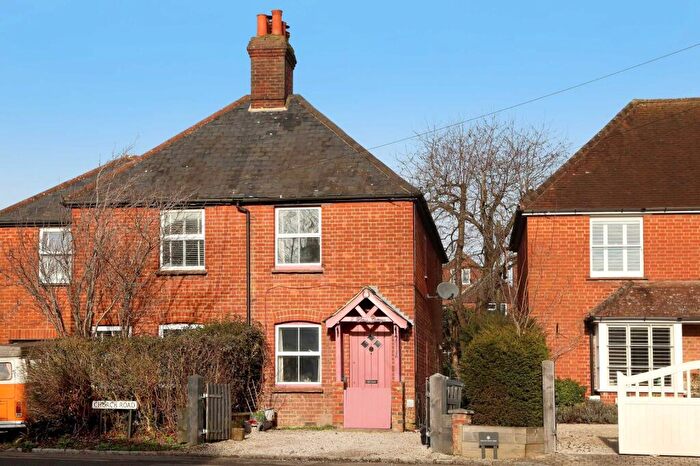
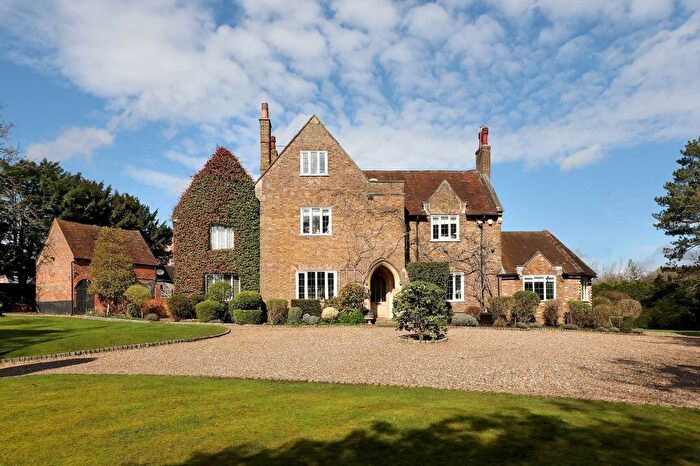
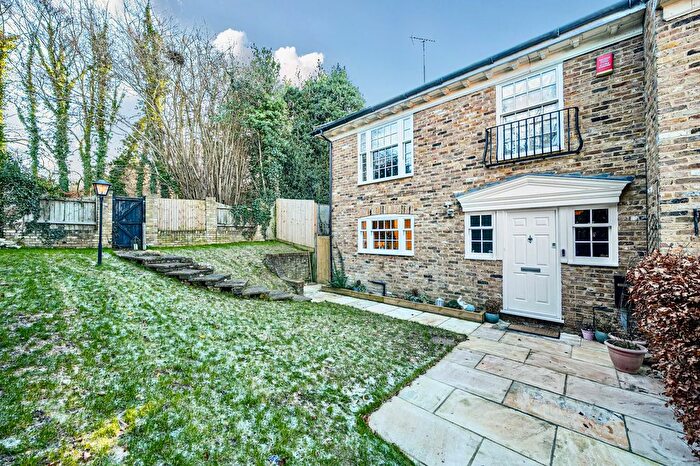
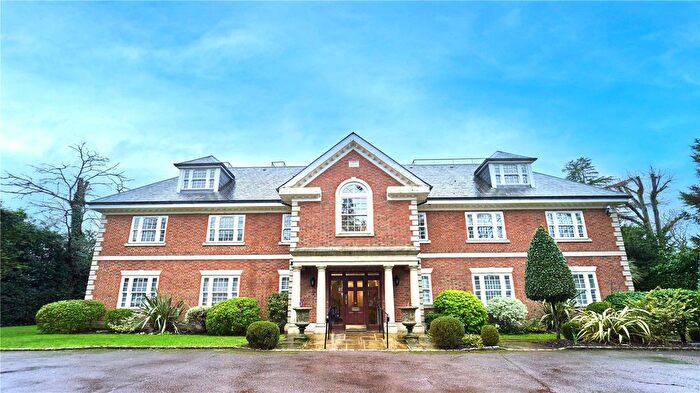
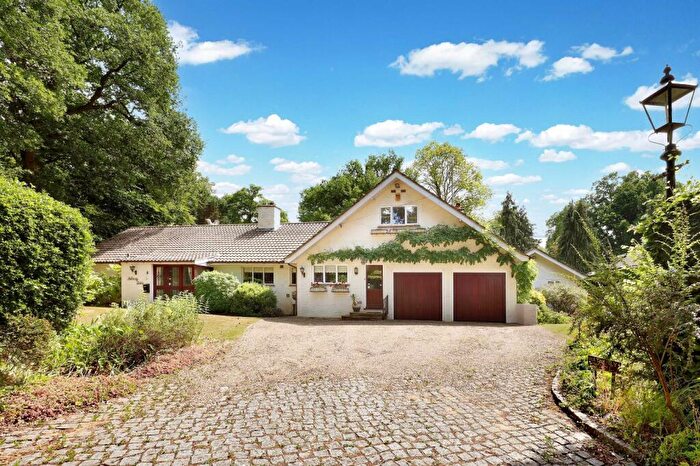
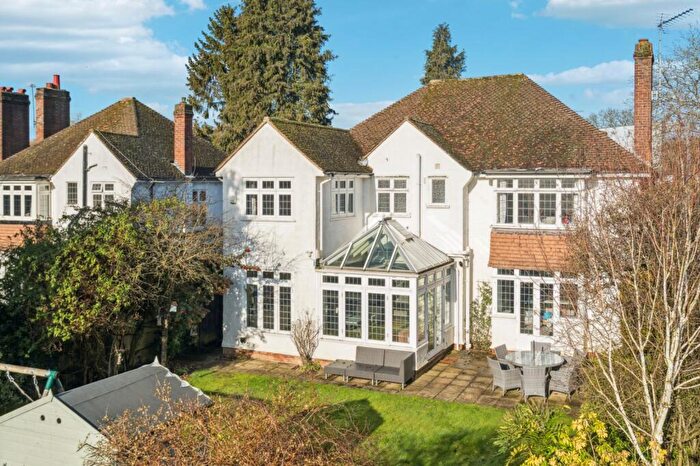
Houses for sale & to rent in Chalfont St Giles, Beaconsfield
House Prices in Chalfont St Giles
Properties in Chalfont St Giles have an average house price of £2,103,642.00 and had 21 Property Transactions within the last 3 years¹.
Chalfont St Giles is an area in Beaconsfield, Buckinghamshire with 303 households², where the most expensive property was sold for £8,000,000.00.
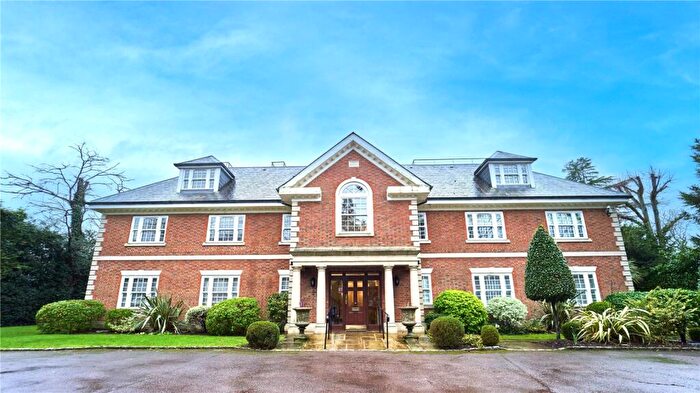
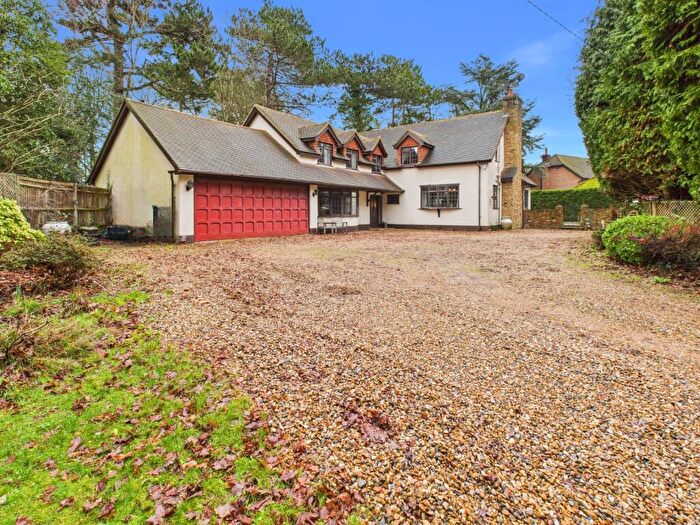
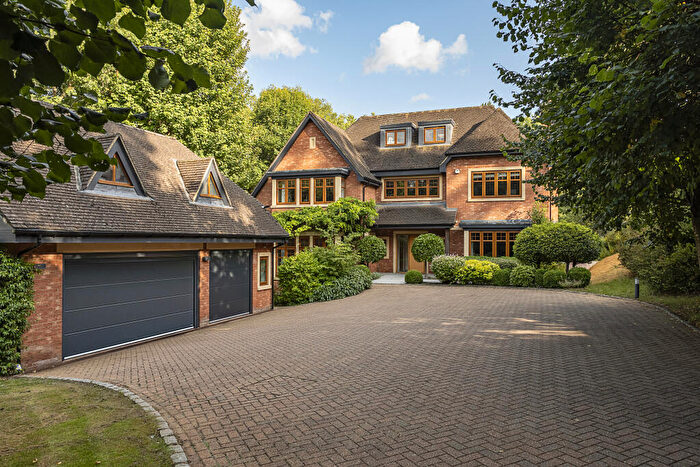
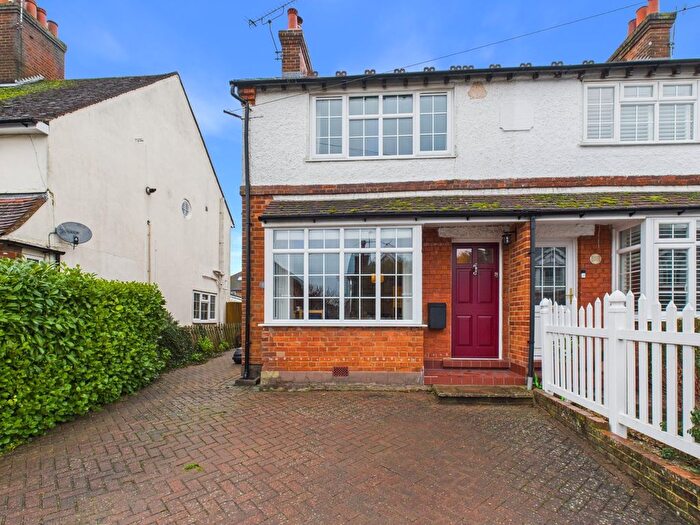
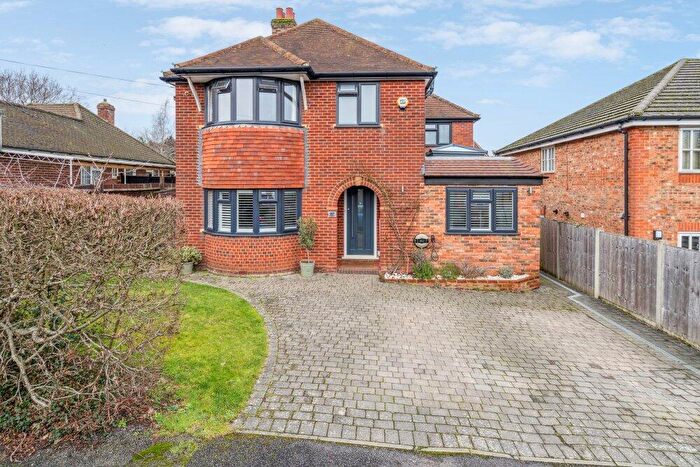
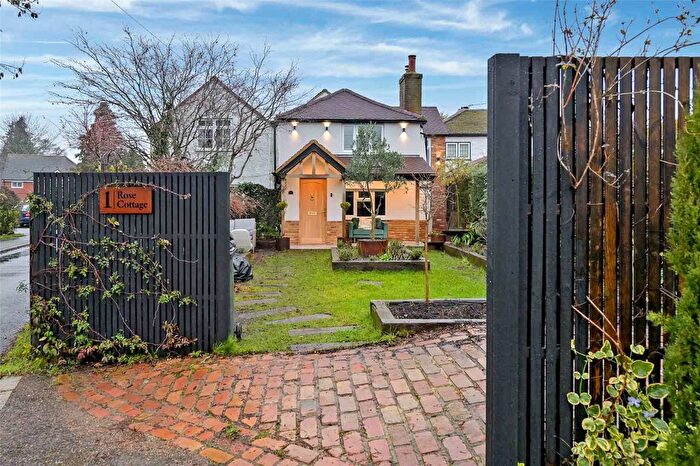
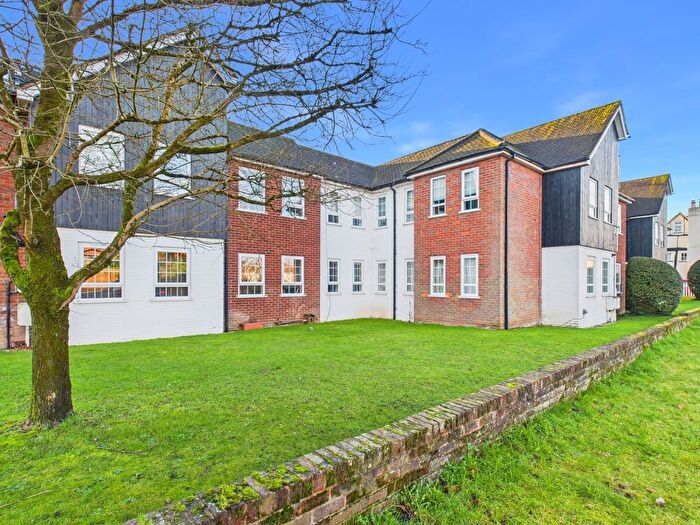
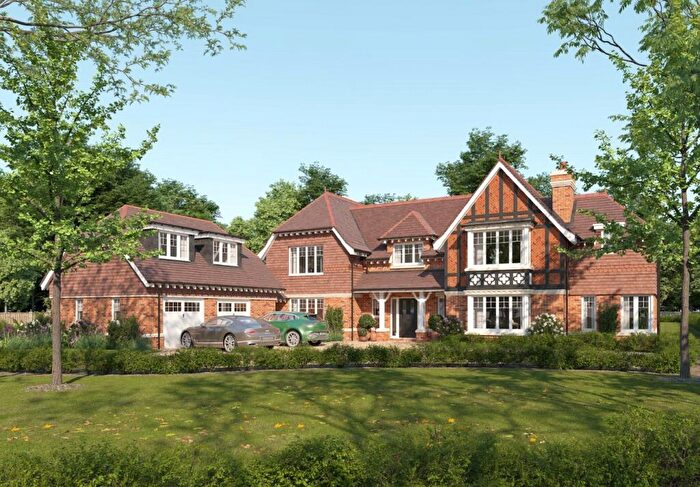
Properties for sale in Chalfont St Giles
Roads and Postcodes in Chalfont St Giles
Navigate through our locations to find the location of your next house in Chalfont St Giles, Beaconsfield for sale or to rent.
| Streets | Postcodes |
|---|---|
| Beaconsfield Road | HP7 0JU |
| Beech Lane | HP9 2SZ |
| Chalfont Road | HP9 2FX |
| Cherry Tree Corner | HP9 2TD |
| Copse Lane | HP9 2TA |
| Crutches Lane | HP9 2TG |
| Dean Wood Road | HP9 2UU |
| Farm Lane | HP9 2UP |
| Green East Road | HP9 2SU |
| Green North Road | HP9 2SX |
| Green West Road | HP9 2SY |
| Jordans Lane | HP9 2SW HP9 2UX |
| Jordans Way | HP9 2SP |
| Long Bottom Lane | HP9 2UT |
| Long Wood Drive | HP9 2SS |
| Meadowside | HP9 2SJ |
| Moss Court | HP9 2YP |
| New Road | HP7 0LE |
| Orchard Mews | HP9 2YB |
| Orchard Road | HP9 2XX HP9 2YA |
| Oxford Road | HP9 2XD |
| Potkiln Lane | HP9 2XA |
| Puers Field | HP9 2TF |
| Puers Lane | HP9 2TE |
| School Lane | HP9 2UN |
| The Bit | HP7 0LP |
| The Green | HP9 2ST |
| Tower Road | HP7 0LA |
| Twitchells Lane | HP9 2RA HP9 2RE |
| Welders Lane | HP9 2SN |
| Whielden Lane | HP7 0BX |
| Wilton Lane | HP9 2RF HP9 2RG HP9 2TB HP9 2UW |
| HP9 2UR |
Transport near Chalfont St Giles
- FAQ
- Price Paid By Year
- Property Type Price
Frequently asked questions about Chalfont St Giles
What is the average price for a property for sale in Chalfont St Giles?
The average price for a property for sale in Chalfont St Giles is £2,103,642. This amount is 75% higher than the average price in Beaconsfield. There are 1,530 property listings for sale in Chalfont St Giles.
What streets have the most expensive properties for sale in Chalfont St Giles?
The streets with the most expensive properties for sale in Chalfont St Giles are Wilton Lane at an average of £3,912,500, Beech Lane at an average of £2,207,000 and Jordans Way at an average of £2,187,500.
What streets have the most affordable properties for sale in Chalfont St Giles?
The streets with the most affordable properties for sale in Chalfont St Giles are Green West Road at an average of £220,000, Crutches Lane at an average of £1,125,000 and Green East Road at an average of £1,150,000.
Which train stations are available in or near Chalfont St Giles?
Some of the train stations available in or near Chalfont St Giles are Seer Green, Beaconsfield and Gerrards Cross.
Property Price Paid in Chalfont St Giles by Year
The average sold property price by year was:
| Year | Average Sold Price | Price Change |
Sold Properties
|
|---|---|---|---|
| 2025 | £1,629,642 | -34% |
7 Properties |
| 2024 | £2,184,857 | -14% |
7 Properties |
| 2023 | £2,496,428 | 36% |
7 Properties |
| 2022 | £1,596,000 | -16% |
10 Properties |
| 2021 | £1,856,666 | 19% |
12 Properties |
| 2020 | £1,501,875 | 25% |
4 Properties |
| 2019 | £1,129,125 | -11% |
8 Properties |
| 2018 | £1,252,454 | -26% |
11 Properties |
| 2017 | £1,583,000 | 16% |
8 Properties |
| 2016 | £1,331,250 | 18% |
4 Properties |
| 2015 | £1,089,500 | 6% |
10 Properties |
| 2014 | £1,022,071 | -49% |
7 Properties |
| 2013 | £1,522,500 | 7% |
12 Properties |
| 2012 | £1,415,833 | 21% |
6 Properties |
| 2011 | £1,118,082 | -55% |
2 Properties |
| 2010 | £1,730,000 | 47% |
2 Properties |
| 2009 | £923,190 | -36% |
7 Properties |
| 2008 | £1,253,333 | -1% |
9 Properties |
| 2007 | £1,271,160 | 16% |
10 Properties |
| 2006 | £1,068,285 | 32% |
7 Properties |
| 2005 | £729,944 | -13% |
9 Properties |
| 2004 | £822,272 | 16% |
11 Properties |
| 2003 | £686,600 | 11% |
5 Properties |
| 2002 | £612,600 | 8% |
10 Properties |
| 2001 | £564,561 | -11% |
5 Properties |
| 2000 | £626,250 | 32% |
8 Properties |
| 1999 | £425,333 | -52% |
9 Properties |
| 1998 | £647,500 | 47% |
5 Properties |
| 1997 | £340,625 | 48% |
8 Properties |
| 1996 | £176,500 | -46% |
6 Properties |
| 1995 | £257,240 | - |
10 Properties |
Property Price per Property Type in Chalfont St Giles
Here you can find historic sold price data in order to help with your property search.
The average Property Paid Price for specific property types in the last three years are:
| Property Type | Average Sold Price | Sold Properties |
|---|---|---|
| Semi Detached House | £1,020,000.00 | 2 Semi Detached Houses |
| Detached House | £2,328,694.00 | 18 Detached Houses |
| Flat | £220,000.00 | 1 Flat |

