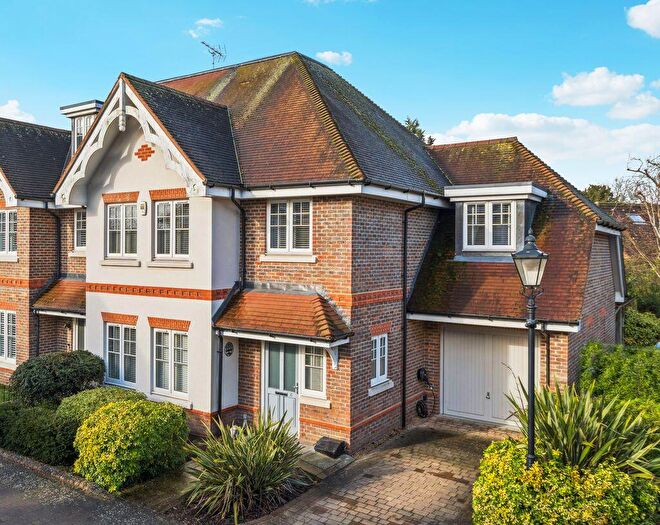
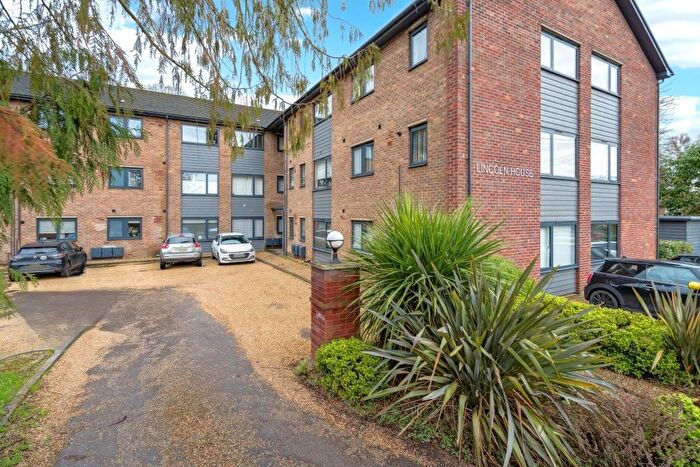
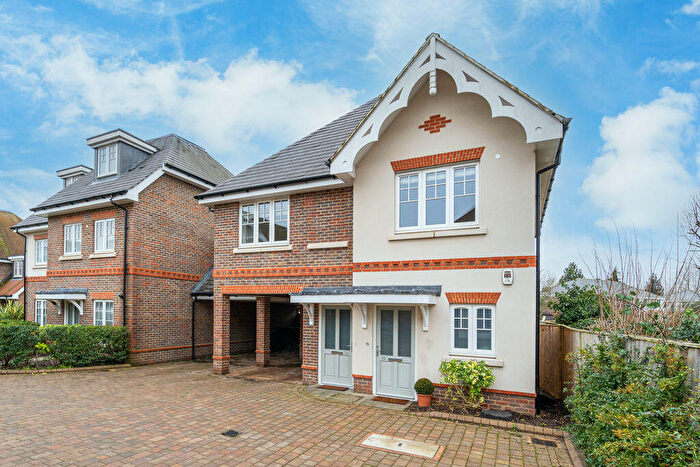
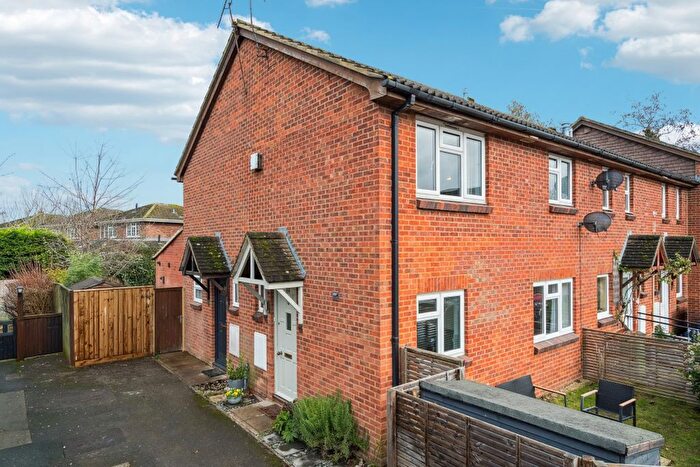
Houses for sale & to rent in Bourne End-cum-hedsor, Bourne End
House Prices in Bourne End-cum-hedsor
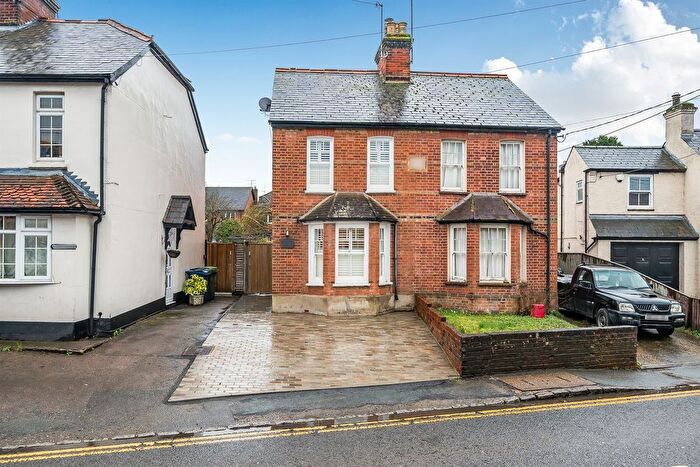
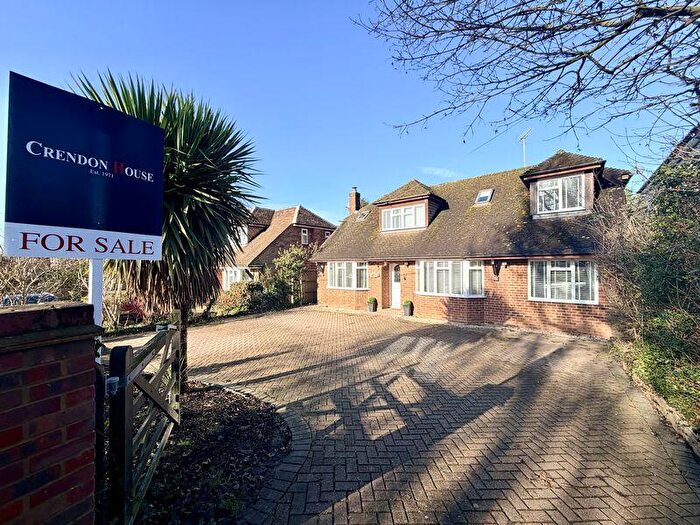
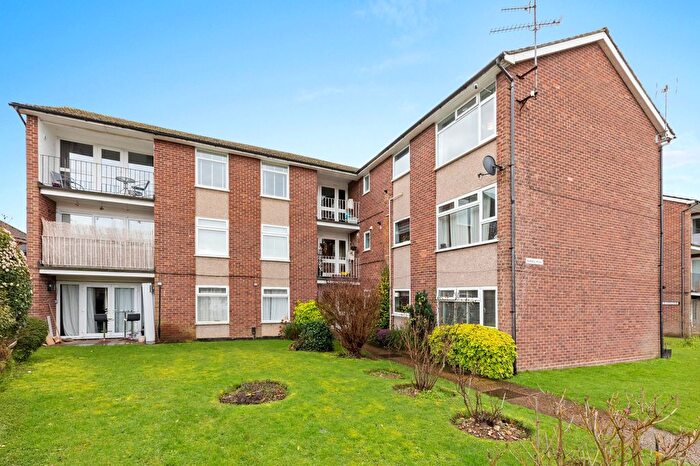
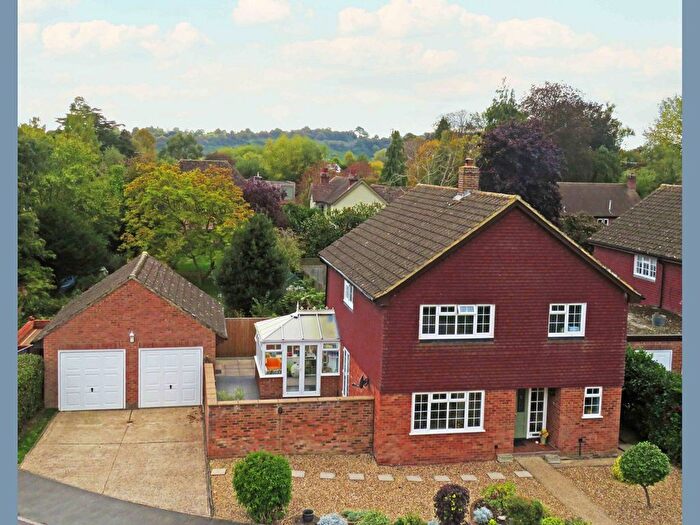
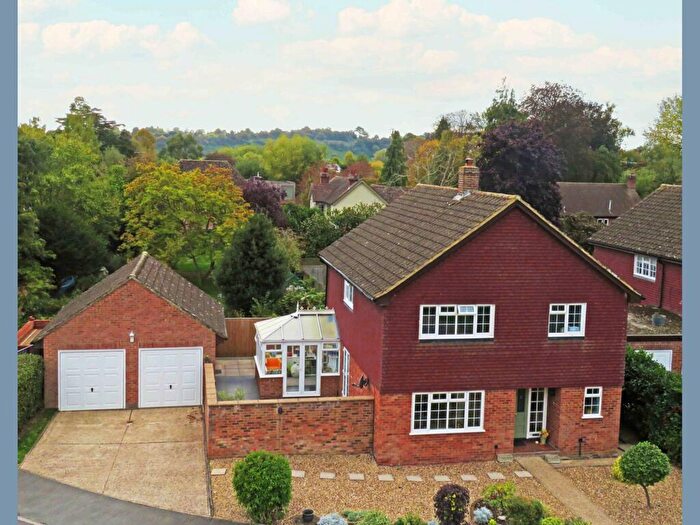
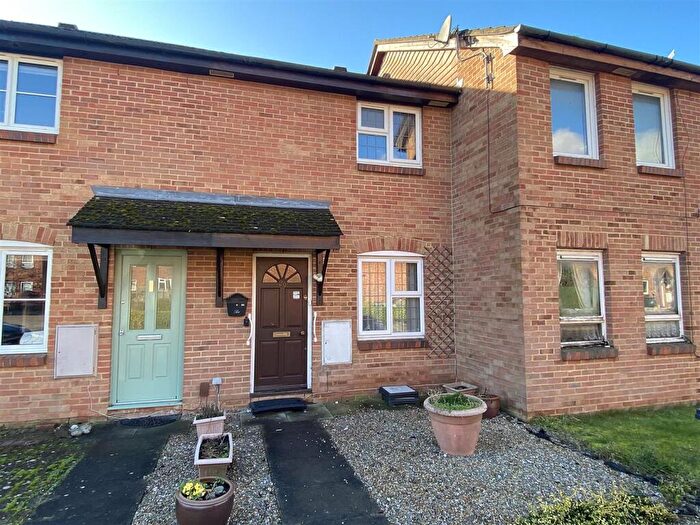
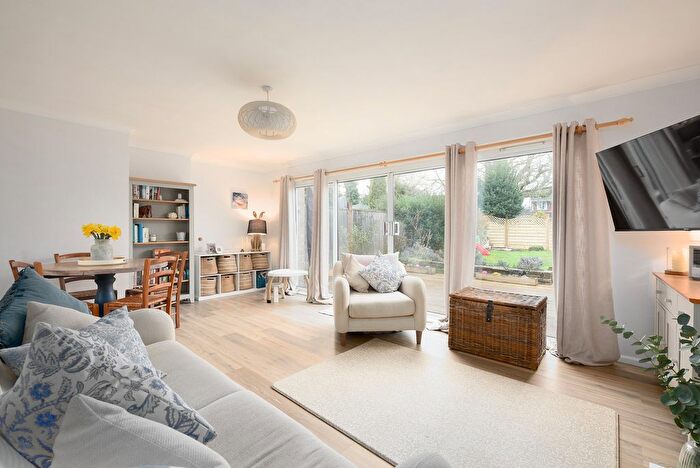
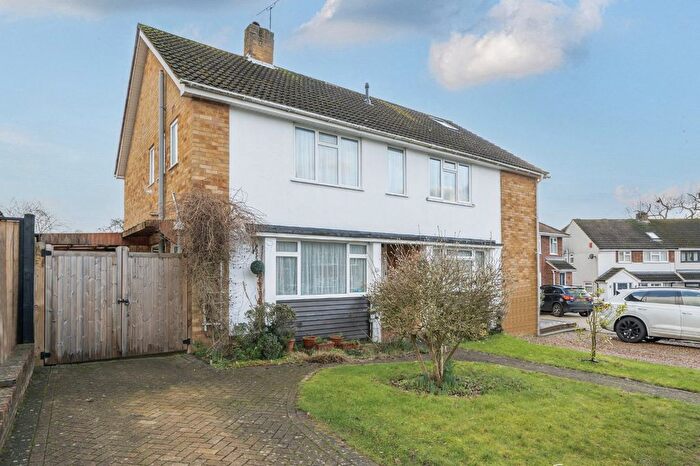
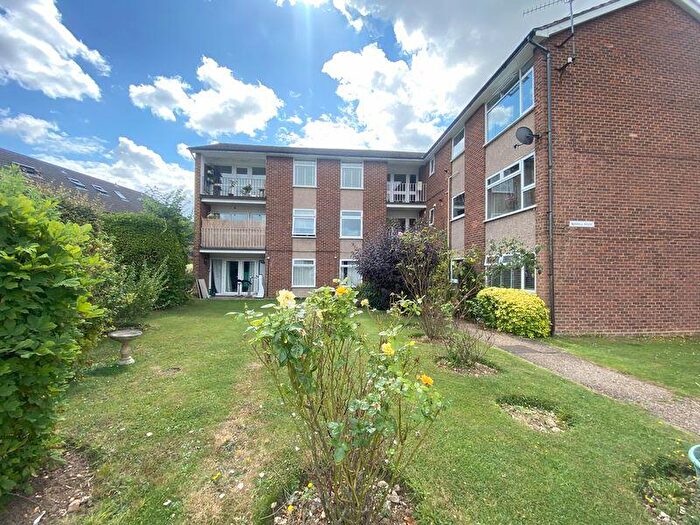
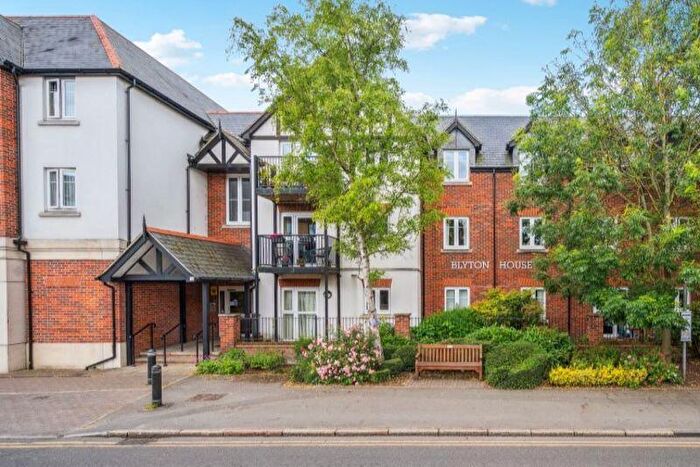
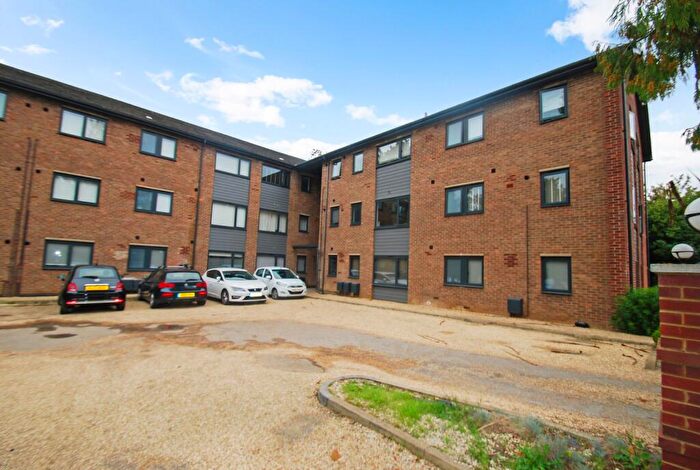
Properties in Bourne End-cum-hedsor have an average house price of £640,327.00 and had 221 Property Transactions within the last 3 years¹.
Bourne End-cum-hedsor is an area in Bourne End, Buckinghamshire with 2,254 households², where the most expensive property was sold for £2,775,000.00.
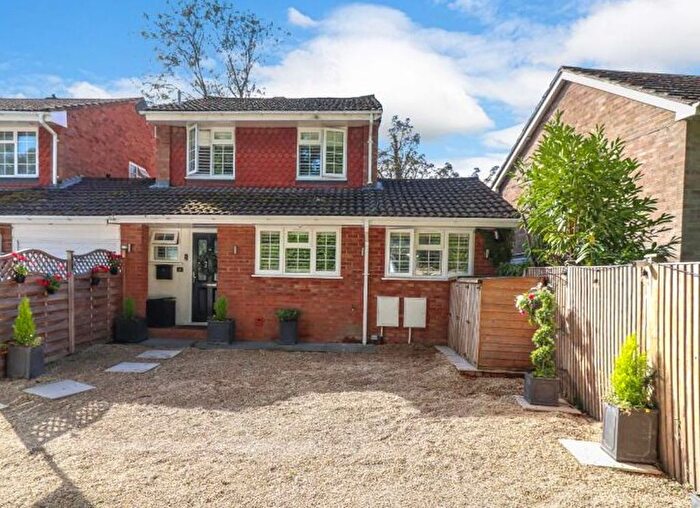
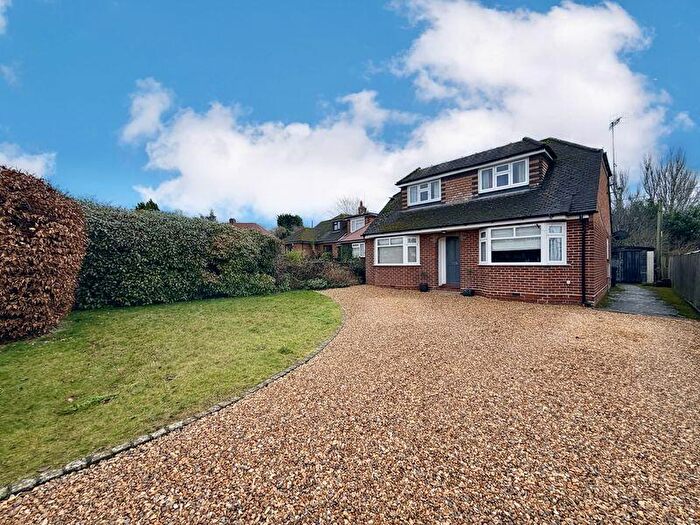
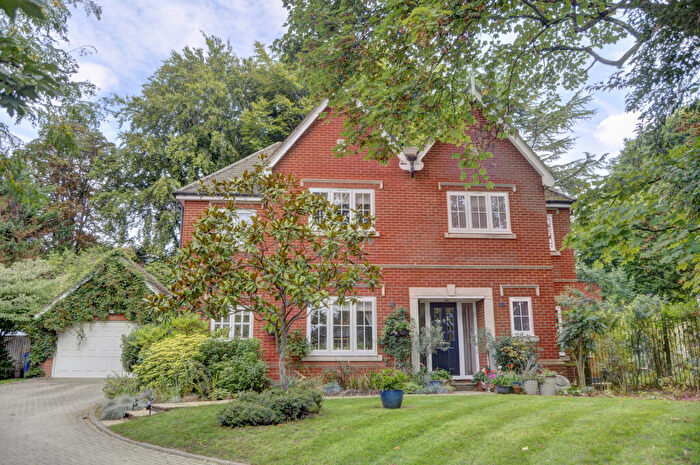
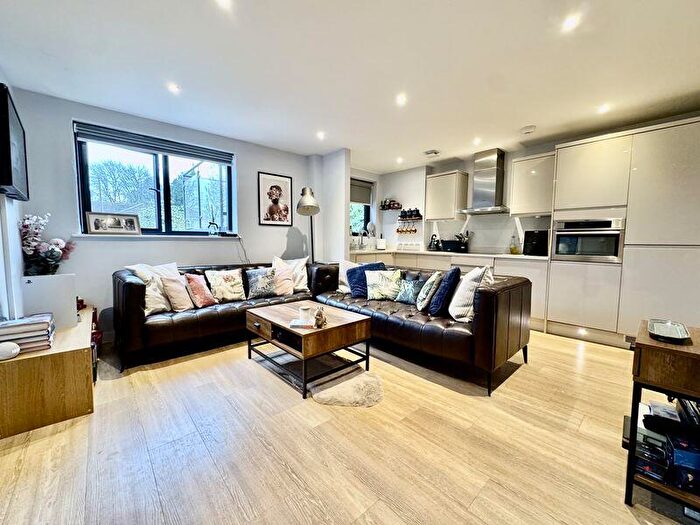
Properties for sale in Bourne End-cum-hedsor
Roads and Postcodes in Bourne End-cum-hedsor
Navigate through our locations to find the location of your next house in Bourne End-cum-hedsor, Bourne End for sale or to rent.
| Streets | Postcodes |
|---|---|
| Abney Court Drive | SL8 5DL |
| Alma Cottages | SL8 5EU |
| Andrews Reach | SL8 5GA |
| Avalon Road | SL8 5TS |
| Beaconsfield Cottages | SL8 5EQ |
| Blind Lane | SL8 5JS SL8 5JX SL8 5JY SL8 5LA SL8 5LD SL8 5LF SL8 5TG SL8 5TN |
| Bourne Close | SL8 5NG |
| Bramley Gardens | SL8 5FF |
| Brent Road | SL8 5LU |
| Bridgestone Drive | SL8 5XG SL8 5XH SL8 5XQ |
| Burnham Close | SL8 5ST |
| Camden Place | SL8 5RW |
| Chalklands | SL8 5TH SL8 5TJ SL8 5TL SL8 5TQ |
| Cherwell Road | SL8 5NB |
| Chilterns Park | SL8 5LB |
| Claytons Meadow | SL8 5DQ |
| Cliffords Way | SL8 5TR |
| Clifton Place | SL8 5JF |
| Cores End Road | SL8 5AL SL8 5AR SL8 5HH SL8 5HL SL8 5HP SL8 5HR SL8 5HT SL8 5HW SL8 5JD |
| Coster Cottages | SL8 5EH |
| Cressington Court | SL8 5SW |
| Cressington Place | SL8 5SH SL8 5SJ SL8 5SL SL8 5SN SL8 5SQ |
| Dandridge Drive | SL8 5UW |
| Donkey Lane | SL8 5RR |
| East Ridge | SL8 5BX |
| Eastern Drive | SL8 5HQ |
| Edgar Wallace Place | SL8 5LG |
| Elms Drive | SL8 5HB |
| Evenlode Road | SL8 5ND |
| Fern Cottages | SL8 5HX |
| Ferry Lane | SL8 5DZ SL8 5ED |
| Fieldhead Gardens | SL8 5RN |
| Fishermans Way | SL8 5LX SL8 5LY |
| Four Winds | SL8 5FW |
| Frank Lunnon Close | SL8 5UP SL8 5UR |
| Furlong Close | SL8 5AB SL8 5AT |
| Furlong Road | SL8 5AA SL8 5AE SL8 5AG SL8 5AH SL8 5DG |
| Georgian Heights | SL8 5NJ |
| Goddington Road | SL8 5TT SL8 5TU SL8 5TX SL8 5TZ |
| Greenside | SL8 5TW |
| Groves Close | SL8 5JP |
| Harvest Hill | SL8 5JJ |
| Hawks Hill | SL8 5JH SL8 5JQ |
| Hayward Place | SL8 5EP |
| Heavens Lea | SL8 5JL |
| Hedsor Road | SL8 5DH SL8 5DN SL8 5DP SL8 5EE SL8 5ES SL8 5EX |
| Hellyer Way | SL8 5XL SL8 5XN SL8 5XW |
| Highfield Road | SL8 5BE SL8 5BG |
| Isis Way | SL8 5NF |
| Jeffries Court | SL8 5DY |
| Kennet Road | SL8 5NA |
| Kiln Lane | SL8 5JG |
| Laurel Cottages | SL8 5HN |
| Loddon Road | SL8 5LS SL8 5LT |
| Lower Ridge | SL8 5BL |
| Magdala Villas | SL8 5AP |
| Marlow Road | SL8 5NL SL8 5SP |
| Meadow Walk | SL8 5TP |
| Millboard Road | SL8 5XJ |
| Millside | SL8 5UN |
| Mount Pleasant Cottages | SL8 5AN |
| New Road | SL8 5BH SL8 5BJ SL8 5BQ SL8 5BS SL8 5BT SL8 5BY SL8 5BZ SL8 5DA SL8 5DB |
| Newbury Cottages | SL8 5DJ |
| Newman Cottages | SL8 5EL |
| Northern Heights | SL8 5LE |
| Oakfield Road | SL8 5QR |
| Osbourne Cottages | SL8 5ET |
| Princes Road | SL8 5HZ SL8 5JA |
| Princes Terrace | SL8 5HJ |
| Ravenshoe Close | SL8 5QP |
| Recreation Road | SL8 5AD |
| Riversdale | SL8 5EA SL8 5EB SL8 5XP |
| Riverside | SL8 5HS |
| Roman Way | SL8 5LJ SL8 5LN SL8 5LP SL8 5LW |
| Rothsay Villas | SL8 5AW |
| Rowland Villas | SL8 5EJ |
| Southbourne Drive | SL8 5RY SL8 5RZ |
| Southview Terrace | SL8 5JB |
| Spring Cottages | SL8 5EG |
| Spring Gardens | SL8 5JT |
| Spring Villas | SL8 5SR |
| Springdale Cottages | SL8 5EN |
| Station Road | SL8 5QA SL8 5QD SL8 5QE SL8 5QF SL8 5QG |
| Sycamore Close | SL8 5UT |
| Sydney Cottages | SL8 5HY |
| Telston Close | SL8 5TY |
| Thames Close | SL8 5QJ |
| Thamesbourne Mews | SL8 5QH SL8 5RJ |
| The Maples | SL8 5HD |
| The Parade | SL8 5SB SL8 5SS SL8 5SY |
| The Rosery | SL8 5TB |
| The Willows | SL8 5HE |
| Thornton Cottages | SL8 5EW |
| Trees Road | SL8 5HF |
| Waborne Road | SL8 5LH SL8 5LL |
| Waldens Close | SL8 5RT |
| Walnut Tree Close | SL8 5DS |
| Walnut Way | SL8 5DW |
| Wellington Cottages | SL8 5HU |
| West Ridge | SL8 5BU |
| Wharf Lane | SL8 5RP SL8 5RS SL8 5RU |
| Willows Road | SL8 5HG |
| Woodbury Close | SL8 5HA |
| SL8 5JW |
Transport near Bourne End-cum-hedsor
- FAQ
- Price Paid By Year
- Property Type Price
Frequently asked questions about Bourne End-cum-hedsor
What is the average price for a property for sale in Bourne End-cum-hedsor?
The average price for a property for sale in Bourne End-cum-hedsor is £640,327. This amount is 6% lower than the average price in Bourne End. There are 489 property listings for sale in Bourne End-cum-hedsor.
What streets have the most expensive properties for sale in Bourne End-cum-hedsor?
The streets with the most expensive properties for sale in Bourne End-cum-hedsor are Riversdale at an average of £2,262,500, Oakfield Road at an average of £1,372,500 and Hawks Hill at an average of £1,335,000.
What streets have the most affordable properties for sale in Bourne End-cum-hedsor?
The streets with the most affordable properties for sale in Bourne End-cum-hedsor are Bridgestone Drive at an average of £272,090, The Maples at an average of £290,000 and Thamesbourne Mews at an average of £308,750.
Which train stations are available in or near Bourne End-cum-hedsor?
Some of the train stations available in or near Bourne End-cum-hedsor are Bourne End, Cookham and Marlow.
Property Price Paid in Bourne End-cum-hedsor by Year
The average sold property price by year was:
| Year | Average Sold Price | Price Change |
Sold Properties
|
|---|---|---|---|
| 2025 | £607,084 | -2% |
92 Properties |
| 2024 | £617,385 | -17% |
70 Properties |
| 2023 | £719,383 | 15% |
59 Properties |
| 2022 | £614,543 | -15% |
114 Properties |
| 2021 | £708,129 | 15% |
128 Properties |
| 2020 | £603,357 | 5% |
90 Properties |
| 2019 | £575,738 | -4% |
97 Properties |
| 2018 | £601,499 | 6% |
85 Properties |
| 2017 | £566,843 | 3% |
74 Properties |
| 2016 | £549,927 | 3% |
99 Properties |
| 2015 | £532,354 | 8% |
102 Properties |
| 2014 | £490,044 | -1% |
104 Properties |
| 2013 | £495,958 | 17% |
98 Properties |
| 2012 | £411,859 | 2% |
77 Properties |
| 2011 | £405,643 | -10% |
69 Properties |
| 2010 | £445,185 | 24% |
84 Properties |
| 2009 | £337,548 | -11% |
74 Properties |
| 2008 | £373,393 | -15% |
56 Properties |
| 2007 | £429,246 | 21% |
105 Properties |
| 2006 | £337,219 | -9% |
129 Properties |
| 2005 | £368,862 | 24% |
103 Properties |
| 2004 | £278,814 | 4% |
114 Properties |
| 2003 | £267,017 | 0,5% |
105 Properties |
| 2002 | £265,814 | 20% |
142 Properties |
| 2001 | £213,878 | 1% |
162 Properties |
| 2000 | £212,255 | 27% |
126 Properties |
| 1999 | £153,938 | -2% |
160 Properties |
| 1998 | £156,344 | 17% |
134 Properties |
| 1997 | £129,615 | 3% |
143 Properties |
| 1996 | £125,413 | 12% |
146 Properties |
| 1995 | £110,338 | - |
131 Properties |
Property Price per Property Type in Bourne End-cum-hedsor
Here you can find historic sold price data in order to help with your property search.
The average Property Paid Price for specific property types in the last three years are:
| Property Type | Average Sold Price | Sold Properties |
|---|---|---|
| Flat | £368,405.00 | 39 Flats |
| Semi Detached House | £567,349.00 | 74 Semi Detached Houses |
| Detached House | £971,039.00 | 67 Detached Houses |
| Terraced House | £490,270.00 | 41 Terraced Houses |

