
Houses for sale & to rent in SL8 5AW, Rothsay Villas, Bourne End-cum-hedsor, Bourne End
House Prices in SL8 5AW, Rothsay Villas, Bourne End-cum-hedsor
Properties in SL8 5AW have no sales history available within the last 3 years. SL8 5AW is a postcode in Rothsay Villas located in Bourne End-cum-hedsor, an area in Bourne End, Buckinghamshire, with 2 households².
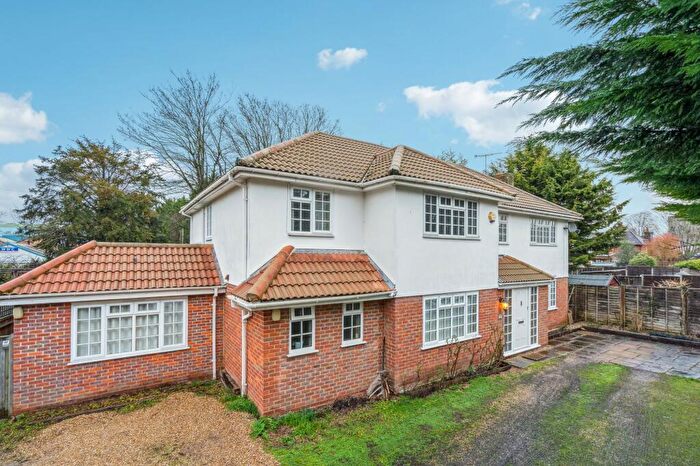
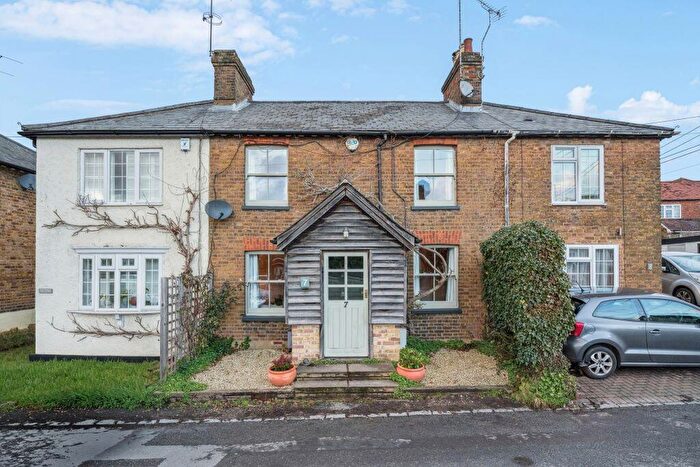
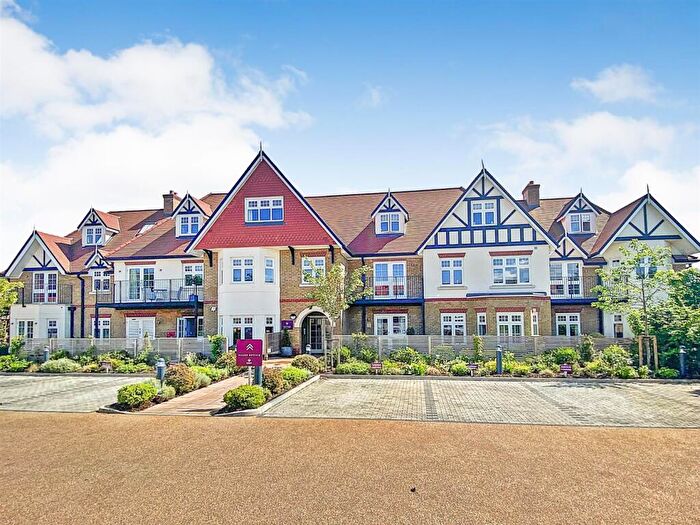
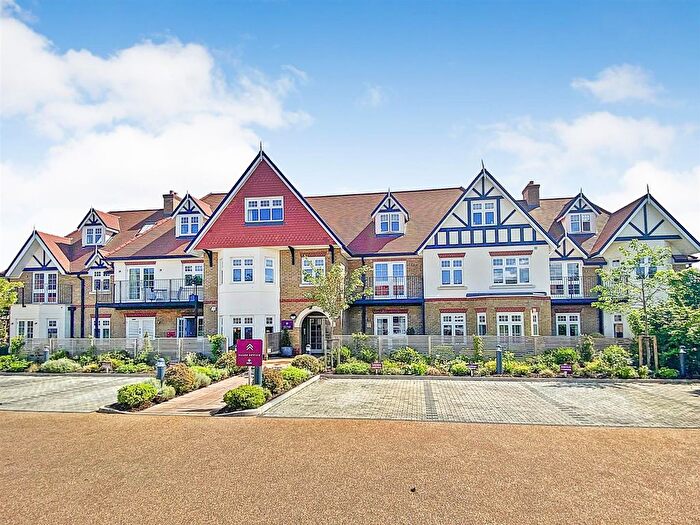
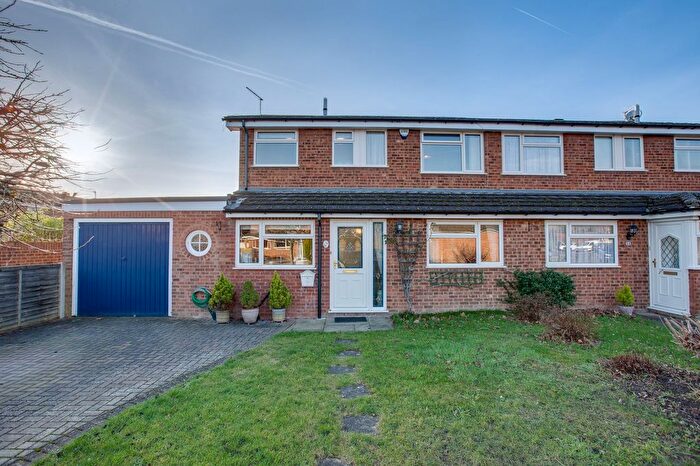
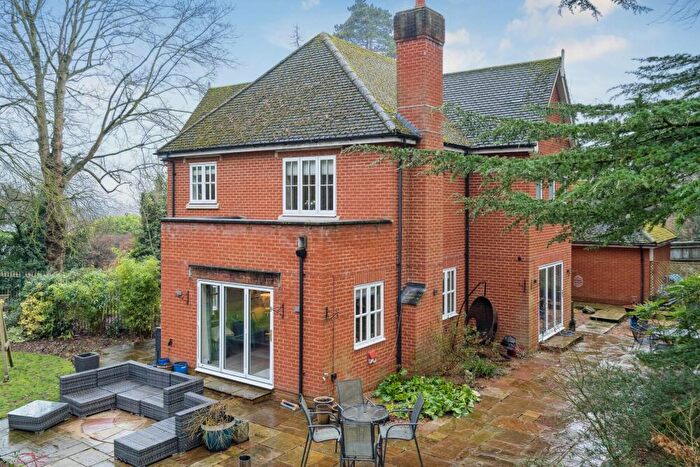
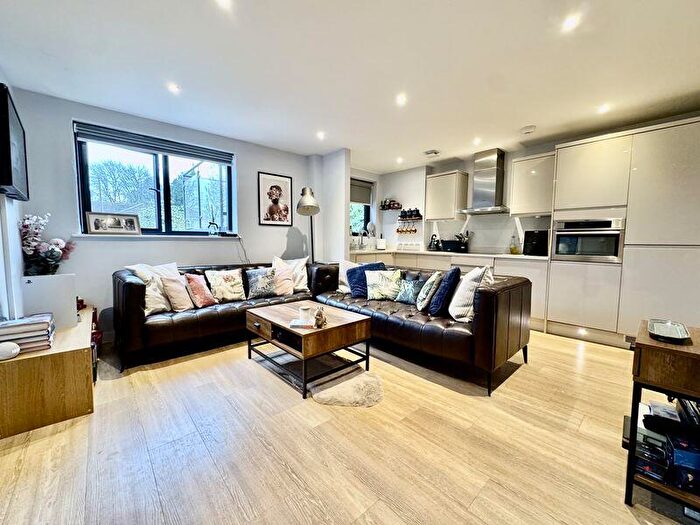
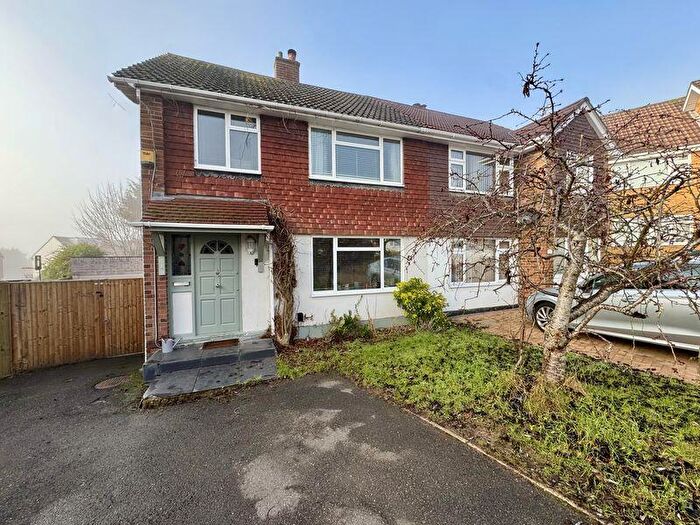
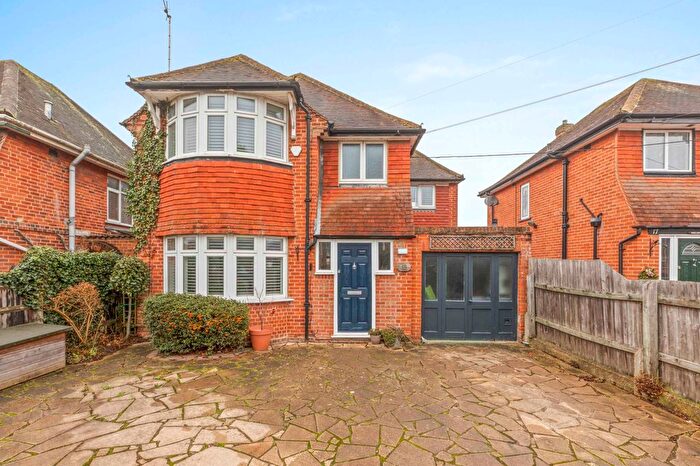
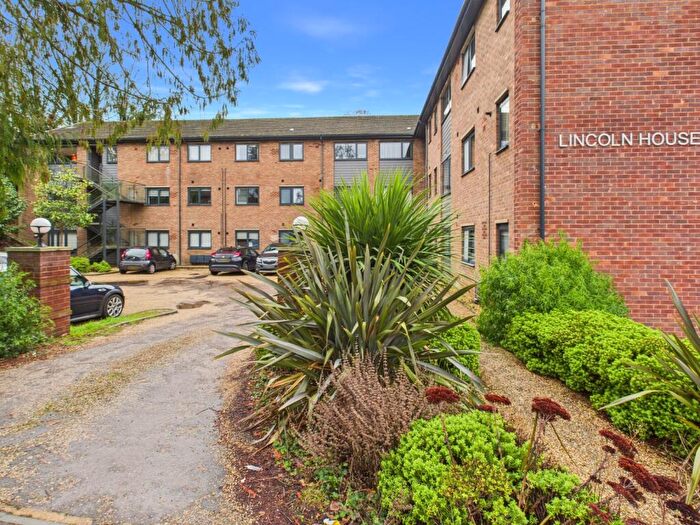
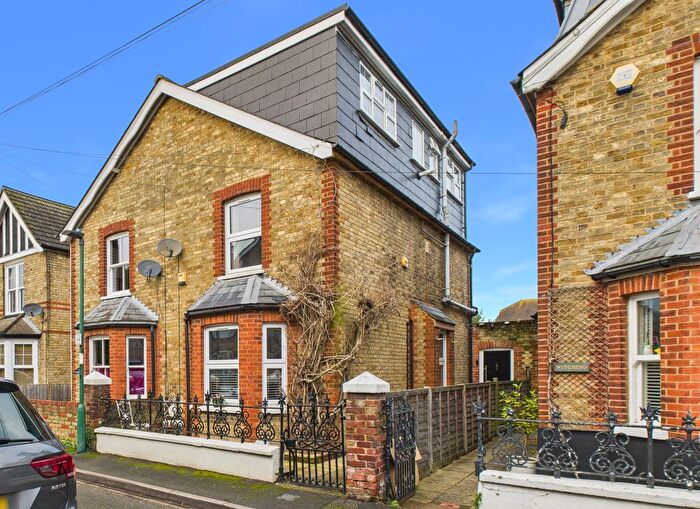
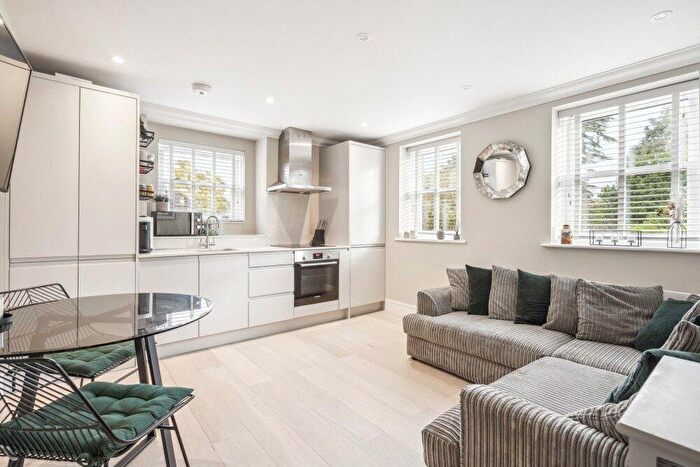
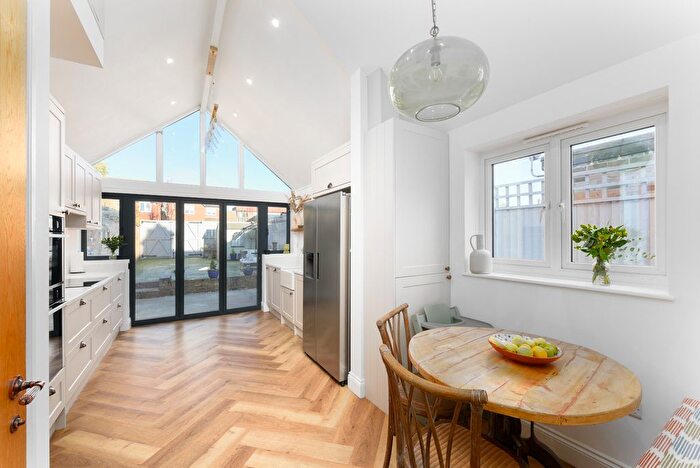
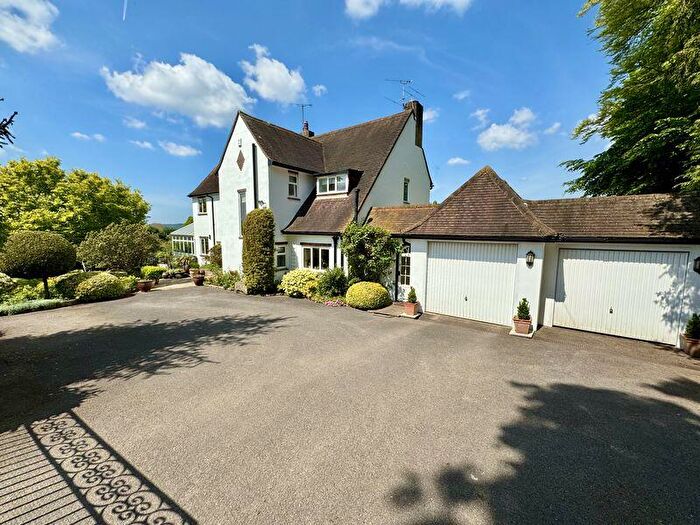
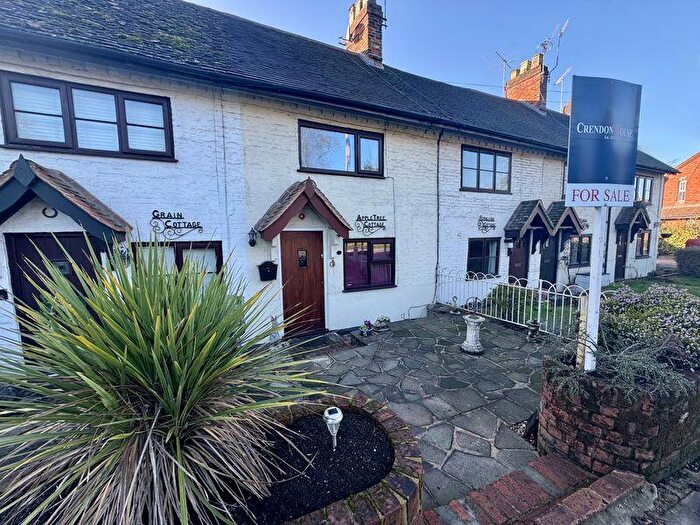
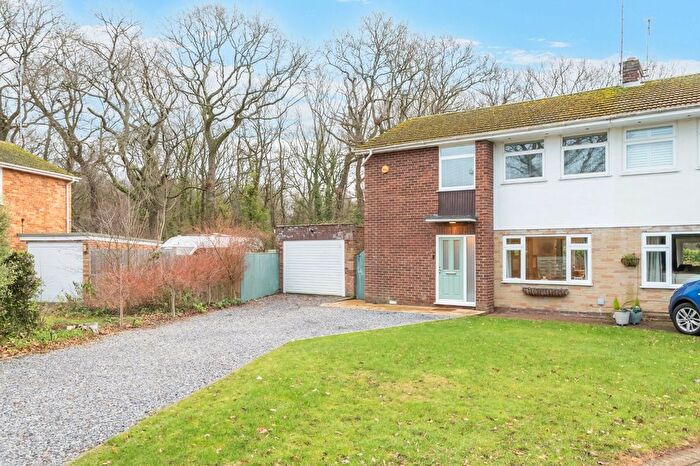
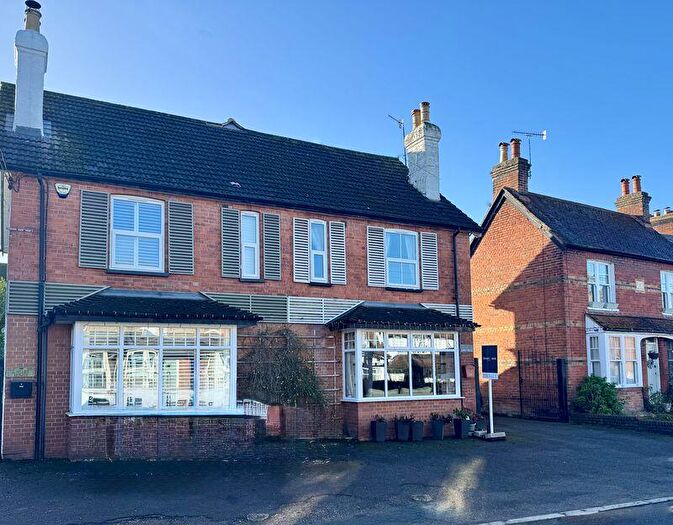
Properties for sale near SL8 5AW, Rothsay Villas

![]()
If you are looking to sell your house, let it out, or receive a property valuation, an expert can help you.
Click the button below to get started.

Price Paid in Rothsay Villas, SL8 5AW, Bourne End-cum-hedsor
2 Rothsay Villas, SL8 5AW, Bourne End-cum-hedsor Bourne End
Property 2 has been sold 3 times. The last time it was sold was in 01/06/2021 and the sold price was £595,000.00.
This semi detached house, sold as a freehold on 01/06/2021, is a 89 sqm semi-detached house with an EPC rating of E.
| Date | Price | Property Type | Tenure | Classification |
|---|---|---|---|---|
| 01/06/2021 | £595,000.00 | Semi Detached House | freehold | Established Building |
| 31/05/2012 | £320,000.00 | Semi Detached House | freehold | Established Building |
| 24/10/2008 | £210,000.00 | Semi Detached House | freehold | Established Building |
1 Rothsay Villas, SL8 5AW, Bourne End-cum-hedsor Bourne End
Property 1 has been sold 4 times. The last time it was sold was in 24/02/2017 and the sold price was £545,000.00.
This semi detached house, sold as a freehold on 24/02/2017, is a 107 sqm semi-detached house with an EPC rating of D.
| Date | Price | Property Type | Tenure | Classification |
|---|---|---|---|---|
| 24/02/2017 | £545,000.00 | Semi Detached House | freehold | Established Building |
| 24/06/2002 | £213,000.00 | Semi Detached House | freehold | Established Building |
| 08/07/1996 | £100,000.00 | Semi Detached House | freehold | Established Building |
| 04/01/1995 | £90,000.00 | Semi Detached House | freehold | Established Building |
Transport near SL8 5AW, Rothsay Villas

House price paid reports for SL8 5AW, Rothsay Villas
Click on the buttons below to see price paid reports by year or property price:
- Price Paid By Year
Property Price Paid in SL8 5AW, Rothsay Villas by Year
The average sold property price by year was:
| Year | Average Sold Price | Price Change |
Sold Properties
|
|---|---|---|---|
| 2021 | £595,000 | 8% |
1 Property |
| 2017 | £545,000 | 41% |
1 Property |
| 2012 | £320,000 | 34% |
1 Property |
| 2008 | £210,000 | -1% |
1 Property |
| 2002 | £213,000 | 53% |
1 Property |
| 1996 | £100,000 | 10% |
1 Property |
| 1995 | £90,000 | - |
1 Property |