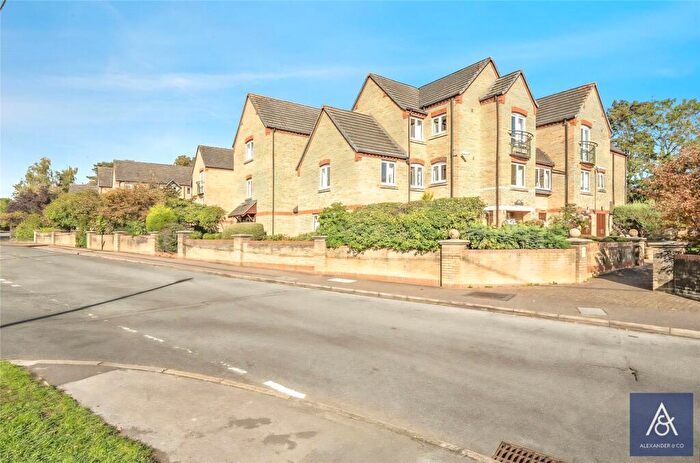
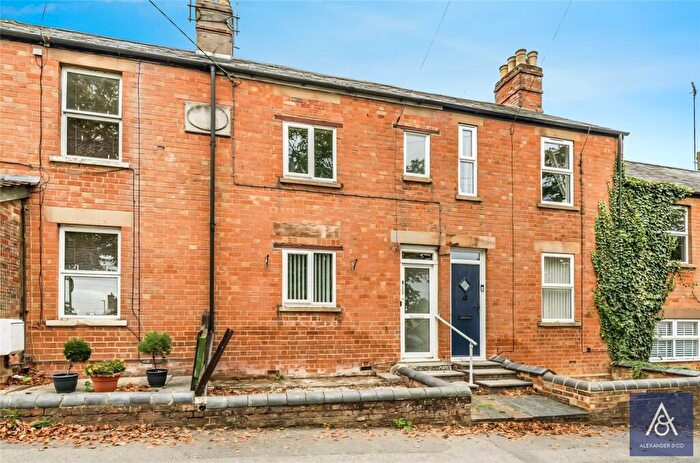
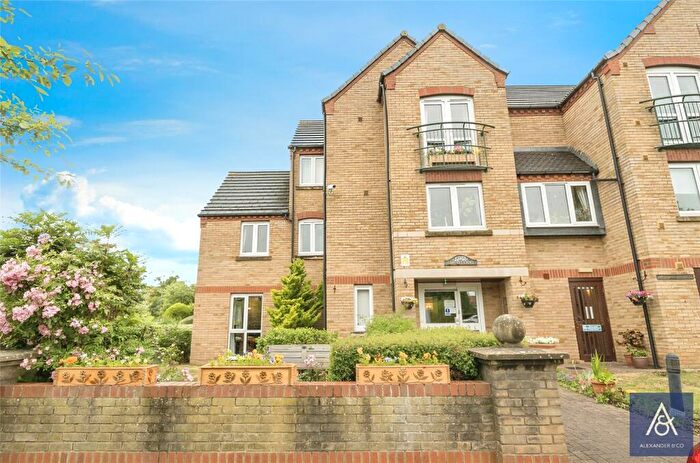
Houses for sale & to rent in Tingewick, Brackley
House Prices in Tingewick
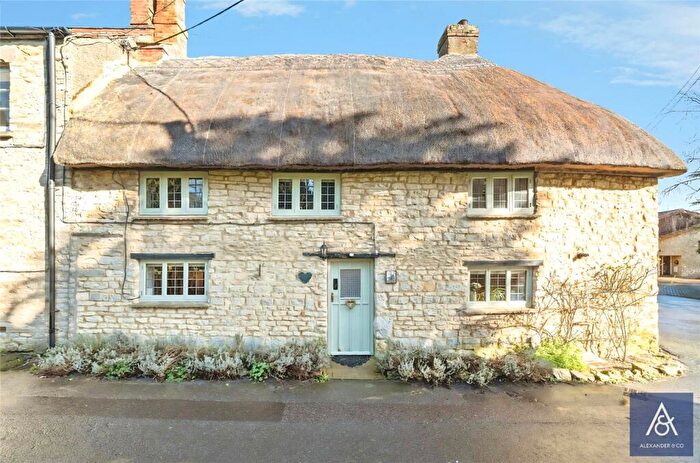
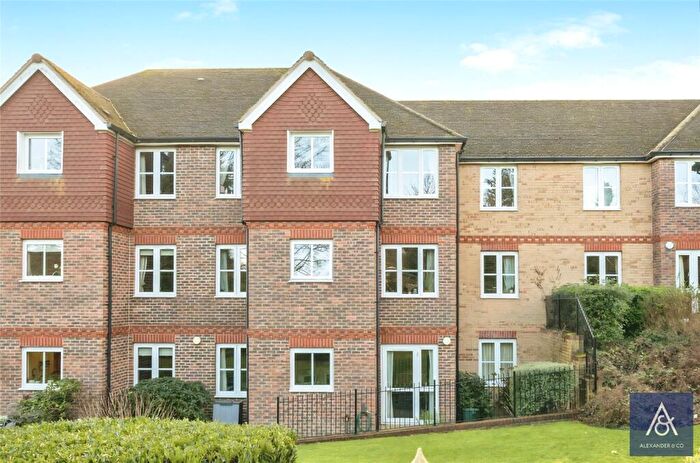
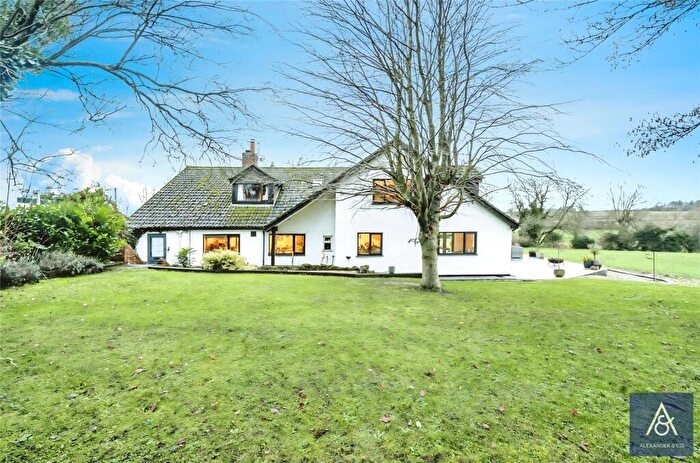
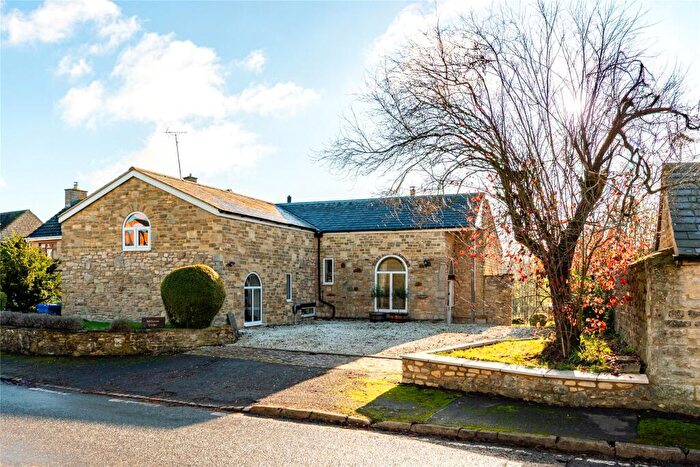
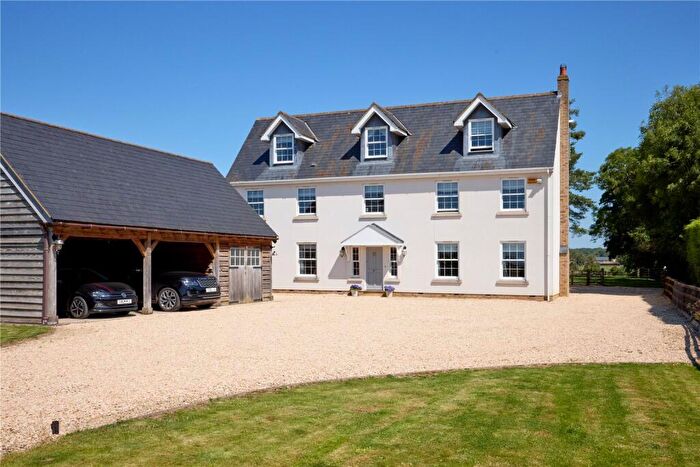
Properties in Tingewick have an average house price of £493,500.00 and had 26 Property Transactions within the last 3 years¹.
Tingewick is an area in Brackley, Buckinghamshire with 277 households², where the most expensive property was sold for £1,290,000.00.
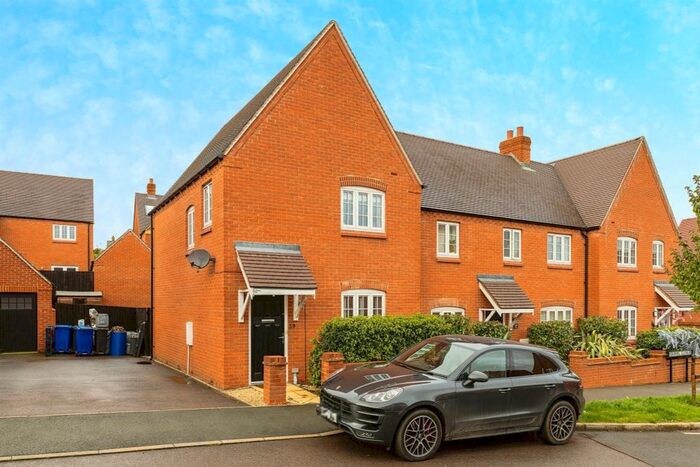
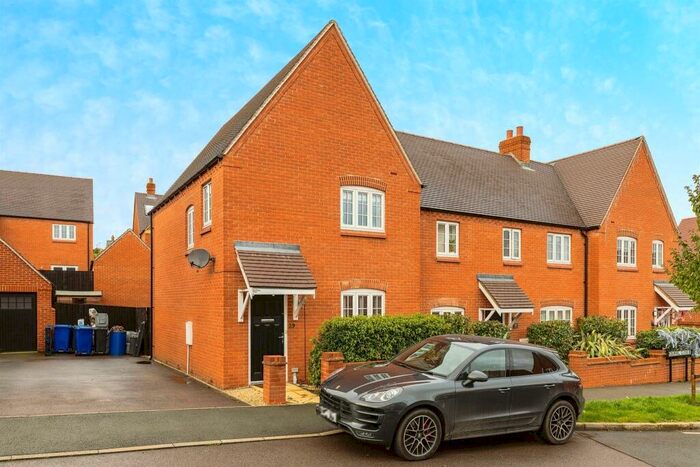
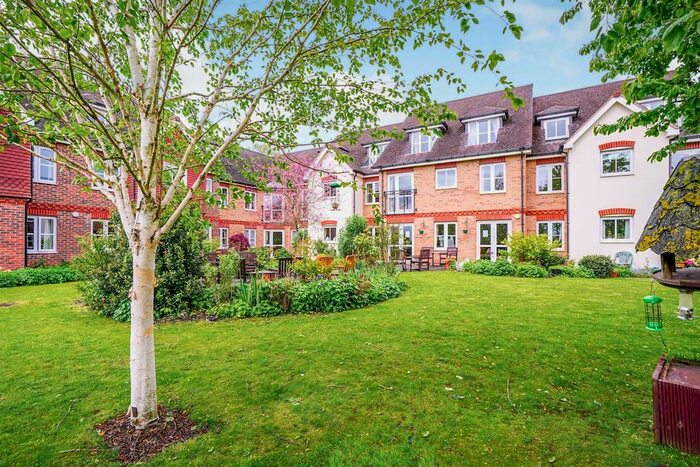
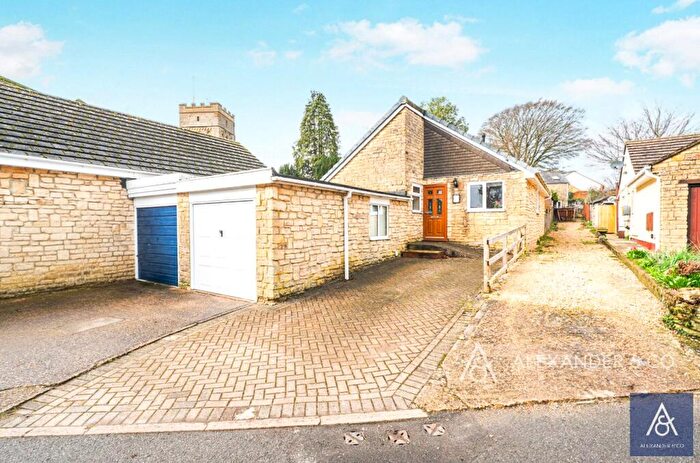
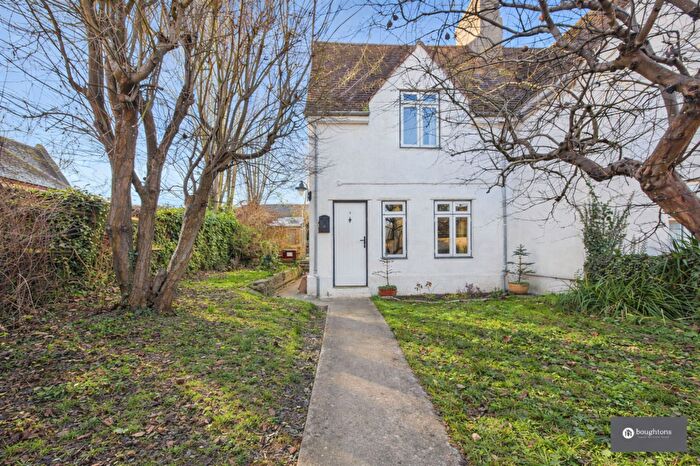
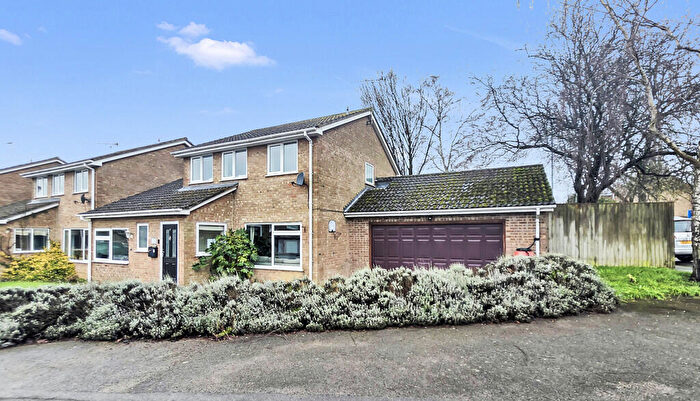
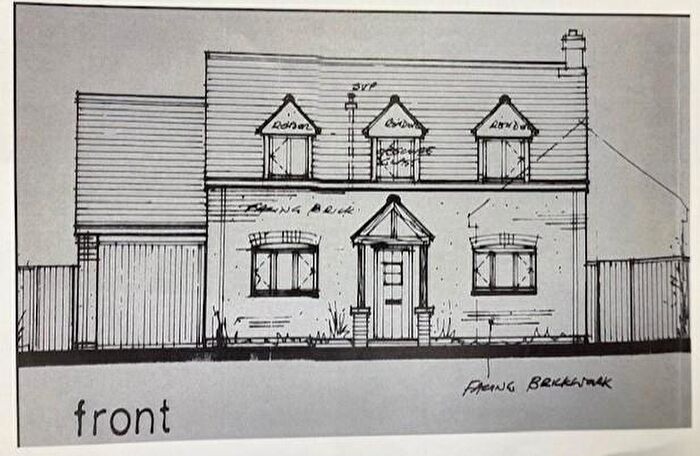
Properties for sale in Tingewick
Roads and Postcodes in Tingewick
Navigate through our locations to find the location of your next house in Tingewick, Brackley for sale or to rent.
| Streets | Postcodes |
|---|---|
| Biddlesden Road | NN13 5JL |
| Brackley Road | NN13 5JN |
| Buckingham Road | NN13 5JP NN13 5JW |
| Chapel Lane | NN13 5JA |
| Follet Close | NN13 5JB |
| Fulwell Farm Cottages | NN13 5JZ |
| Fulwell Road | NN13 5JQ NN13 5PR |
| Grainge Close | NN13 5YA |
| Main Street | NN13 5JR NN13 5JU |
| Mill Lane | NN13 5JS NN13 5LE |
| Orchard Place | NN13 5JT |
| Playing Field Road | NN13 5LA |
| School Close | NN13 5GW |
| Scotts Corner | NN13 5UY |
| South Bank | NN13 5JD |
| The Cottages | NN13 5TR |
| The Green | NN13 5JG |
| NN13 5JF NN13 5JX NN13 5TD NN13 5TT |
Transport near Tingewick
- FAQ
- Price Paid By Year
- Property Type Price
Frequently asked questions about Tingewick
What is the average price for a property for sale in Tingewick?
The average price for a property for sale in Tingewick is £493,500. This amount is 5% higher than the average price in Brackley. There are 268 property listings for sale in Tingewick.
What streets have the most expensive properties for sale in Tingewick?
The streets with the most expensive properties for sale in Tingewick are Main Street at an average of £799,642, Scotts Corner at an average of £541,250 and Buckingham Road at an average of £488,750.
What streets have the most affordable properties for sale in Tingewick?
The streets with the most affordable properties for sale in Tingewick are Mill Lane at an average of £211,916, Brackley Road at an average of £330,000 and Biddlesden Road at an average of £353,500.
Which train stations are available in or near Tingewick?
Some of the train stations available in or near Tingewick are King's Sutton, Bicester North and Bicester Village.
Property Price Paid in Tingewick by Year
The average sold property price by year was:
| Year | Average Sold Price | Price Change |
Sold Properties
|
|---|---|---|---|
| 2025 | £464,875 | 1% |
12 Properties |
| 2024 | £460,000 | -22% |
6 Properties |
| 2023 | £561,562 | 26% |
8 Properties |
| 2022 | £415,062 | 1% |
8 Properties |
| 2021 | £412,608 | 27% |
23 Properties |
| 2020 | £299,368 | -47% |
8 Properties |
| 2019 | £441,227 | -5% |
11 Properties |
| 2018 | £464,346 | 42% |
13 Properties |
| 2017 | £268,187 | -57% |
8 Properties |
| 2016 | £420,050 | 12% |
10 Properties |
| 2015 | £371,454 | 10% |
11 Properties |
| 2014 | £334,000 | 27% |
12 Properties |
| 2013 | £243,912 | -25% |
9 Properties |
| 2012 | £305,416 | -73% |
6 Properties |
| 2011 | £528,666 | 63% |
3 Properties |
| 2010 | £198,000 | -56% |
2 Properties |
| 2009 | £309,418 | -2% |
16 Properties |
| 2008 | £314,254 | -0,3% |
21 Properties |
| 2007 | £315,175 | -54% |
14 Properties |
| 2006 | £484,903 | 45% |
13 Properties |
| 2005 | £266,846 | 6% |
13 Properties |
| 2004 | £249,805 | 13% |
18 Properties |
| 2003 | £217,636 | -22% |
11 Properties |
| 2002 | £265,777 | -36% |
9 Properties |
| 2001 | £361,708 | 53% |
12 Properties |
| 2000 | £168,493 | -158% |
8 Properties |
| 1999 | £434,761 | 72% |
8 Properties |
| 1998 | £123,500 | -17% |
10 Properties |
| 1997 | £145,100 | -22% |
10 Properties |
| 1996 | £176,583 | 28% |
6 Properties |
| 1995 | £127,811 | - |
9 Properties |
Property Price per Property Type in Tingewick
Here you can find historic sold price data in order to help with your property search.
The average Property Paid Price for specific property types in the last three years are:
| Property Type | Average Sold Price | Sold Properties |
|---|---|---|
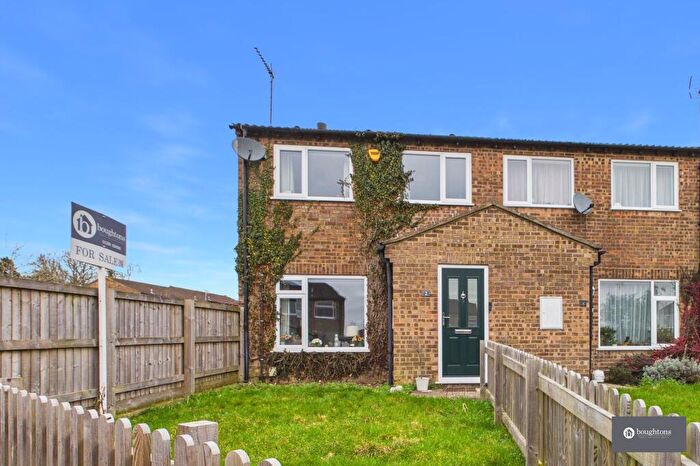
| Semi Detached House | £467,833.00 | 6 Semi Detached Houses |
| Terraced House | £456,250.00 | 4 Terraced Houses |
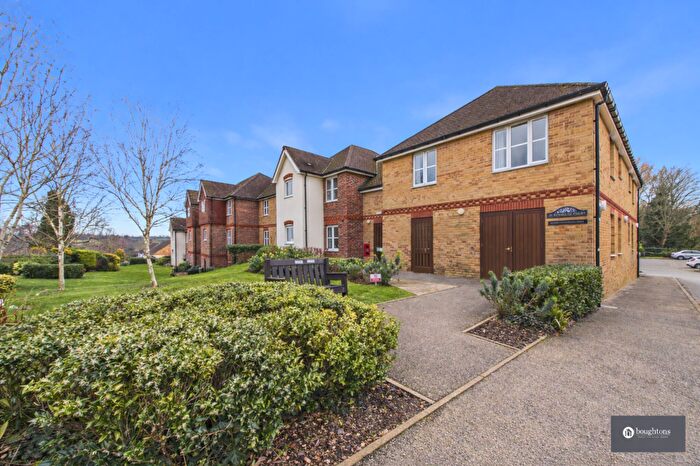
| Flat | £211,916.00 | 6 Flats |
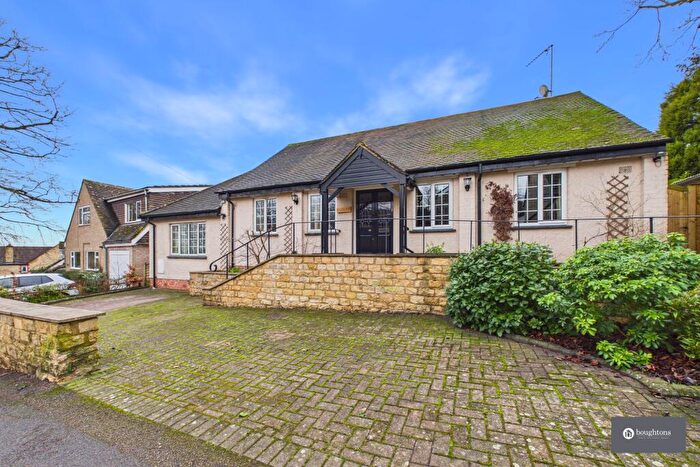
| Detached House | £692,750.00 | 10 Detached Houses |

