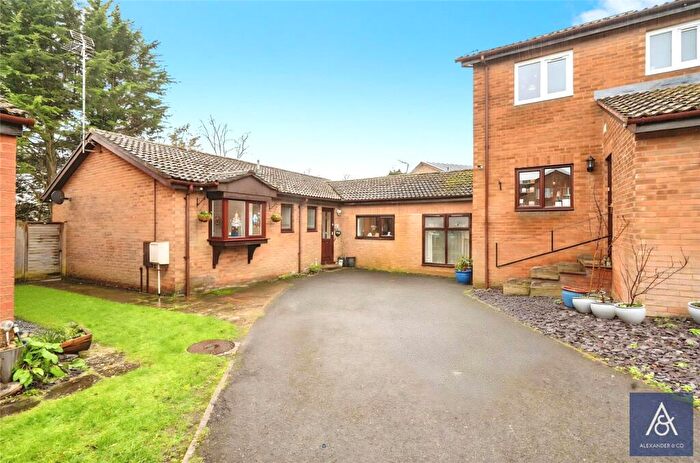
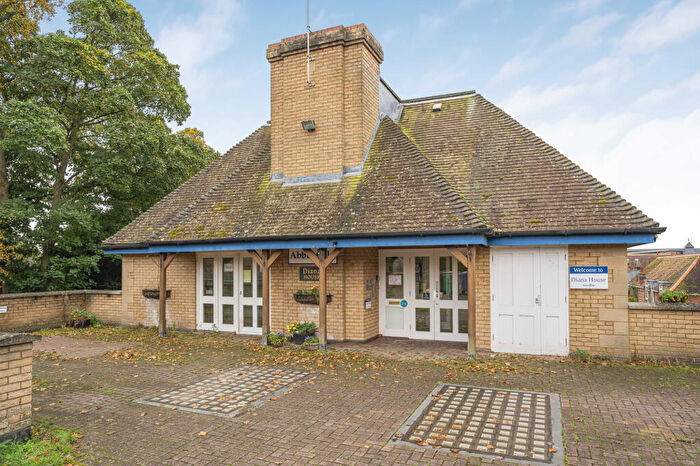
Houses for sale & to rent in Brackley West, Brackley
House Prices in Brackley West
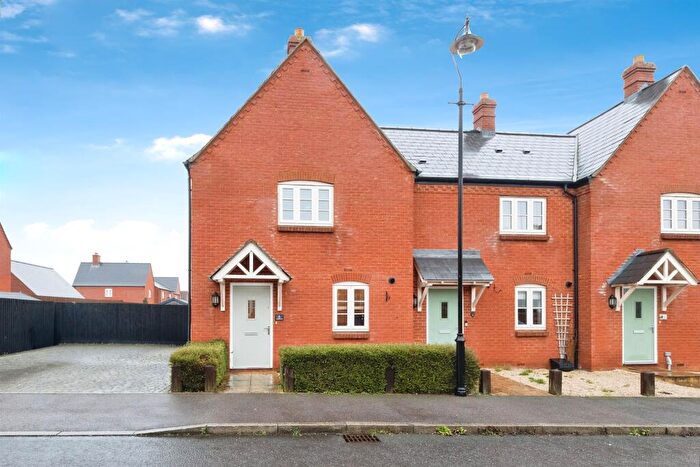
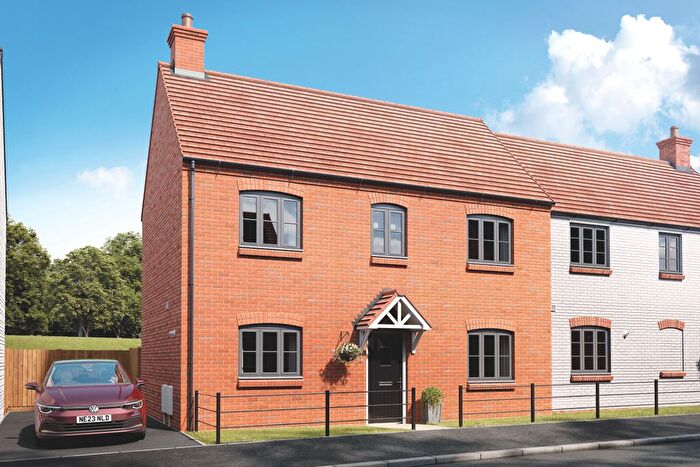
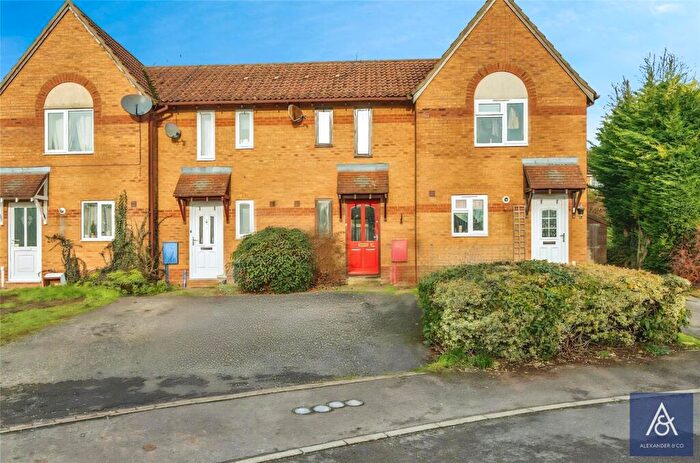
Properties in Brackley West have an average house price of £365,544.00 and had 174 Property Transactions within the last 3 years¹.
Brackley West is an area in Brackley, Northamptonshire with 1,708 households², where the most expensive property was sold for £705,000.00.
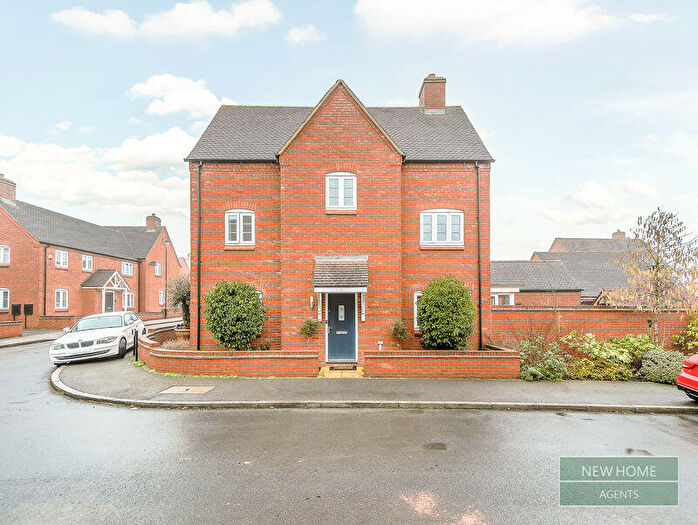
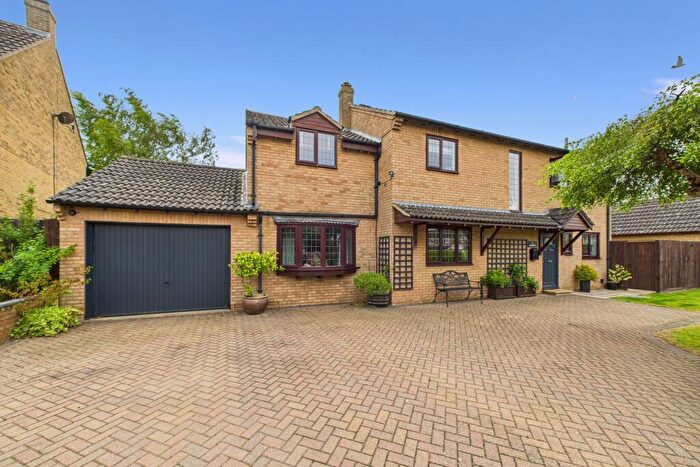
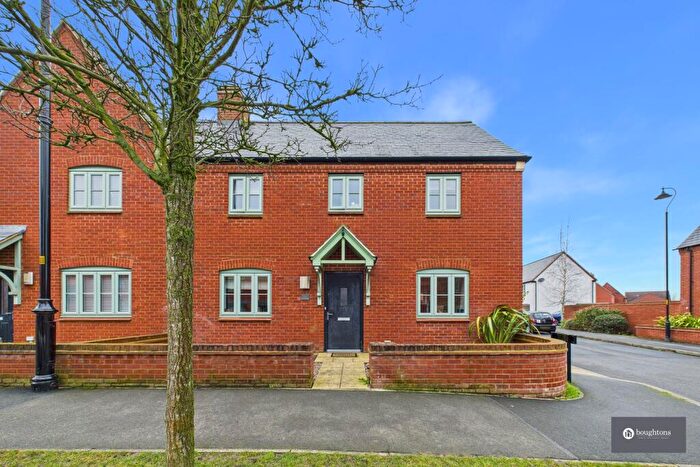
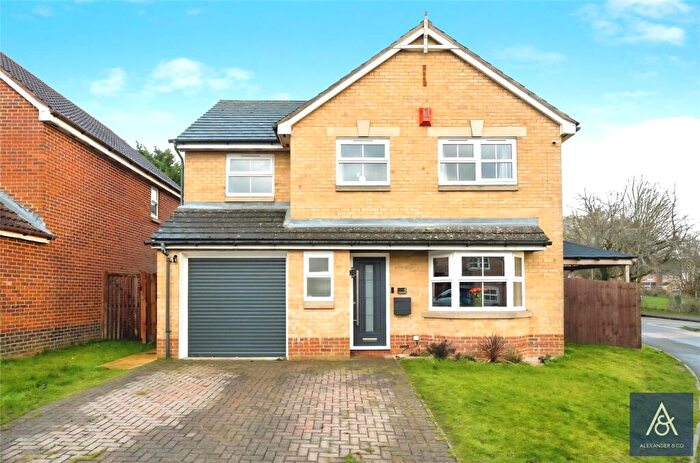
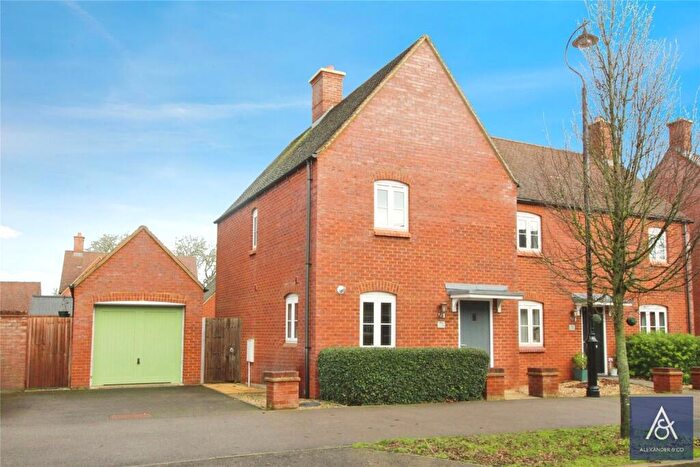
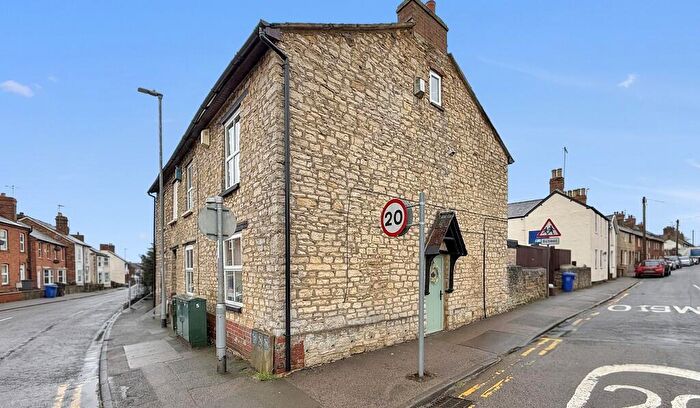
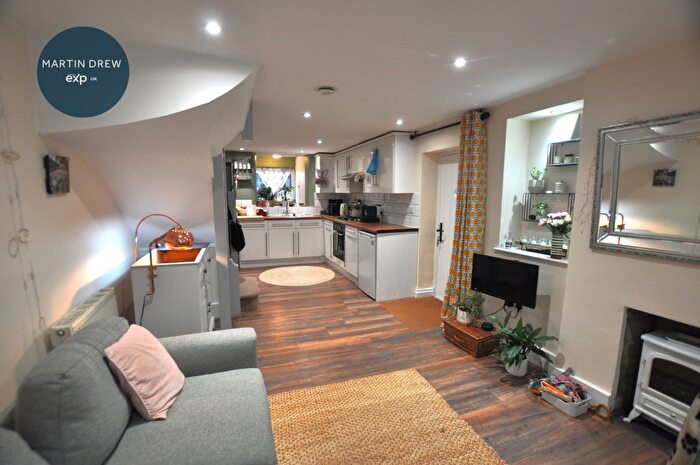
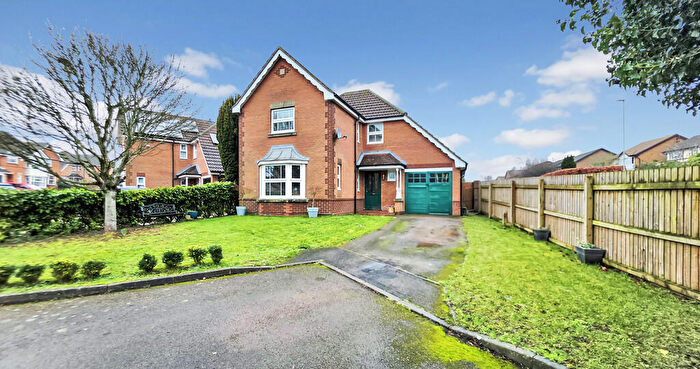
Properties for sale in Brackley West
Roads and Postcodes in Brackley West
Navigate through our locations to find the location of your next house in Brackley West, Brackley for sale or to rent.
| Streets | Postcodes |
|---|---|
| Ashwin Close | NN13 6LZ |
| Avenue Bernard | NN13 6LN |
| Balliol Road | NN13 6LY |
| Bayard Brow | NN13 6LQ |
| Bishops Close | NN13 6NA |
| Blackbird Close | NN13 6PT |
| Boltons Close | NN13 6ND |
| Brasenose Drive | NN13 6NT |
| Brewin Close | NN13 6NX |
| Candleford Close | NN13 6JZ NN13 6JW |
| Chaffinch Way | NN13 6PS |
| Champion Court | NN13 6LU |
| Clement Bois | NN13 6LH |
| Daniaud Court | NN13 6LP |
| De Montfort Court | NN13 6LJ |
| De Quincey Close | NN13 6LG |
| Dumas Cul De Sac | NN13 6LL |
| Eynard Impasse | NN13 6LB |
| Falcon Way | NN13 6PZ |
| Farmers Drive | NN13 6HY |
| Faugere Close | NN13 6LR |
| Flora Thompson Drive | NN13 6NG |
| Ford Drive | NN13 6BD |
| Forrester Drive | NN13 6NE |
| Goldcrest Road | NN13 6QG |
| Halse Road | NN13 6FA |
| Harris Close | NN13 6NS |
| Hayman Road | NN13 6JA |
| Heron Drive | NN13 6QE |
| Holdgate Close | NN13 6NF |
| Humphries Drive | NN13 6NP NN13 6NQ NN13 6NW NN13 6PR NN13 6PW NN13 6QF |
| Johnson Avenue | NN13 6JE NN13 6JF |
| Jones Close | NN13 6JD |
| Keble Road | NN13 6DS |
| Kestrel Crescent | NN13 6PX |
| Kingfisher Road | NN13 6PP |
| Lark Rise | NN13 6JR |
| Lathbury Road | NN13 6HW |
| Magdalen Meadows | NN13 6LF |
| Martial Daire Boulevard | NN13 6LD NN13 6LS NN13 6LX |
| Merton Close | NN13 6DQ |
| Newbery Drive | NN13 6NN |
| Nightingale Close | NN13 6PN |
| Nuffield Close | NN13 6PL |
| Oriel Way | NN13 6DR |
| Pavillons Way | NN13 6LA NN13 6LW |
| Pether Avenue | NN13 6NJ |
| Prices Way | NN13 6NR |
| Robin Ride | NN13 6PU |
| Rose Drive | NN13 6NU |
| Saimon Close | NN13 6LT |
| Smarts Close | NN13 6NL |
| Somerville Road | NN13 6NY NN13 6NZ |
| Soudan Avenue | NN13 6LE |
| Spiers Drive | NN13 6JB |
| Springfield Way | NN13 6JJ |
| St Annes Close | NN13 6DT |
| Swallow Close | NN13 6PQ |
| Swan Close | NN13 6QD |
| Swift Way | NN13 6PY |
| Wodhams Drive | NN13 6NB |
| Woodpecker Close | NN13 6QH |
| Wren Close | NN13 6QJ |
Transport near Brackley West
- FAQ
- Price Paid By Year
- Property Type Price
Frequently asked questions about Brackley West
What is the average price for a property for sale in Brackley West?
The average price for a property for sale in Brackley West is £365,544. This amount is 2% lower than the average price in Brackley. There are 725 property listings for sale in Brackley West.
What streets have the most expensive properties for sale in Brackley West?
The streets with the most expensive properties for sale in Brackley West are Falcon Way at an average of £560,000, Flora Thompson Drive at an average of £508,333 and Keble Road at an average of £491,250.
What streets have the most affordable properties for sale in Brackley West?
The streets with the most affordable properties for sale in Brackley West are Ford Drive at an average of £202,250, Johnson Avenue at an average of £239,000 and Dumas Cul De Sac at an average of £265,000.
Which train stations are available in or near Brackley West?
Some of the train stations available in or near Brackley West are King's Sutton, Banbury and Bicester North.
Property Price Paid in Brackley West by Year
The average sold property price by year was:
| Year | Average Sold Price | Price Change |
Sold Properties
|
|---|---|---|---|
| 2025 | £364,242 | -2% |
68 Properties |
| 2024 | £371,258 | 3% |
61 Properties |
| 2023 | £359,766 | 0,1% |
45 Properties |
| 2022 | £359,429 | 11% |
74 Properties |
| 2021 | £319,716 | 7% |
85 Properties |
| 2020 | £296,746 | -3% |
65 Properties |
| 2019 | £306,412 | 4% |
72 Properties |
| 2018 | £293,306 | -1% |
68 Properties |
| 2017 | £295,278 | 6% |
83 Properties |
| 2016 | £277,509 | 1% |
95 Properties |
| 2015 | £273,994 | 12% |
87 Properties |
| 2014 | £239,922 | 6% |
101 Properties |
| 2013 | £226,711 | 10% |
70 Properties |
| 2012 | £204,024 | -5% |
63 Properties |
| 2011 | £213,936 | -4% |
61 Properties |
| 2010 | £222,351 | 11% |
82 Properties |
| 2009 | £198,874 | -3% |
86 Properties |
| 2008 | £205,601 | -9% |
49 Properties |
| 2007 | £224,131 | 6% |
119 Properties |
| 2006 | £210,949 | 8% |
147 Properties |
| 2005 | £193,475 | 6% |
128 Properties |
| 2004 | £181,335 | 2% |
158 Properties |
| 2003 | £177,318 | 13% |
172 Properties |
| 2002 | £154,283 | 15% |
197 Properties |
| 2001 | £131,530 | 1% |
262 Properties |
| 2000 | £130,101 | 23% |
257 Properties |
| 1999 | £99,785 | 9% |
328 Properties |
| 1998 | £91,024 | 11% |
296 Properties |
| 1997 | £81,022 | 16% |
252 Properties |
| 1996 | £68,337 | 2% |
234 Properties |
| 1995 | £67,145 | - |
156 Properties |
Property Price per Property Type in Brackley West
Here you can find historic sold price data in order to help with your property search.
The average Property Paid Price for specific property types in the last three years are:
| Property Type | Average Sold Price | Sold Properties |
|---|---|---|
| Semi Detached House | £314,050.00 | 55 Semi Detached Houses |
| Detached House | £447,162.00 | 80 Detached Houses |
| Terraced House | £270,743.00 | 39 Terraced Houses |

