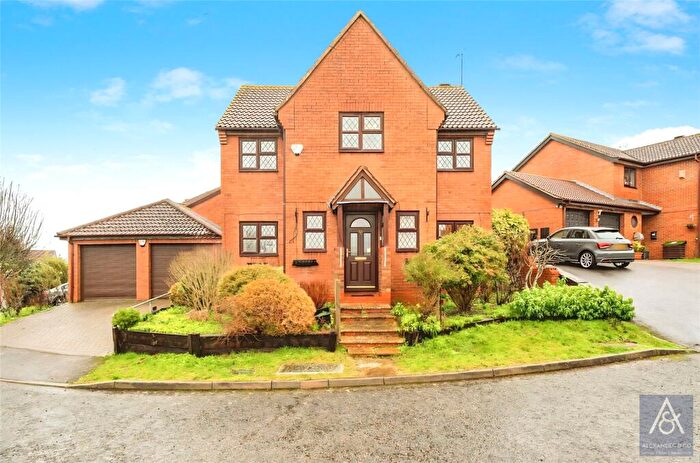
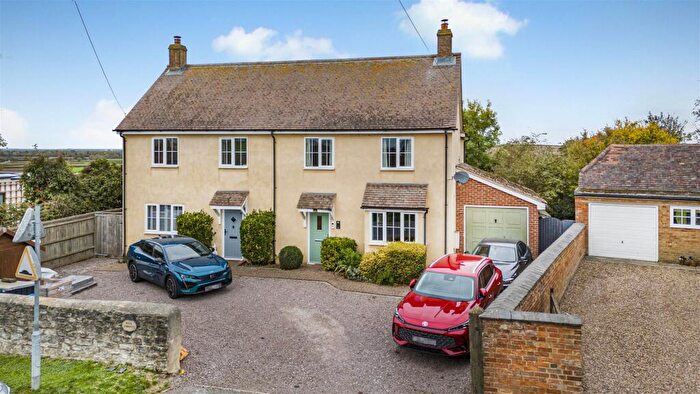
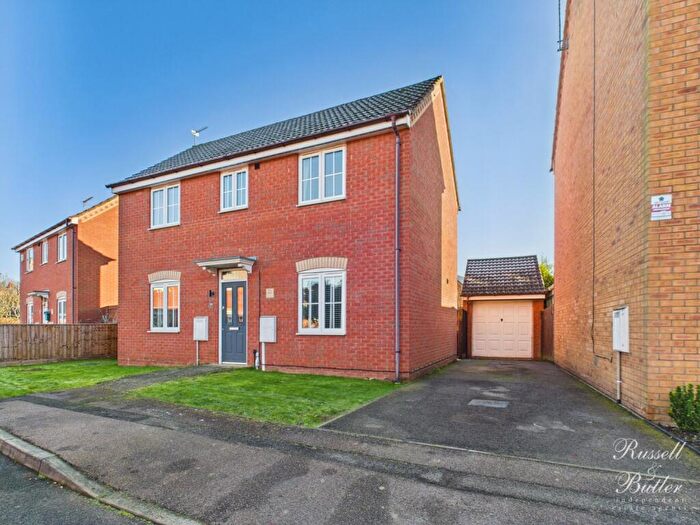
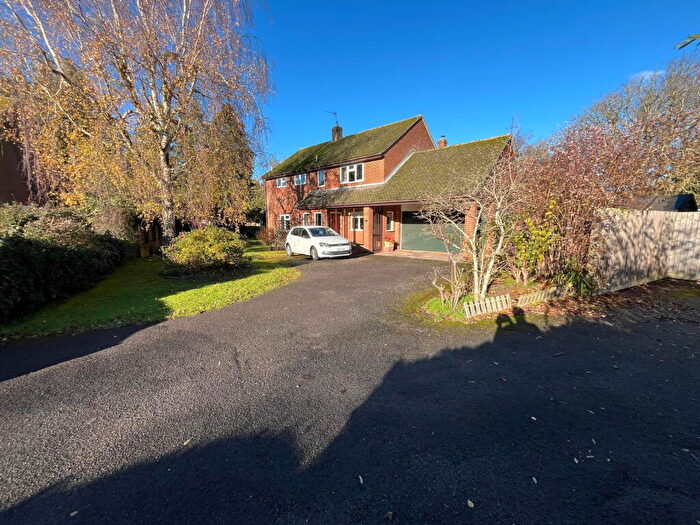
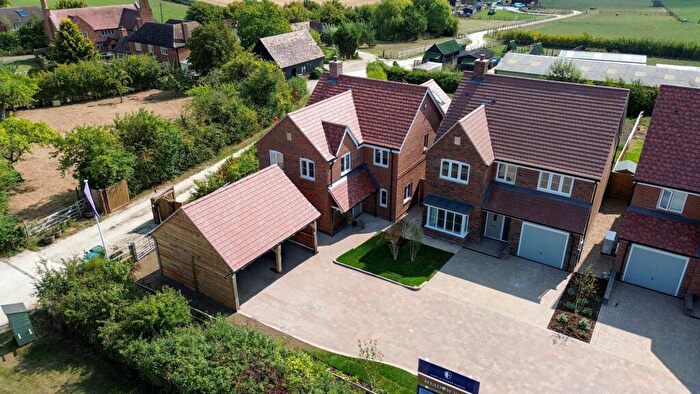
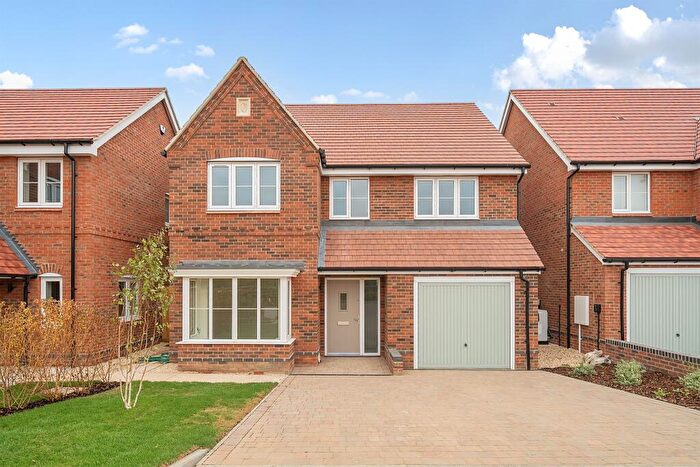
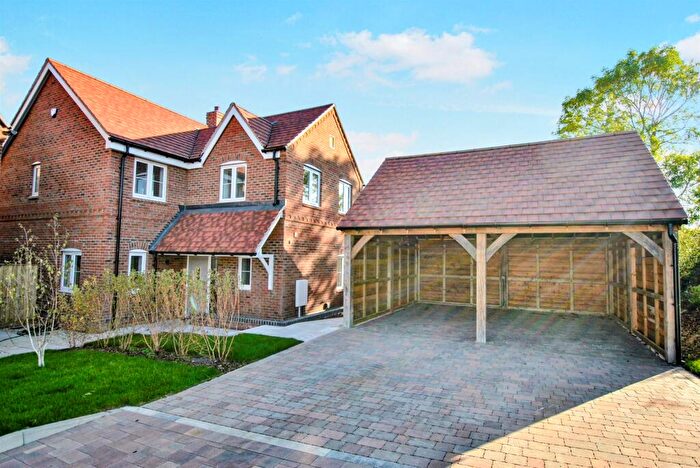
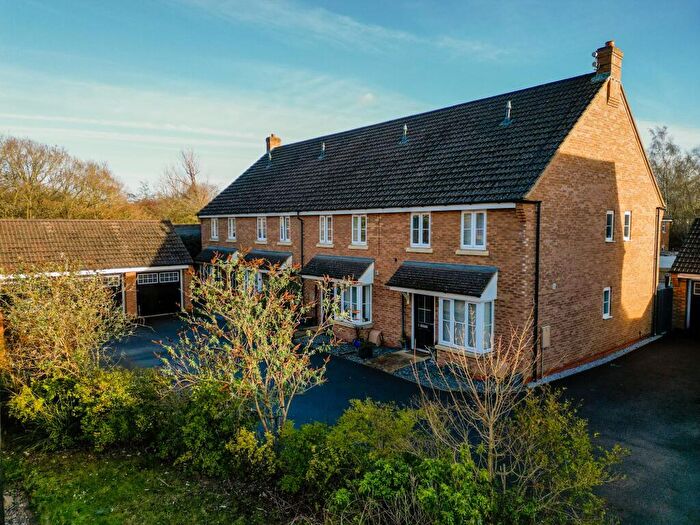
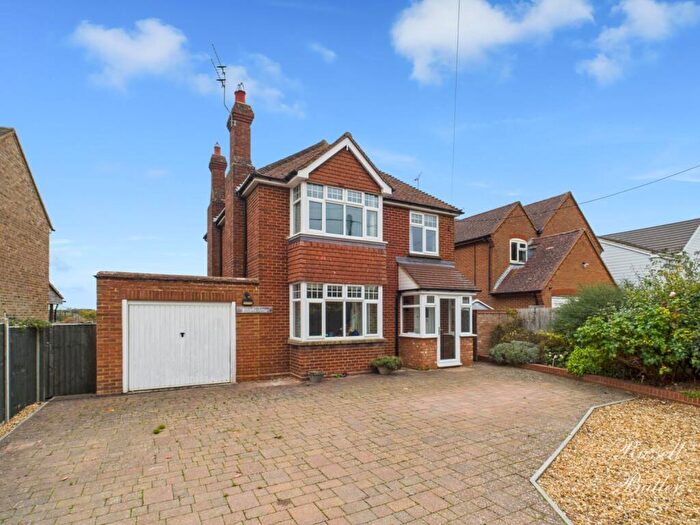
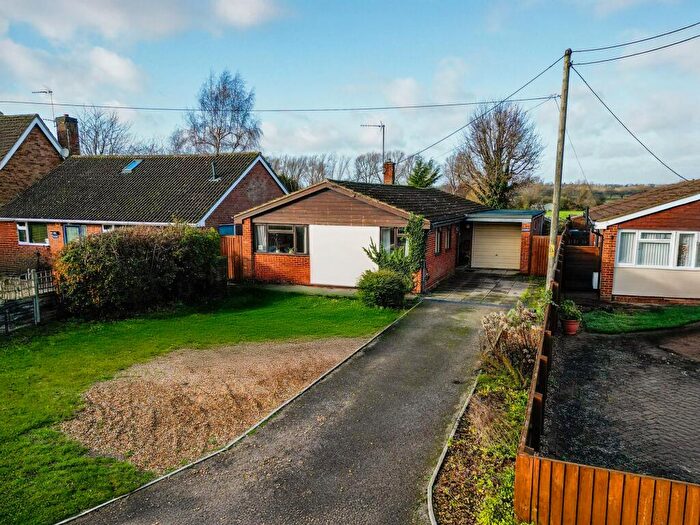
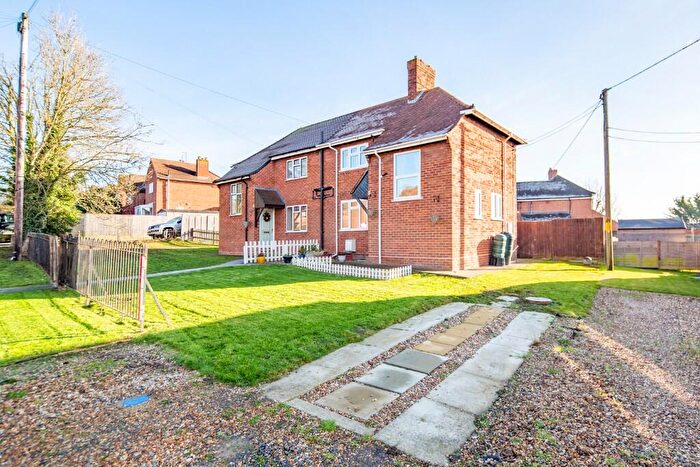
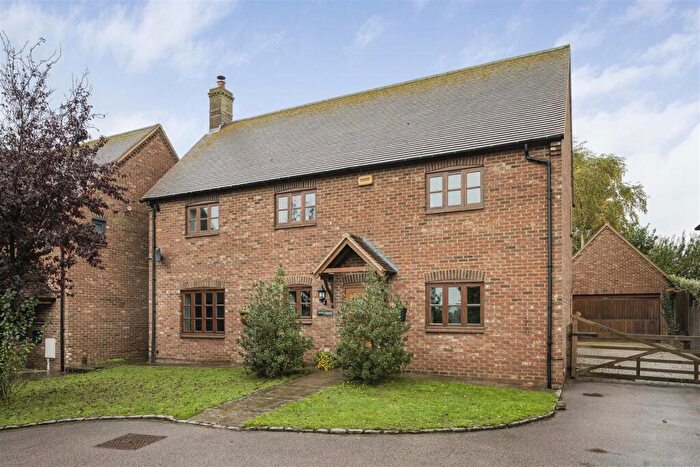
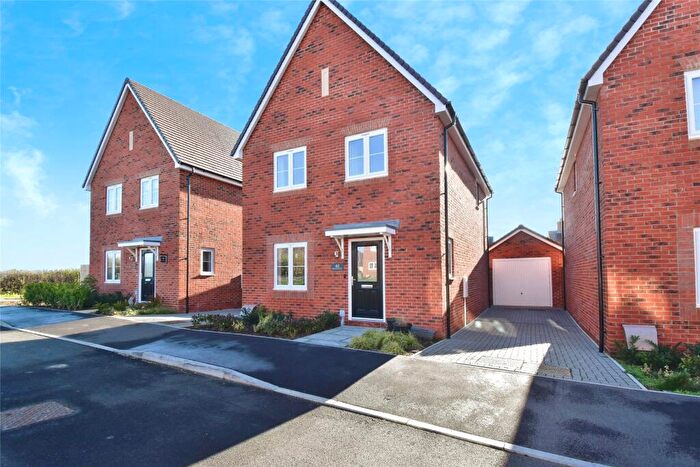
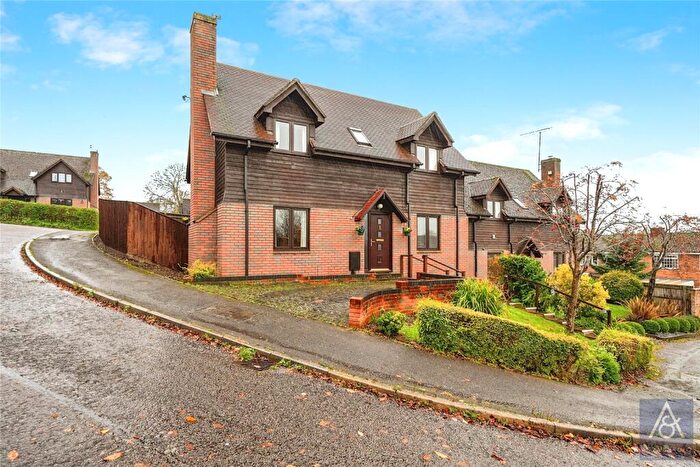
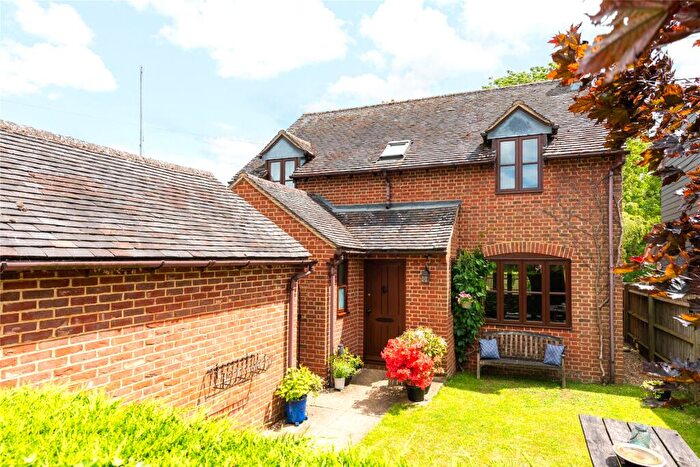
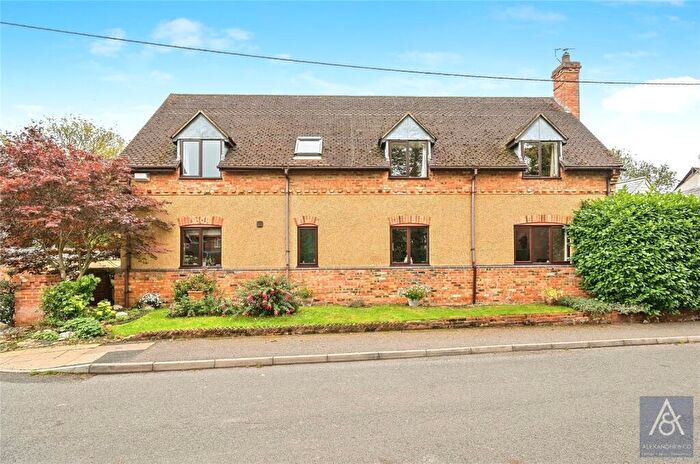
Houses for sale & to rent in Marsh Gibbon, Buckingham
House Prices in Marsh Gibbon
Properties in Marsh Gibbon have an average house price of £515,026.00 and had 56 Property Transactions within the last 3 years¹.
Marsh Gibbon is an area in Buckingham, Buckinghamshire with 701 households², where the most expensive property was sold for £1,600,000.00.
Properties for sale in Marsh Gibbon
Roads and Postcodes in Marsh Gibbon
Navigate through our locations to find the location of your next house in Marsh Gibbon, Buckingham for sale or to rent.
| Streets | Postcodes |
|---|---|
| Bicester Road | MK18 4EH MK18 4EJ MK18 4EL MK18 4EN MK18 4EW |
| Brickhill Way | MK18 2FS |
| Brindles Close | MK18 2FQ |
| Brook Farm Close | MK18 4FE |
| Church Street | MK18 4ES MK18 4ET MK18 4EU MK18 4EX |
| Clay Lane | MK18 2FB |
| Cotswolds Way | MK18 2FH MK18 2FJ MK18 2FL MK18 2FR |
| Fletton End | MK18 2GD |
| Grange Close | MK18 4HE |
| Grebe Close | MK18 2FZ |
| Heathers Close | MK18 2FP |
| Itter Lane | MK18 2GA |
| Kiln Close | MK18 2FD |
| Leys Lane | MK18 4LJ |
| Main Street | MK18 4EP MK18 4ER MK18 4LN MK18 4LU |
| Mill Lane | MK18 4EZ |
| North End | MK18 4JR |
| Orchard Cottages | MK18 4BZ |
| Orchard View | MK18 4DA |
| Portway Road | MK18 4EB MK18 4ED MK18 4EE |
| Pound Lane | MK18 4LG MK18 4LX |
| Red Kite View | MK18 2FX |
| Rosehill Crescent | MK18 4EF |
| Rustics Close | MK18 2FG |
| Sandstone Close | MK18 2FF |
| Sandy Road | MK18 2FW |
| School Lane | MK18 4EY MK18 4LS |
| South End | MK18 4LR |
| The Common | MK18 4NA |
| The Elms | MK18 4LY |
| The Square | MK18 4EG MK18 4LL MK18 4LP |
| Tudors Close | MK18 2FE |
| Tuscans Close | MK18 2FN |
| Twyford Road | MK18 4DZ |
| Werner Terrace | MK18 2HQ |
| MK18 2HE MK18 4BX MK18 4DB MK18 4DD MK18 4DE MK18 4DP MK18 4DR MK18 4DS MK18 4DX |
Transport near Marsh Gibbon
-
Bicester North Station
-
Bicester Village Station
-
Aylesbury Vale Parkway Station
-
Heyford Station
-
Haddenham and Thame Parkway Station
-
Islip Station
-
Aylesbury Station
-
Tackley Station
-
King's Sutton Station
-
Milton Keynes Central Station
- FAQ
- Price Paid By Year
- Property Type Price
Frequently asked questions about Marsh Gibbon
What is the average price for a property for sale in Marsh Gibbon?
The average price for a property for sale in Marsh Gibbon is £515,026. This amount is 21% higher than the average price in Buckingham. There are 424 property listings for sale in Marsh Gibbon.
What streets have the most expensive properties for sale in Marsh Gibbon?
The streets with the most expensive properties for sale in Marsh Gibbon are The Common at an average of £1,462,000, Mill Lane at an average of £630,000 and Clay Lane at an average of £620,000.
What streets have the most affordable properties for sale in Marsh Gibbon?
The streets with the most affordable properties for sale in Marsh Gibbon are Portway Road at an average of £267,500, Rosehill Crescent at an average of £275,000 and The Square at an average of £305,000.
Which train stations are available in or near Marsh Gibbon?
Some of the train stations available in or near Marsh Gibbon are Bicester North, Bicester Village and Aylesbury Vale Parkway.
Property Price Paid in Marsh Gibbon by Year
The average sold property price by year was:
| Year | Average Sold Price | Price Change |
Sold Properties
|
|---|---|---|---|
| 2025 | £516,333 | -2% |
15 Properties |
| 2024 | £526,040 | 6% |
25 Properties |
| 2023 | £496,593 | -0,5% |
16 Properties |
| 2022 | £499,073 | 5% |
30 Properties |
| 2021 | £473,654 | 16% |
30 Properties |
| 2020 | £398,672 | -2% |
27 Properties |
| 2019 | £406,937 | 11% |
29 Properties |
| 2018 | £361,452 | -8% |
38 Properties |
| 2017 | £389,069 | 3% |
21 Properties |
| 2016 | £378,197 | 2% |
47 Properties |
| 2015 | £370,529 | 12% |
34 Properties |
| 2014 | £327,876 | 19% |
33 Properties |
| 2013 | £264,939 | -6% |
60 Properties |
| 2012 | £280,402 | -0,4% |
51 Properties |
| 2011 | £281,586 | -16% |
23 Properties |
| 2010 | £325,550 | 10% |
29 Properties |
| 2009 | £291,468 | -8% |
24 Properties |
| 2008 | £315,152 | 5% |
25 Properties |
| 2007 | £300,543 | 3% |
43 Properties |
| 2006 | £291,885 | 7% |
50 Properties |
| 2005 | £270,859 | 10% |
39 Properties |
| 2004 | £243,589 | -5% |
104 Properties |
| 2003 | £255,266 | -11% |
108 Properties |
| 2002 | £282,071 | 15% |
85 Properties |
| 2001 | £239,311 | 22% |
31 Properties |
| 2000 | £186,965 | 18% |
16 Properties |
| 1999 | £153,876 | 25% |
22 Properties |
| 1998 | £115,568 | 1% |
36 Properties |
| 1997 | £114,210 | 13% |
15 Properties |
| 1996 | £98,921 | 0,2% |
19 Properties |
| 1995 | £98,722 | - |
18 Properties |
Property Price per Property Type in Marsh Gibbon
Here you can find historic sold price data in order to help with your property search.
The average Property Paid Price for specific property types in the last three years are:
| Property Type | Average Sold Price | Sold Properties |
|---|---|---|
| Semi Detached House | £335,857.00 | 14 Semi Detached Houses |
| Detached House | £648,500.00 | 33 Detached Houses |
| Terraced House | £328,375.00 | 8 Terraced Houses |
| Flat | £112,000.00 | 1 Flat |

