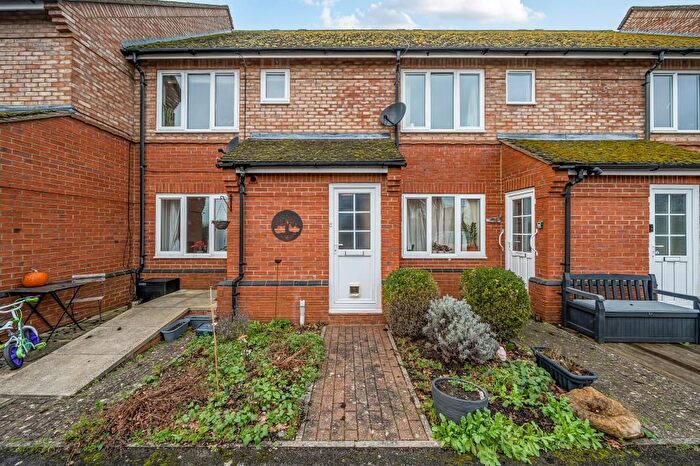
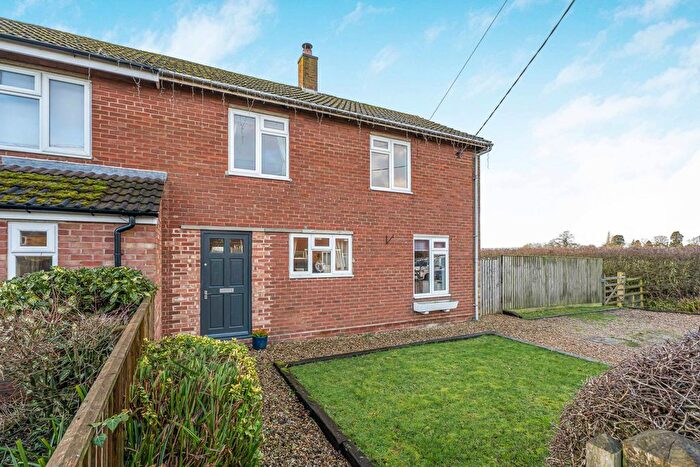
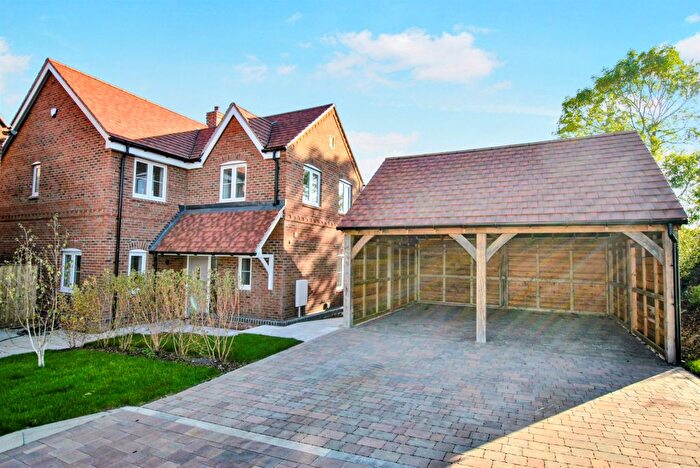
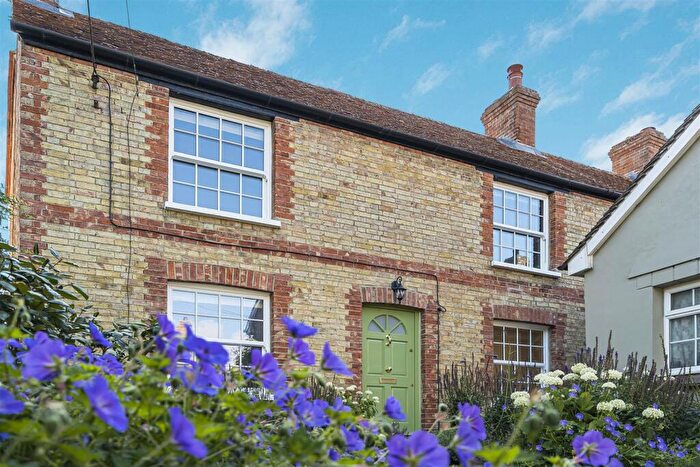
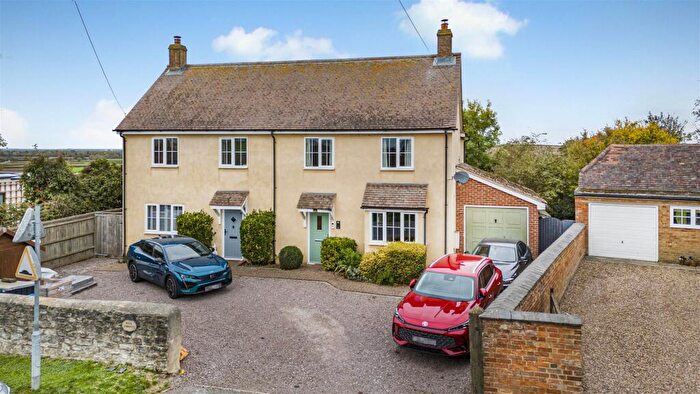
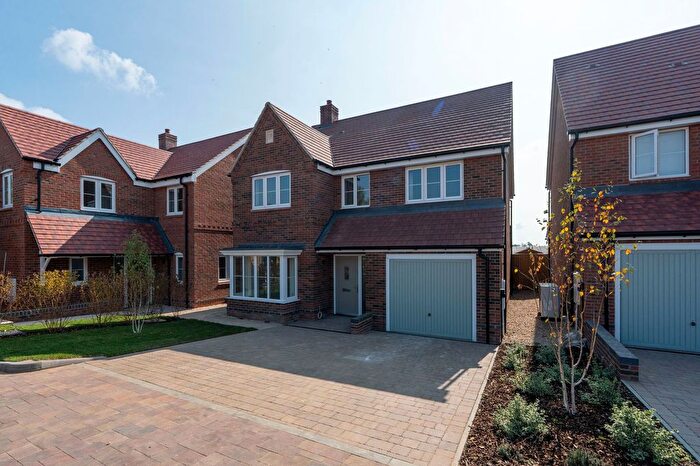
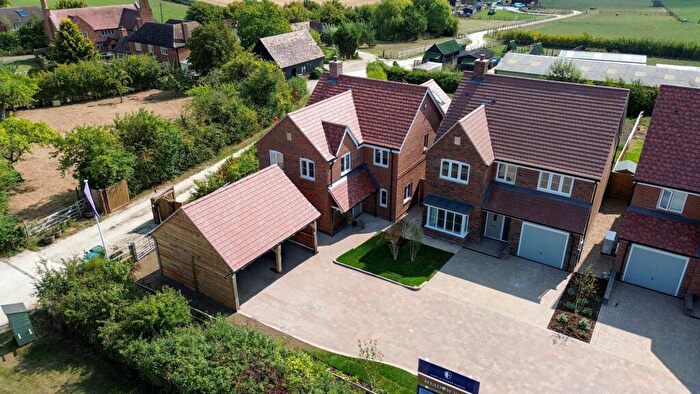
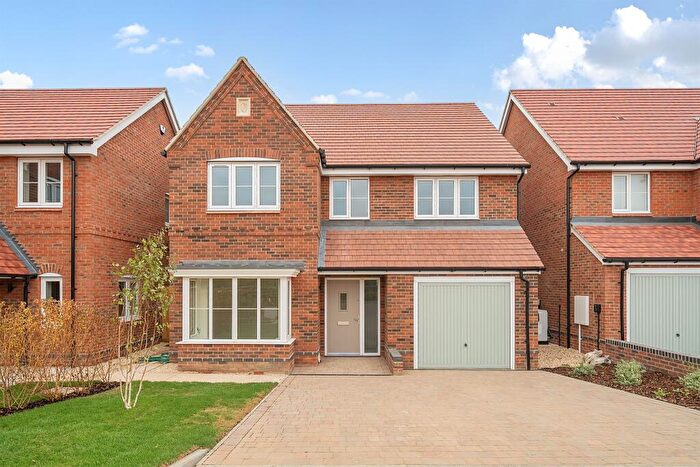
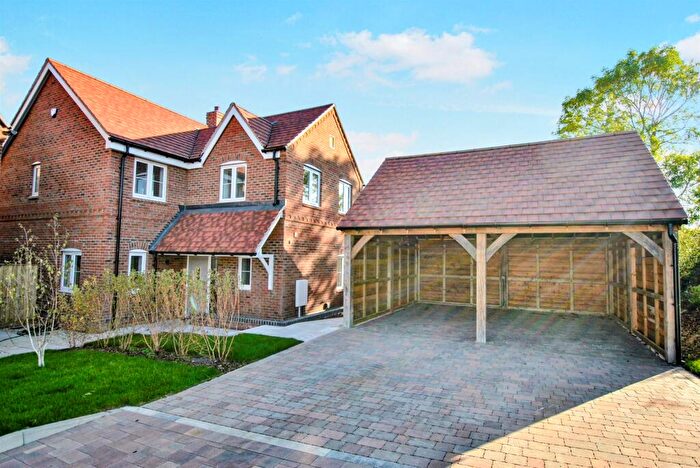
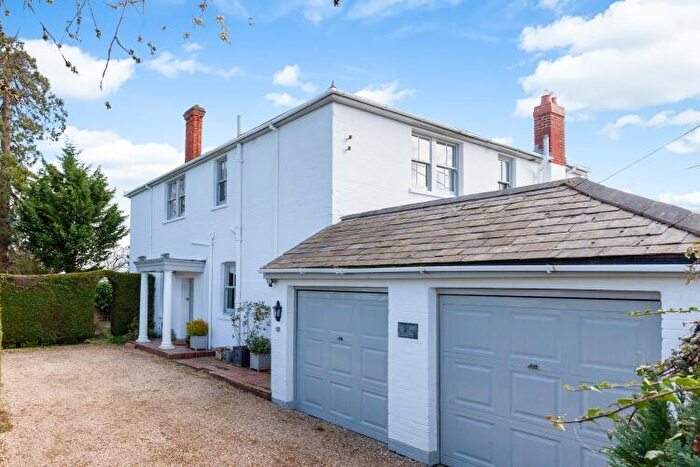
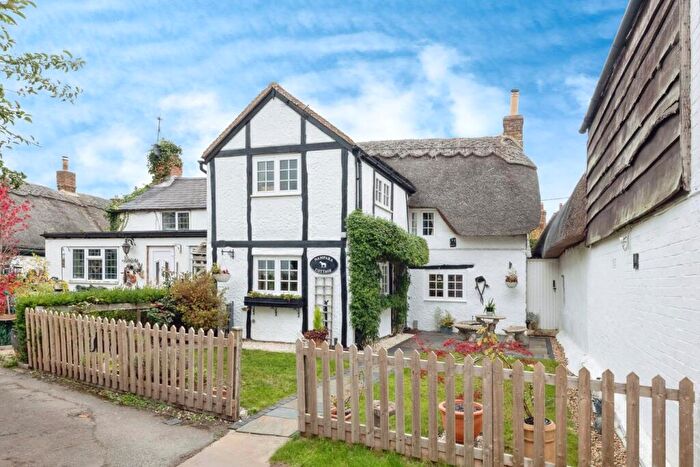
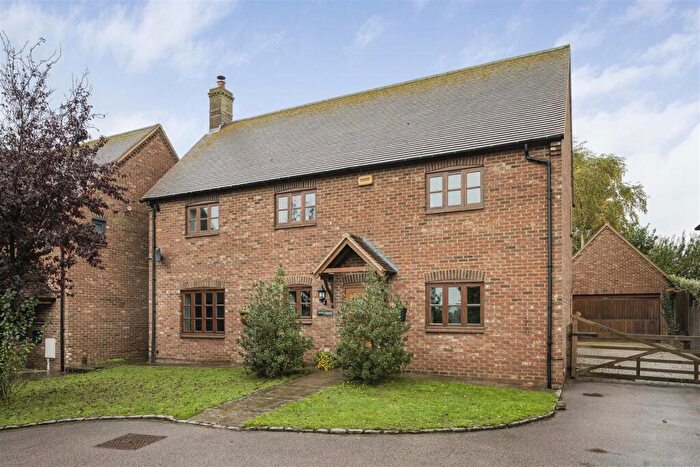
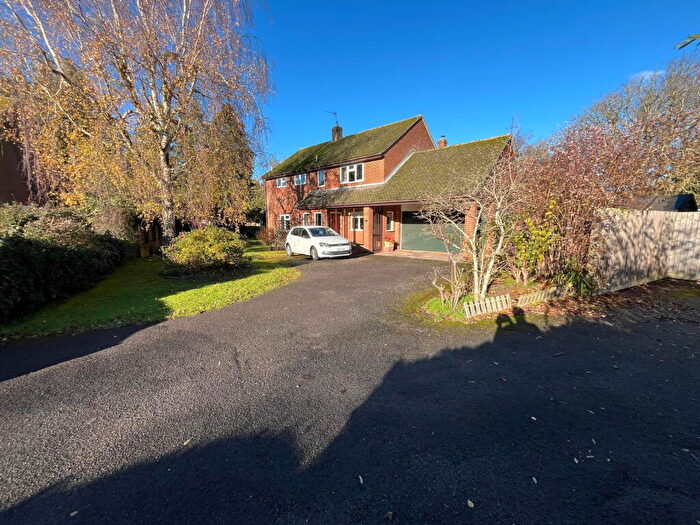
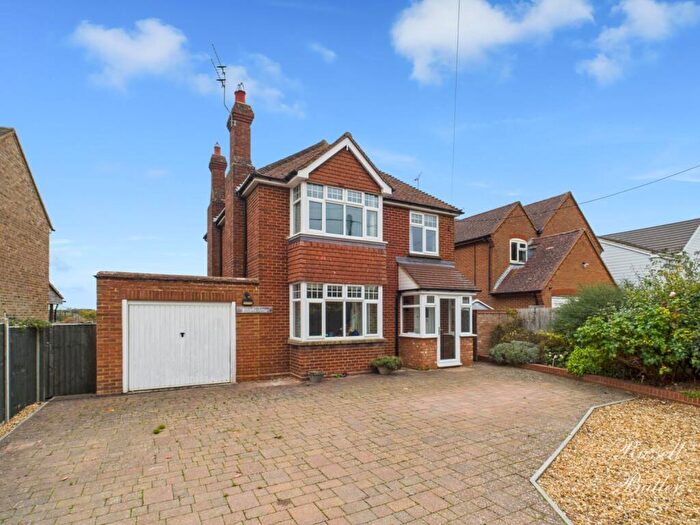
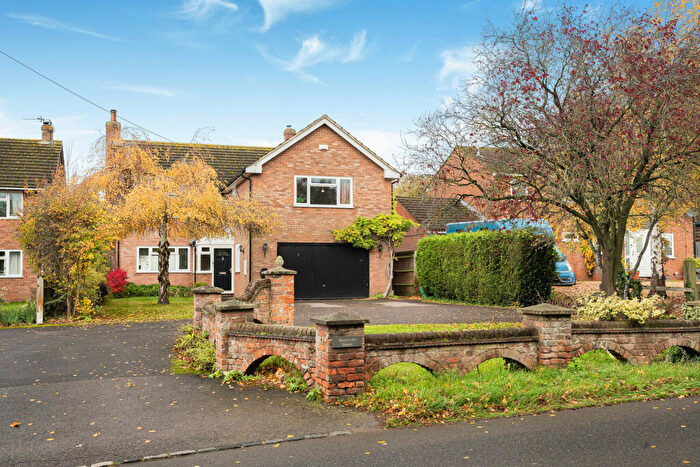
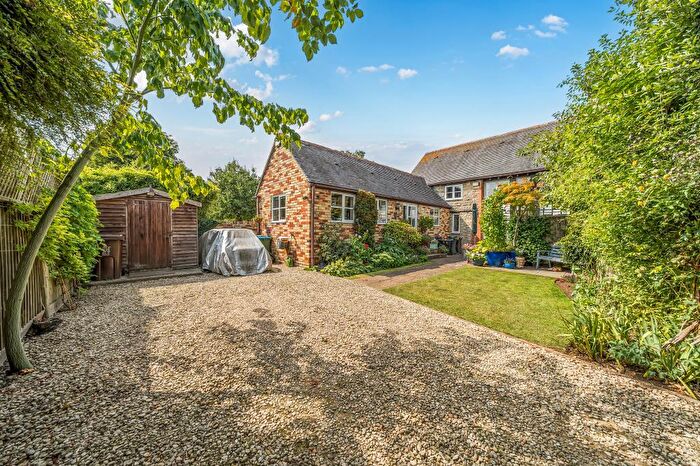
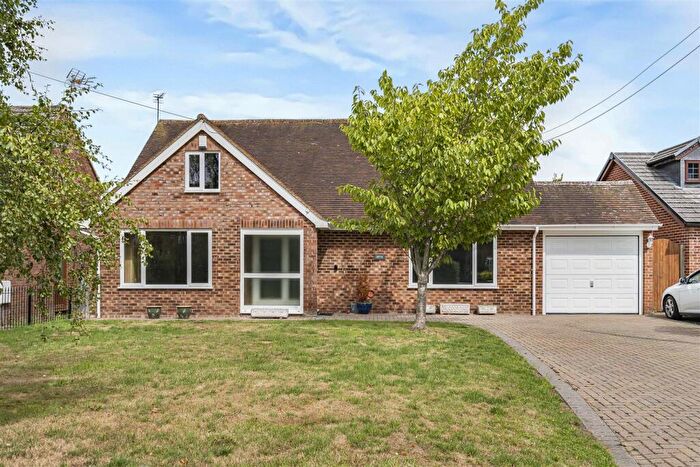
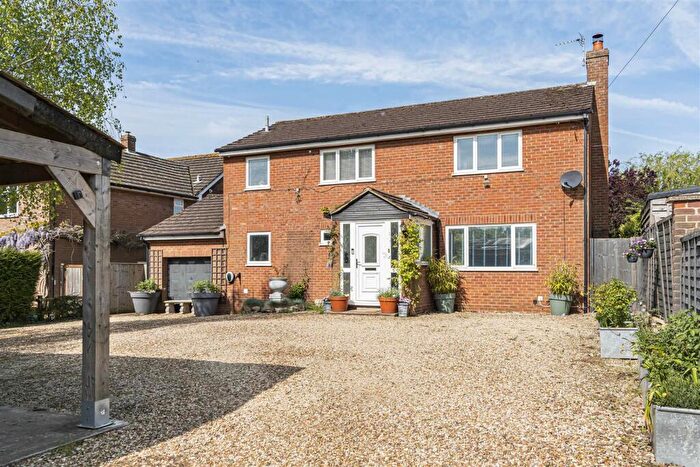
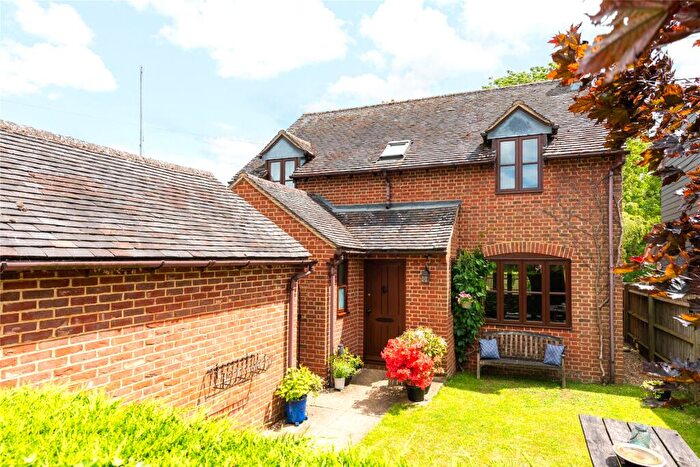
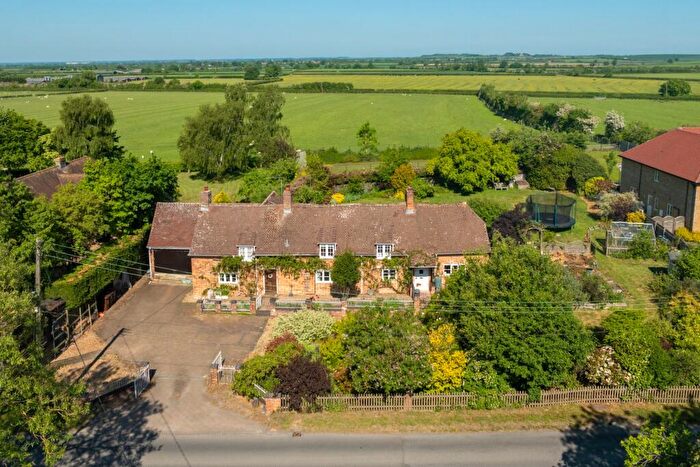
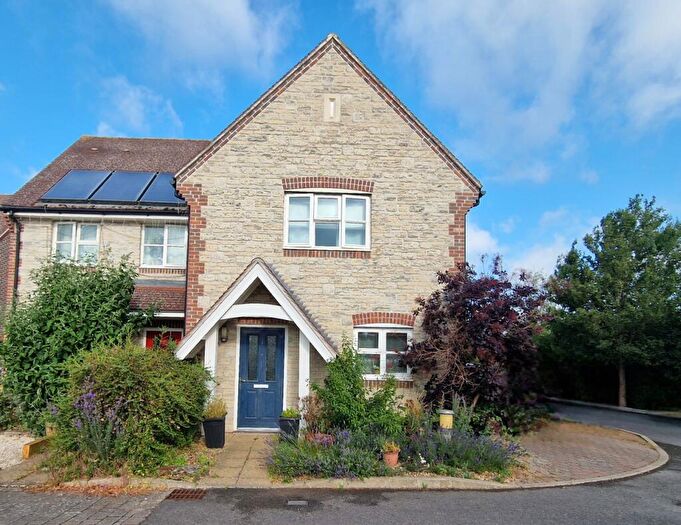
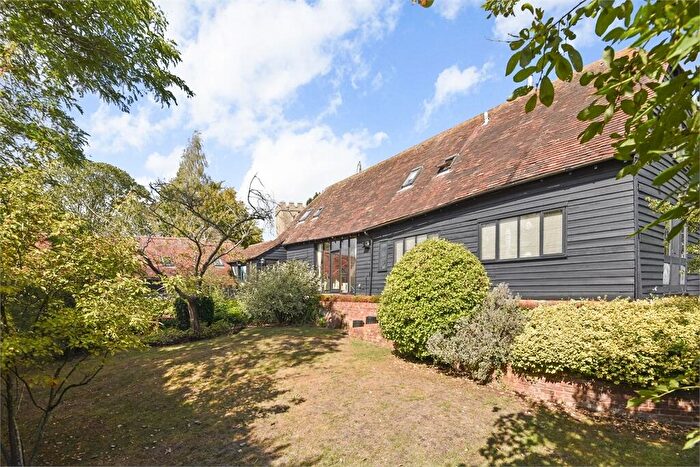
Houses for sale & to rent in Marsh Gibbon, Bicester
House Prices in Marsh Gibbon
Properties in Marsh Gibbon have an average house price of £578,194.00 and had 36 Property Transactions within the last 3 years¹.
Marsh Gibbon is an area in Bicester, Buckinghamshire with 504 households², where the most expensive property was sold for £1,400,000.00.
Properties for sale in Marsh Gibbon
Previously listed properties in Marsh Gibbon
Roads and Postcodes in Marsh Gibbon
Navigate through our locations to find the location of your next house in Marsh Gibbon, Bicester for sale or to rent.
| Streets | Postcodes |
|---|---|
| Barclay Close | OX27 0JA |
| Bicester Road | OX27 0EU |
| Blackthorn Road | OX27 0AG |
| Burnell Court | OX27 0GA |
| Castle Close | OX27 0HY |
| Castle Street | OX27 0HJ |
| Cheshire Cottages | OX27 0BT |
| Church Street | OX27 0ET OX27 0HQ |
| Clements Lane | OX27 0HG |
| Forge Close | OX27 0HZ |
| Hampden Hill | OX27 0BN |
| Hampden Villas | OX27 9BA |
| Kensington Villas | OX27 0AS |
| Little Marsh | OX27 0AP |
| Little Marsh Road | OX27 0AF |
| Main Street | OX27 0BL OX27 9AZ OX27 9BB |
| Marie Close | OX27 9BH |
| Millfield Avenue | OX27 0HP |
| Millfield Close | OX27 0HR |
| Moat Lane | OX27 0HE |
| Rectory Close | OX27 0HT |
| School Hill | OX27 0BQ |
| Scotts Lane | OX27 0EZ |
| Spencer Gardens | OX27 0BS |
| Station Road | OX27 0HN |
| Styles Close | OX27 0ER |
| Swan Lane | OX27 0HH |
| The College | OX27 0HW |
| Tompkins Lane | OX27 0EX |
| Townsend | OX27 0EY |
| Ware Leys Close | OX27 0EN |
| West Edge | OX27 0HA |
| Westbury Close | OX27 0EP |
| Westbury Terrace | OX27 0HD |
| Whales Lane | OX27 0HB |
| Wootton Green | OX27 0BW |
| OX27 0AW OX27 9AY |
Transport near Marsh Gibbon
- FAQ
- Price Paid By Year
- Property Type Price
Frequently asked questions about Marsh Gibbon
What is the average price for a property for sale in Marsh Gibbon?
The average price for a property for sale in Marsh Gibbon is £578,194. There are 249 property listings for sale in Marsh Gibbon.
What streets have the most expensive properties for sale in Marsh Gibbon?
The streets with the most expensive properties for sale in Marsh Gibbon are Castle Close at an average of £1,175,000, Castle Street at an average of £1,166,666 and West Edge at an average of £805,000.
What streets have the most affordable properties for sale in Marsh Gibbon?
The streets with the most affordable properties for sale in Marsh Gibbon are Millfield Close at an average of £254,000, Townsend at an average of £295,000 and Little Marsh Road at an average of £311,666.
Which train stations are available in or near Marsh Gibbon?
Some of the train stations available in or near Marsh Gibbon are Bicester North, Bicester Village and Islip.
Property Price Paid in Marsh Gibbon by Year
The average sold property price by year was:
| Year | Average Sold Price | Price Change |
Sold Properties
|
|---|---|---|---|
| 2025 | £554,187 | -15% |
16 Properties |
| 2024 | £639,846 | 19% |
13 Properties |
| 2023 | £518,571 | -30% |
7 Properties |
| 2022 | £672,500 | 27% |
10 Properties |
| 2021 | £490,454 | -2% |
22 Properties |
| 2020 | £501,247 | 8% |
18 Properties |
| 2019 | £460,960 | -6% |
25 Properties |
| 2018 | £487,778 | -1% |
16 Properties |
| 2017 | £491,699 | 28% |
10 Properties |
| 2016 | £351,833 | -8% |
24 Properties |
| 2015 | £379,743 | -19% |
15 Properties |
| 2014 | £451,560 | 30% |
25 Properties |
| 2013 | £314,125 | -8% |
10 Properties |
| 2012 | £339,868 | 10% |
16 Properties |
| 2011 | £305,662 | -17% |
12 Properties |
| 2010 | £356,925 | 24% |
20 Properties |
| 2009 | £271,571 | -57% |
15 Properties |
| 2008 | £427,428 | 16% |
7 Properties |
| 2007 | £358,530 | 20% |
33 Properties |
| 2006 | £287,674 | -6% |
37 Properties |
| 2005 | £305,770 | -10% |
27 Properties |
| 2004 | £335,391 | 25% |
23 Properties |
| 2003 | £251,451 | 9% |
21 Properties |
| 2002 | £230,021 | 16% |
26 Properties |
| 2001 | £192,313 | 3% |
30 Properties |
| 2000 | £185,900 | 17% |
21 Properties |
| 1999 | £155,116 | 16% |
30 Properties |
| 1998 | £130,567 | -7% |
28 Properties |
| 1997 | £139,379 | 29% |
32 Properties |
| 1996 | £99,036 | 16% |
25 Properties |
| 1995 | £82,754 | - |
20 Properties |
Property Price per Property Type in Marsh Gibbon
Here you can find historic sold price data in order to help with your property search.
The average Property Paid Price for specific property types in the last three years are:
| Property Type | Average Sold Price | Sold Properties |
|---|---|---|
| Semi Detached House | £576,500.00 | 8 Semi Detached Houses |
| Detached House | £696,850.00 | 20 Detached Houses |
| Terraced House | £303,714.00 | 7 Terraced Houses |
| Flat | £140,000.00 | 1 Flat |

