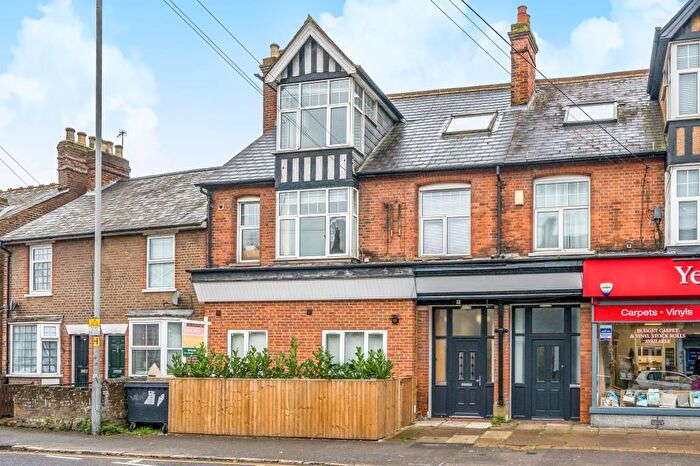
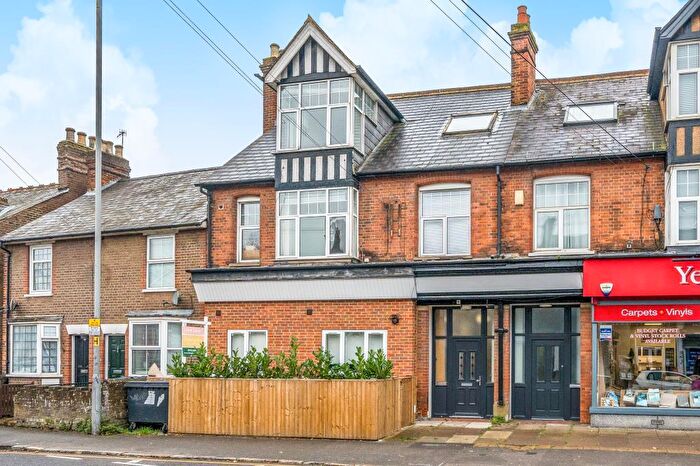
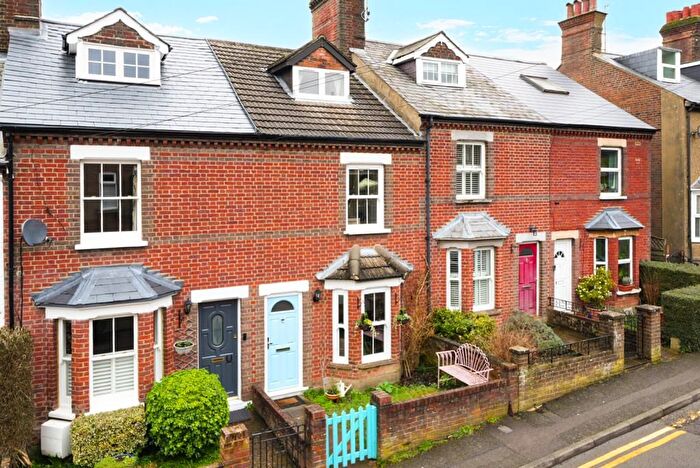
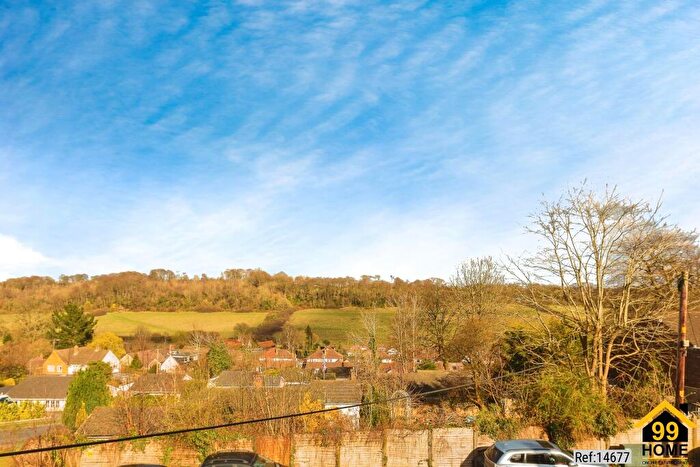
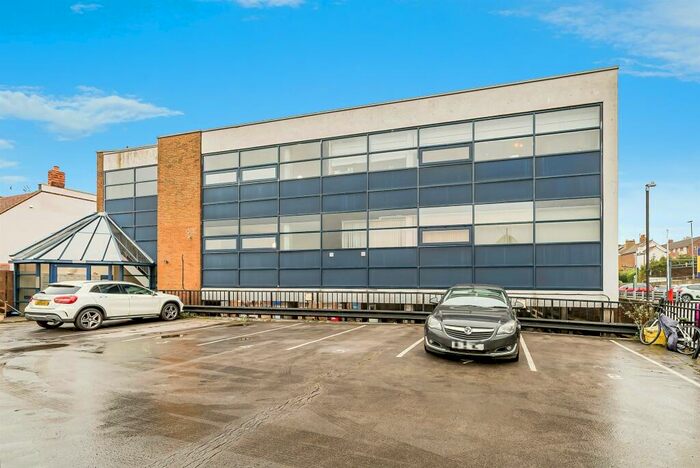
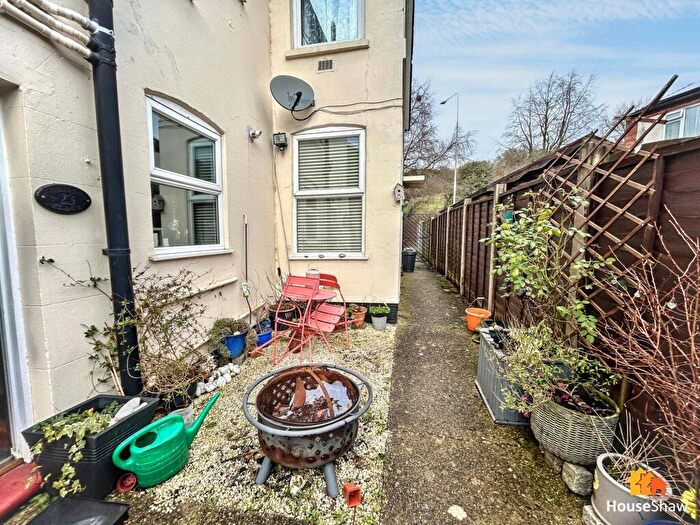
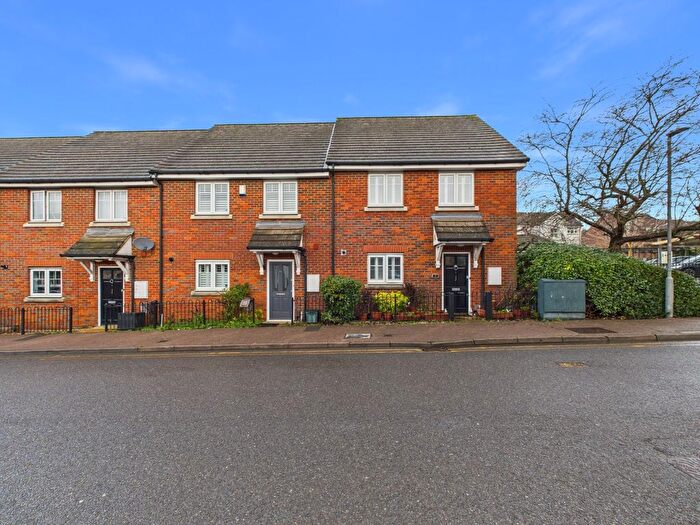
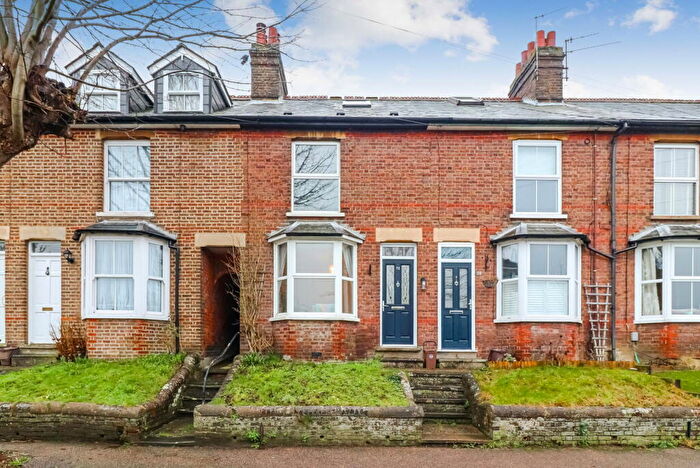
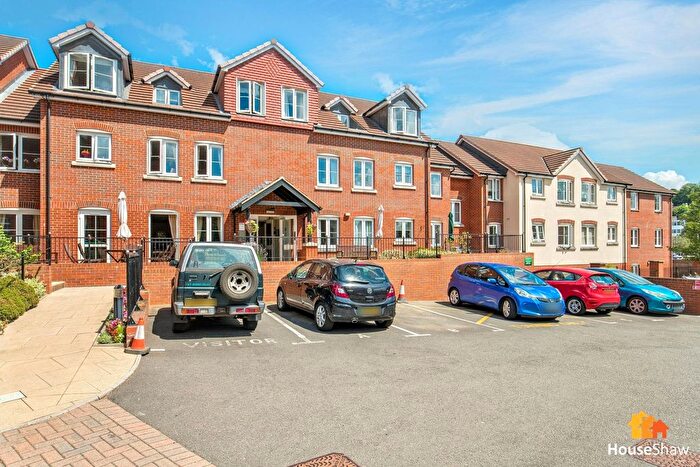
Houses for sale & to rent in Newtown, Chesham
House Prices in Newtown
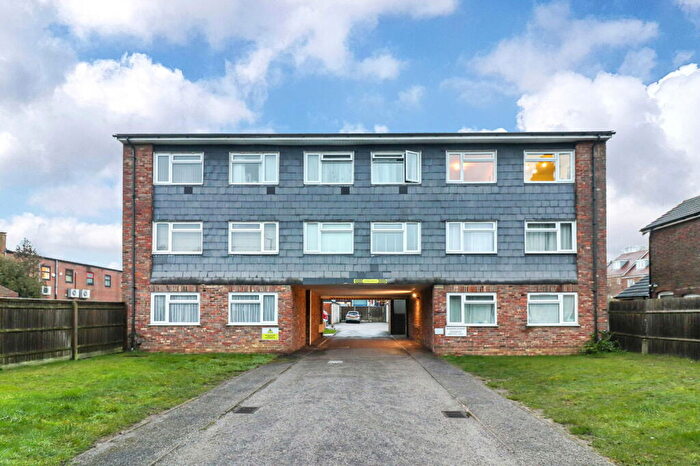
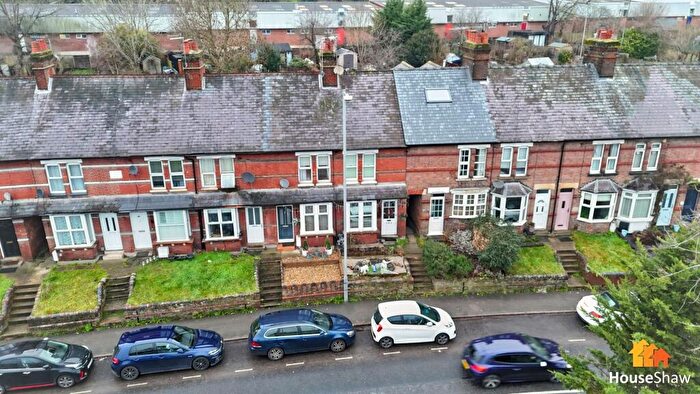
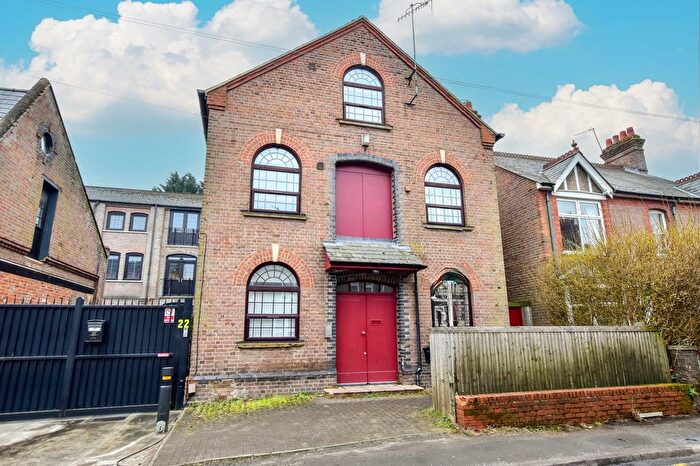
Properties in Newtown have an average house price of £475,139.00 and had 92 Property Transactions within the last 3 years¹.
Newtown is an area in Chesham, Buckinghamshire with 911 households², where the most expensive property was sold for £1,385,000.00.
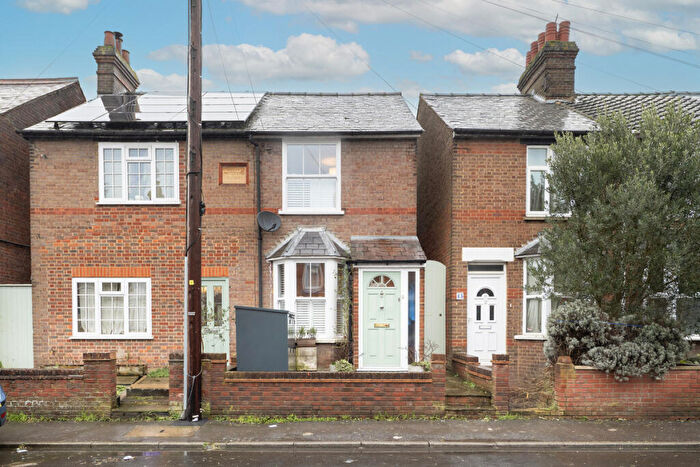
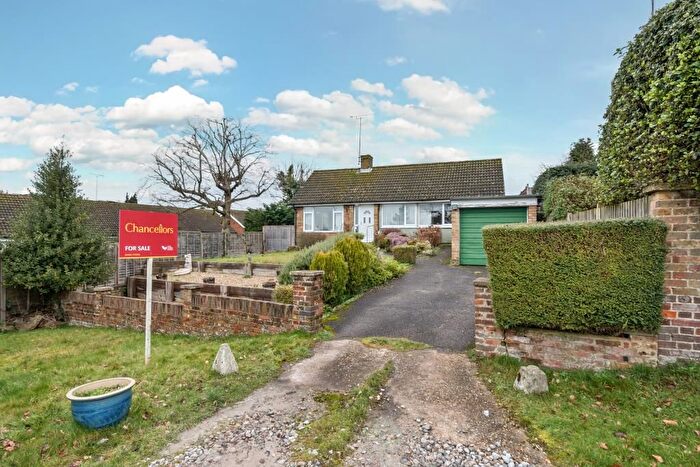
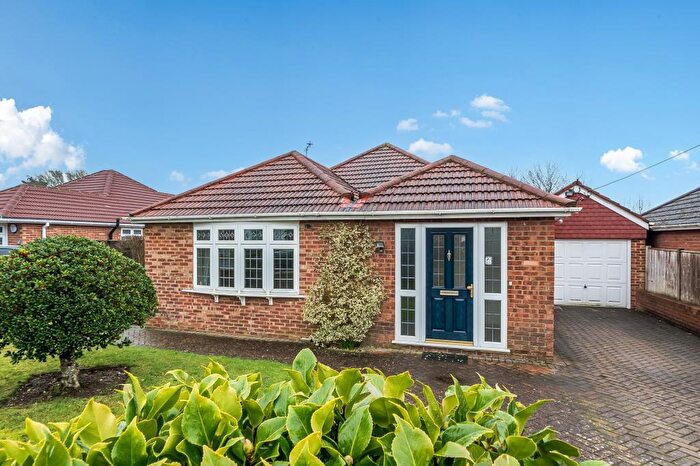
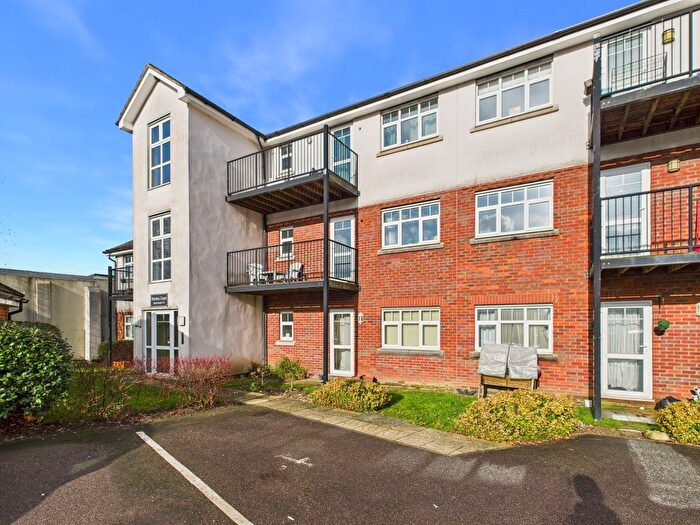
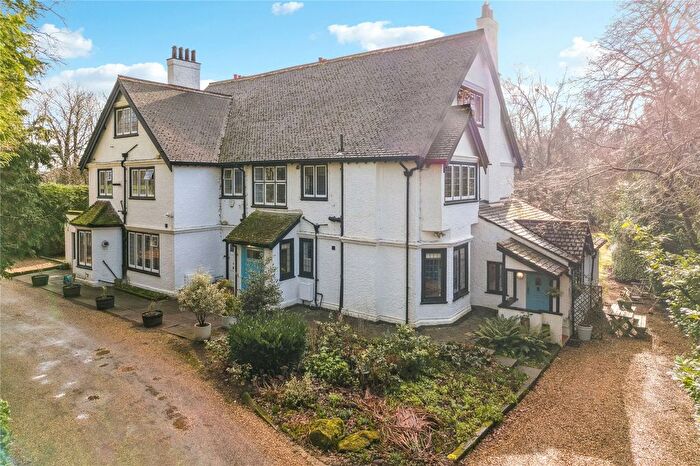
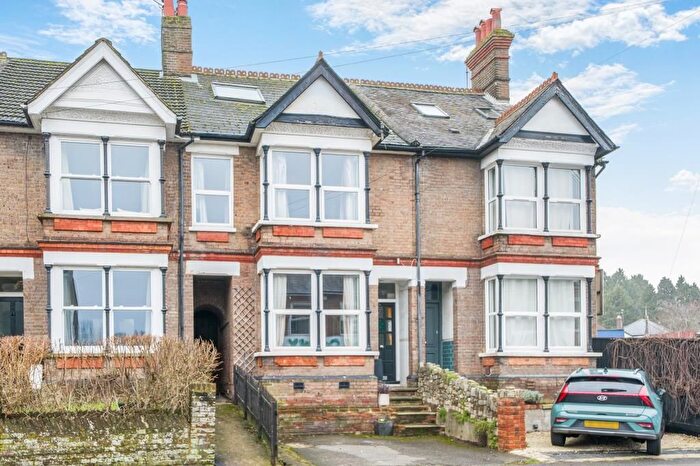
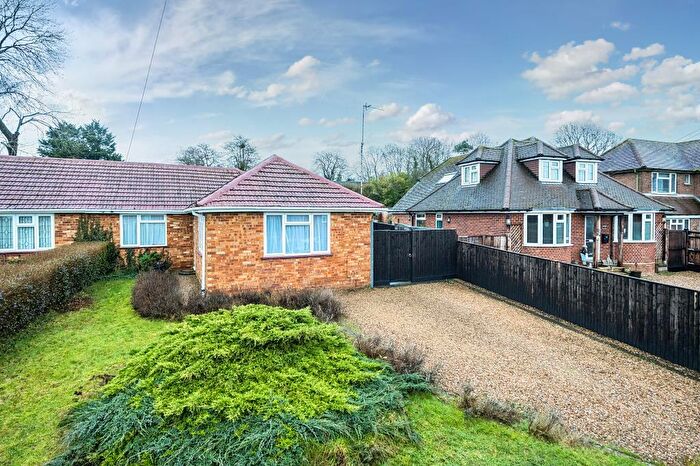
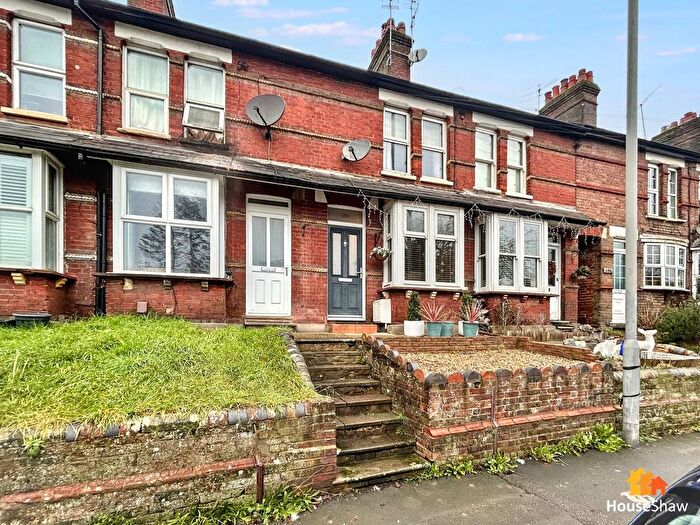
Properties for sale in Newtown
Roads and Postcodes in Newtown
Navigate through our locations to find the location of your next house in Newtown, Chesham for sale or to rent.
| Streets | Postcodes |
|---|---|
| Alexander Street | HP5 3EG |
| Ashley Green Road | HP5 3PE HP5 3PF |
| Berkhampstead Road | HP5 3AP HP5 3AS HP5 3AT HP5 3AU HP5 3EP HP5 3ET HP5 3EZ HP5 3HF HP5 3HG HP5 3HQ |
| Birch Way | HP5 3JL |
| Britannia Road | HP5 3JD |
| Brockhurst Road | HP5 3JA HP5 3JB HP5 3JE |
| Cameron Road | HP5 3BS HP5 3BX |
| Cherry Tree Walk | HP5 3JN |
| Deer Park Walk | HP5 3LJ |
| Essex Road | HP5 3HZ |
| Field Close | HP5 3LB |
| Frances Street | HP5 3EQ HP5 3ER HP5 3ES |
| George Street | HP5 3EJ |
| Hawkes Court | HP5 3AW |
| Hazelwood Close | HP5 3DR |
| Henry Mash Court | HP5 3FD |
| Lycrome Lane | HP5 3JY |
| Lycrome Road | HP5 3LA HP5 3LD HP5 3LQ |
| Nashleigh Hill | HP5 3JF HP5 3JG HP5 3JQ HP5 3JW |
| Partridge Close | HP5 3LH |
| Russell Court | HP5 3JH HP5 3JJ |
| Sayward Close | HP5 3DP |
| Severalls Avenue | HP5 3EL HP5 3EN |
| Sunnymede Avenue | HP5 3LE |
| Sycamore Dene | HP5 3JT |
| Turners Walk | HP5 3BT |
| Upper George Street | HP5 3EH |
| Woodcroft Road | HP5 3JU |
Transport near Newtown
- FAQ
- Price Paid By Year
- Property Type Price
Frequently asked questions about Newtown
What is the average price for a property for sale in Newtown?
The average price for a property for sale in Newtown is £475,139. This amount is 4% lower than the average price in Chesham. There are 936 property listings for sale in Newtown.
What streets have the most expensive properties for sale in Newtown?
The streets with the most expensive properties for sale in Newtown are Sunnymede Avenue at an average of £976,266, Lycrome Road at an average of £970,000 and Woodcroft Road at an average of £840,000.
What streets have the most affordable properties for sale in Newtown?
The streets with the most affordable properties for sale in Newtown are Upper George Street at an average of £313,875, Cameron Road at an average of £337,600 and Brockhurst Road at an average of £344,062.
Which train stations are available in or near Newtown?
The train station available in or near Newtown is Amersham.
Which tube stations are available in or near Newtown?
Some of the tube stations available in or near Newtown are Chesham and Amersham.
Property Price Paid in Newtown by Year
The average sold property price by year was:
| Year | Average Sold Price | Price Change |
Sold Properties
|
|---|---|---|---|
| 2025 | £471,282 | -8% |
23 Properties |
| 2024 | £508,144 | 14% |
38 Properties |
| 2023 | £437,542 | -1% |
31 Properties |
| 2022 | £439,740 | -0,3% |
43 Properties |
| 2021 | £441,147 | 10% |
66 Properties |
| 2020 | £398,629 | 8% |
31 Properties |
| 2019 | £367,547 | 5% |
36 Properties |
| 2018 | £348,295 | -10% |
49 Properties |
| 2017 | £383,702 | 1% |
42 Properties |
| 2016 | £379,029 | 8% |
34 Properties |
| 2015 | £346,897 | 15% |
47 Properties |
| 2014 | £293,527 | 19% |
52 Properties |
| 2013 | £236,811 | -16% |
39 Properties |
| 2012 | £275,636 | 11% |
46 Properties |
| 2011 | £245,763 | -16% |
32 Properties |
| 2010 | £285,285 | 8% |
40 Properties |
| 2009 | £263,666 | 16% |
24 Properties |
| 2008 | £220,867 | -8% |
28 Properties |
| 2007 | £239,093 | 4% |
55 Properties |
| 2006 | £228,646 | 8% |
69 Properties |
| 2005 | £209,513 | 9% |
51 Properties |
| 2004 | £191,696 | -22% |
62 Properties |
| 2003 | £234,579 | 24% |
73 Properties |
| 2002 | £178,992 | 16% |
65 Properties |
| 2001 | £150,573 | 2% |
64 Properties |
| 2000 | £148,097 | 27% |
62 Properties |
| 1999 | £108,098 | 9% |
72 Properties |
| 1998 | £98,246 | 14% |
64 Properties |
| 1997 | £84,101 | 13% |
85 Properties |
| 1996 | £73,312 | -19% |
59 Properties |
| 1995 | £87,557 | - |
39 Properties |
Property Price per Property Type in Newtown
Here you can find historic sold price data in order to help with your property search.
The average Property Paid Price for specific property types in the last three years are:
| Property Type | Average Sold Price | Sold Properties |
|---|---|---|
| Semi Detached House | £485,187.00 | 16 Semi Detached Houses |
| Detached House | £731,291.00 | 20 Detached Houses |
| Terraced House | £418,714.00 | 42 Terraced Houses |
| Flat | £267,000.00 | 14 Flats |

