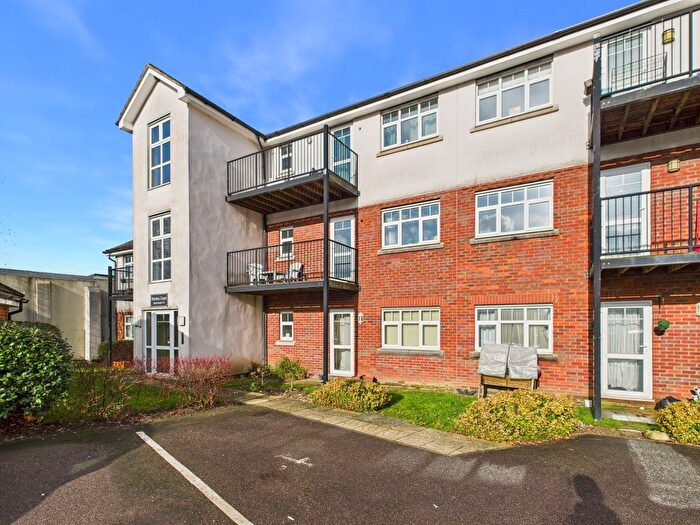
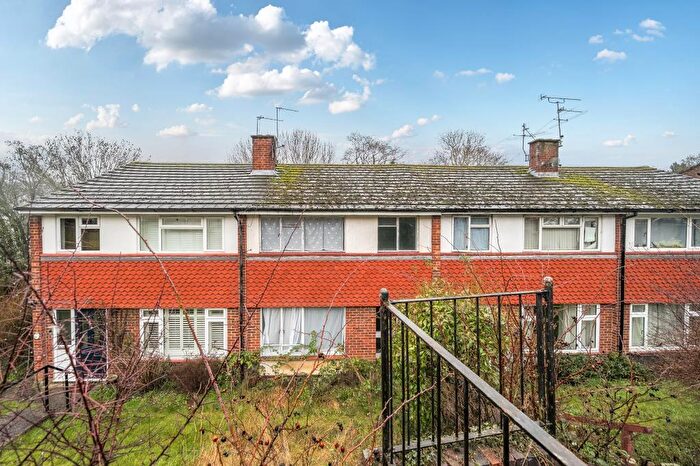
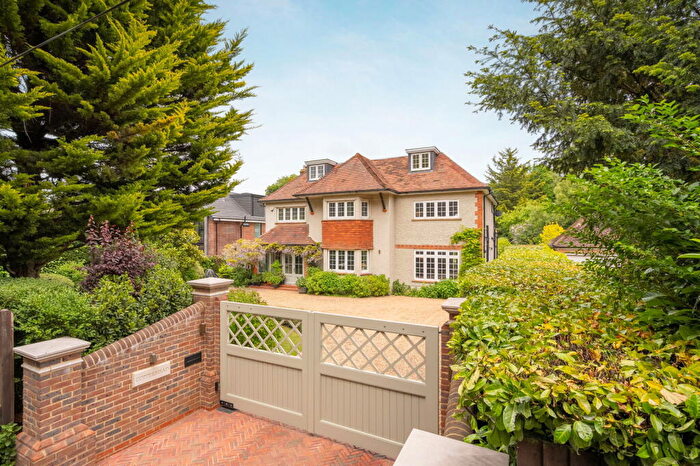
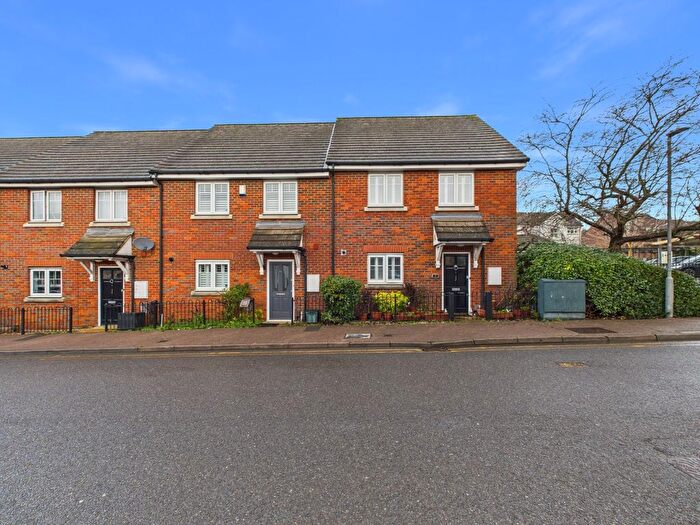
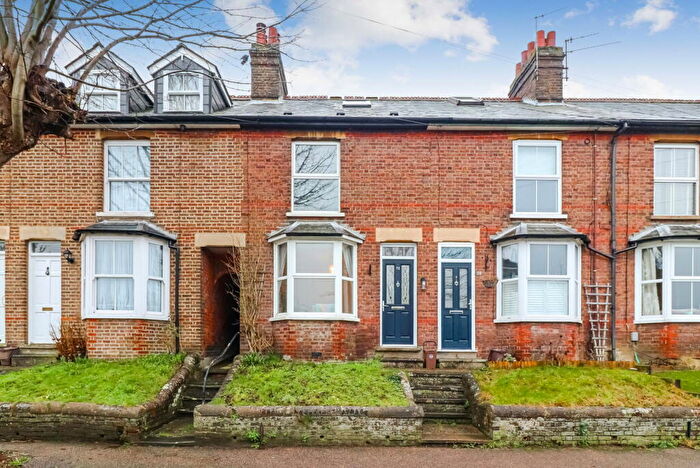
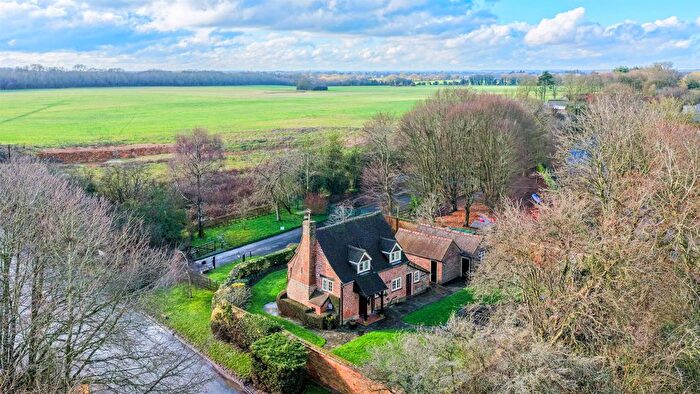
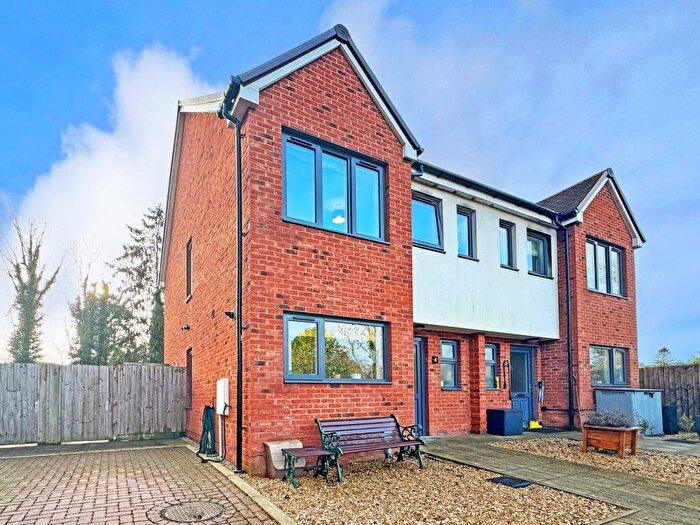
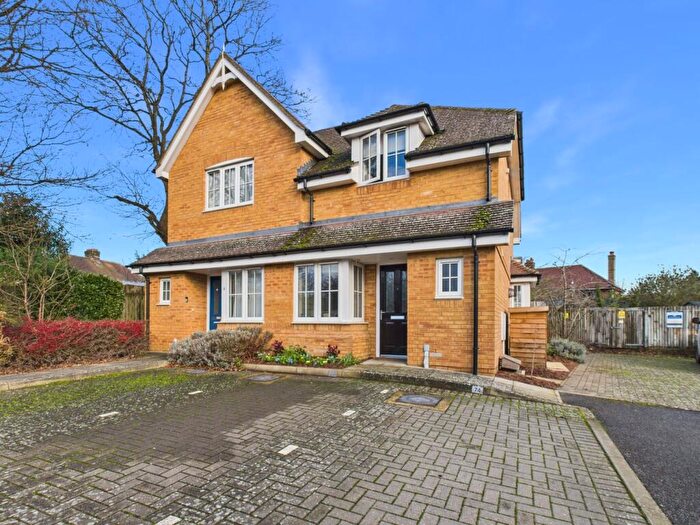
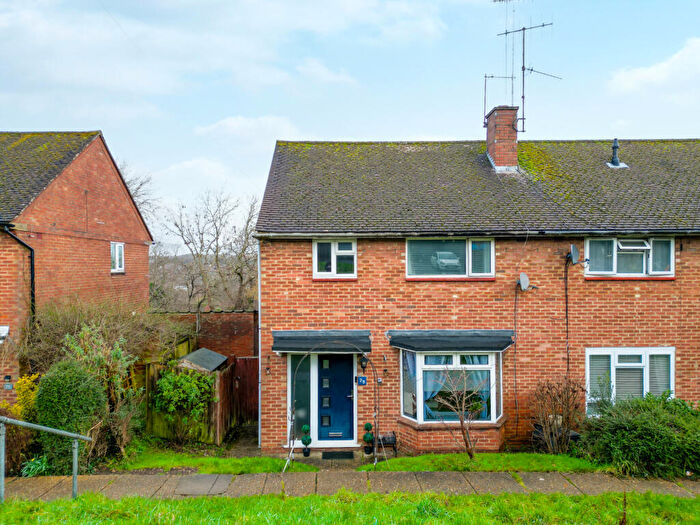
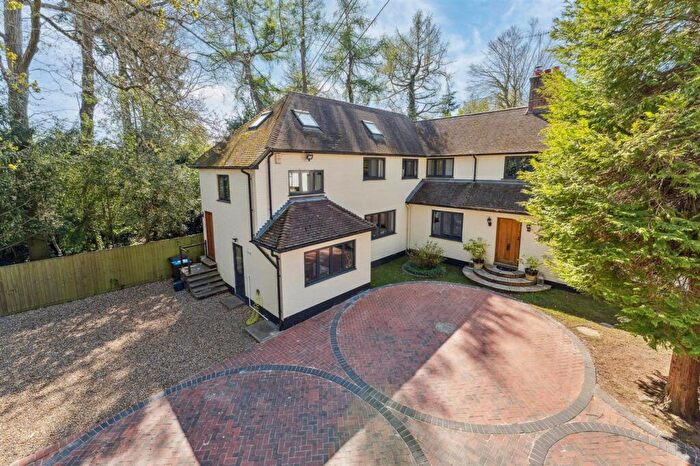
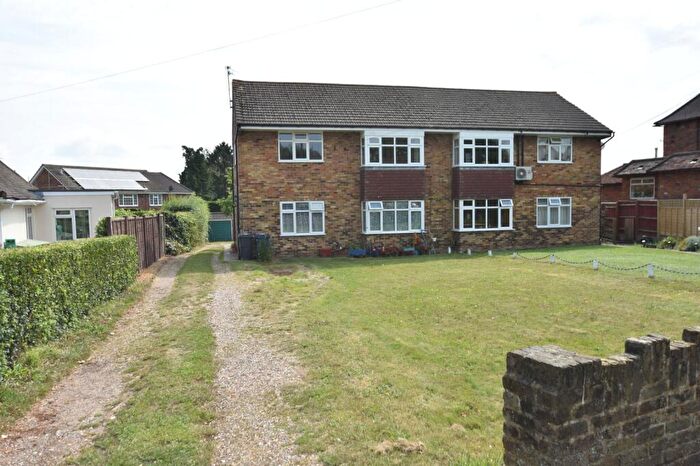
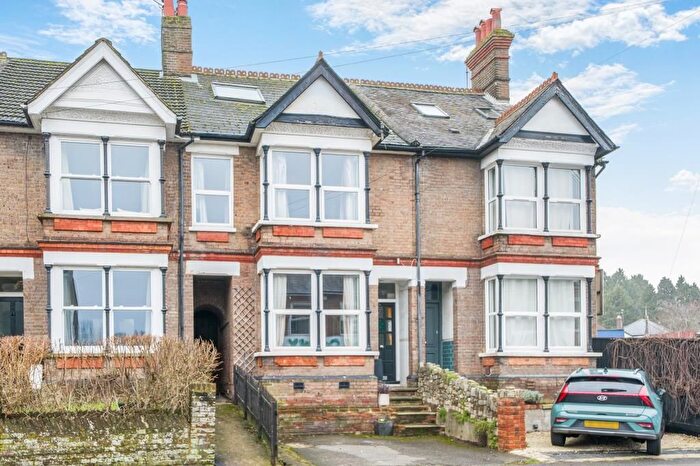
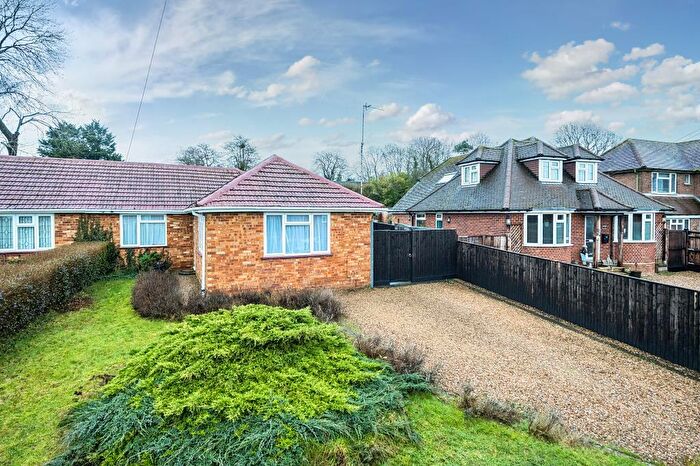
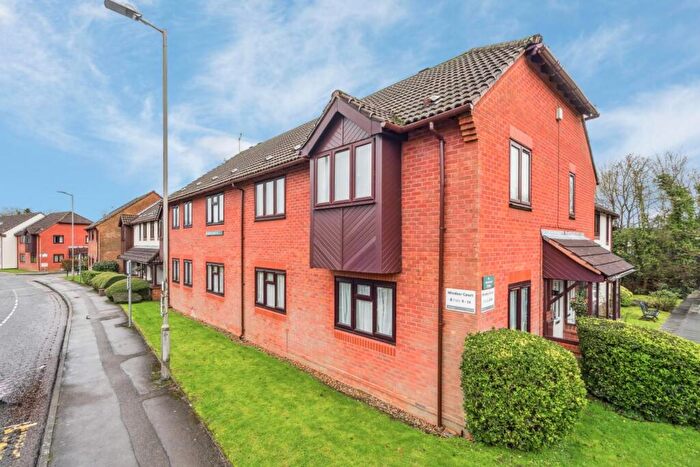
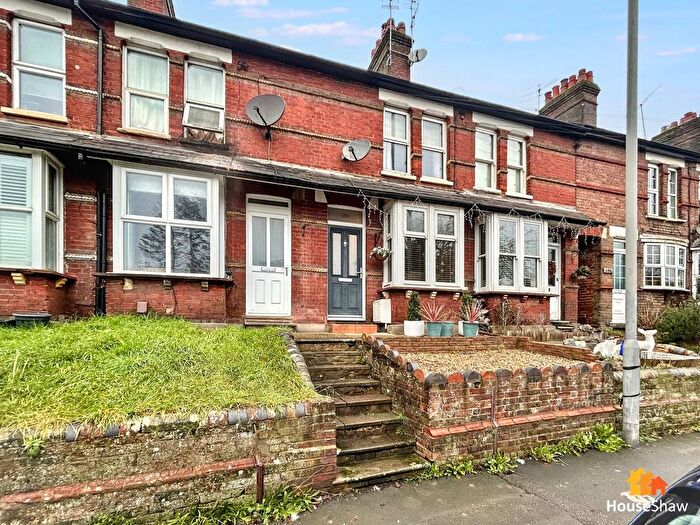
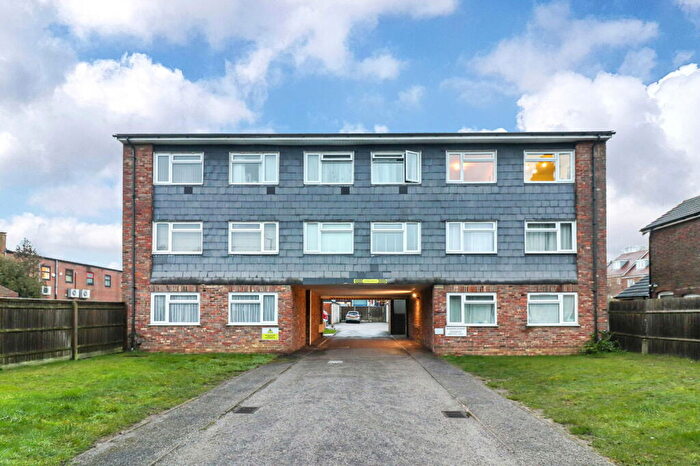
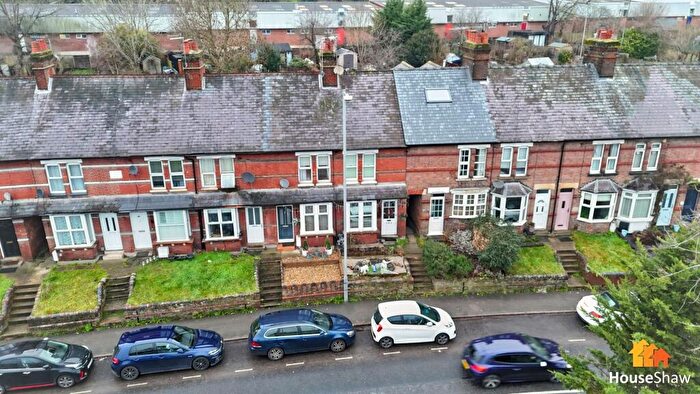
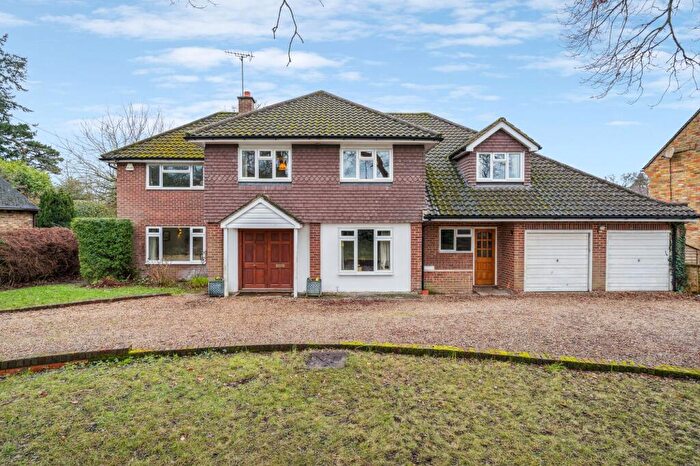
Houses for sale & to rent in Chesham, Buckinghamshire
House Prices in Chesham
Properties in Chesham have an average house price of £495,517.00 and had 922 Property Transactions within the last 3 years.¹
Chesham is an area in Buckinghamshire with 10,260 households², where the most expensive property was sold for £2,800,000.00.
Properties for sale in Chesham
Neighbourhoods in Chesham
Navigate through our locations to find the location of your next house in Chesham, Buckinghamshire for sale or to rent.
Transport in Chesham
Please see below transportation links in this area:
- FAQ
- Price Paid By Year
- Property Type Price
Frequently asked questions about Chesham
What is the average price for a property for sale in Chesham?
The average price for a property for sale in Chesham is £495,517. This amount is 11% lower than the average price in Buckinghamshire. There are 5,139 property listings for sale in Chesham.
What locations have the most expensive properties for sale in Chesham?
The locations with the most expensive properties for sale in Chesham are Ballinger, South Heath And Chartridge at an average of £869,108, Cholesbury, The Lee And Bellingdon at an average of £775,842 and Ashley Green, Latimer And Chenies at an average of £699,357.
What locations have the most affordable properties for sale in Chesham?
The locations with the most affordable properties for sale in Chesham are Chess Valley at an average of £398,326, St Marys And Waterside at an average of £401,292 and Vale at an average of £432,524.
Which train stations are available in or near Chesham?
The train station available in or near Chesham is Amersham.
Which tube stations are available in or near Chesham?
Some of the tube stations available in or near Chesham are Chesham and Amersham.
Property Price Paid in Chesham by Year
The average sold property price by year was:
| Year | Average Sold Price | Price Change |
Sold Properties
|
|---|---|---|---|
| 2025 | £504,680 | -1% |
274 Properties |
| 2024 | £511,957 | 8% |
333 Properties |
| 2023 | £470,167 | -13% |
315 Properties |
| 2022 | £530,306 | 7% |
370 Properties |
| 2021 | £492,990 | 7% |
540 Properties |
| 2020 | £458,981 | 7% |
346 Properties |
| 2019 | £426,164 | -3% |
364 Properties |
| 2018 | £437,342 | -3% |
363 Properties |
| 2017 | £448,718 | 15% |
421 Properties |
| 2016 | £382,646 | - |
458 Properties |
| 2015 | £382,582 | 12% |
484 Properties |
| 2014 | £338,489 | 10% |
450 Properties |
| 2013 | £305,090 | -7% |
420 Properties |
| 2012 | £327,742 | 6% |
380 Properties |
| 2011 | £306,586 | 1% |
363 Properties |
| 2010 | £302,658 | 9% |
332 Properties |
| 2009 | £274,205 | -14% |
277 Properties |
| 2008 | £312,268 | 5% |
243 Properties |
| 2007 | £297,870 | 8% |
599 Properties |
| 2006 | £273,312 | 12% |
602 Properties |
| 2005 | £241,433 | -3% |
486 Properties |
| 2004 | £249,129 | 1% |
430 Properties |
| 2003 | £247,305 | 15% |
509 Properties |
| 2002 | £209,231 | 15% |
569 Properties |
| 2001 | £177,169 | 7% |
507 Properties |
| 2000 | £164,995 | 13% |
493 Properties |
| 1999 | £143,722 | 10% |
556 Properties |
| 1998 | £130,006 | 17% |
495 Properties |
| 1997 | £107,638 | 2% |
532 Properties |
| 1996 | £105,304 | 9% |
482 Properties |
| 1995 | £95,538 | - |
388 Properties |
Property Price per Property Type in Chesham
Here you can find historic sold price data in order to help with your property search.
The average Property Paid Price for specific property types in the last three years are:
| Property Type | Average Sold Price | Sold Properties |
|---|---|---|
| Semi Detached House | £522,665.00 | 255 Semi Detached Houses |
| Detached House | £814,351.00 | 191 Detached Houses |
| Terraced House | £420,000.00 | 296 Terraced Houses |
| Flat | £242,923.00 | 180 Flats |

