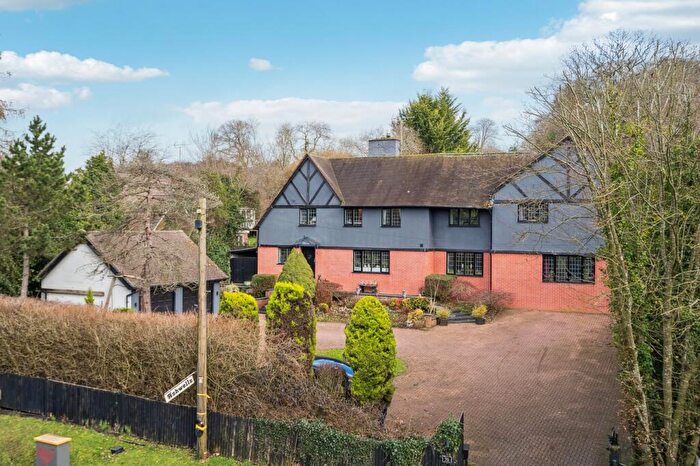
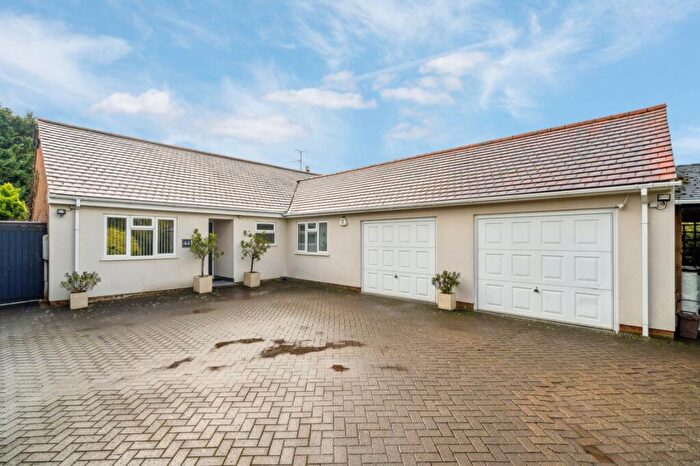
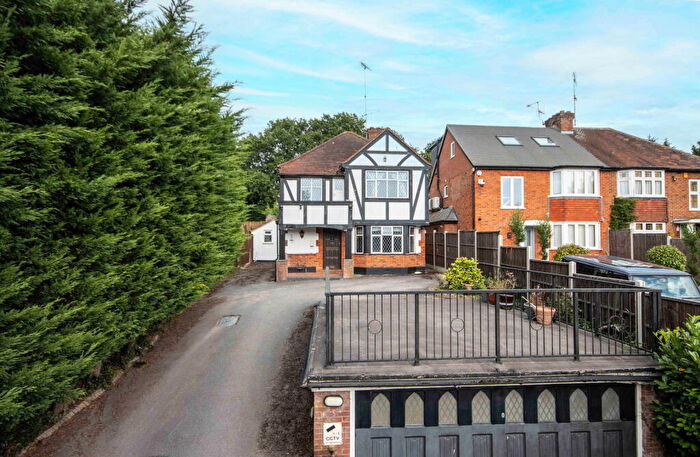
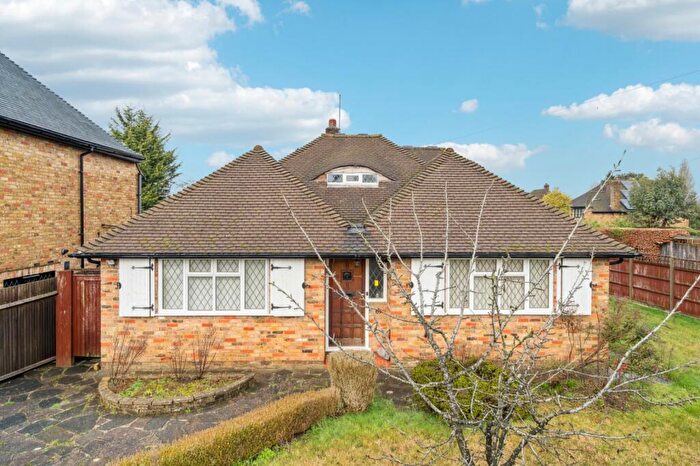
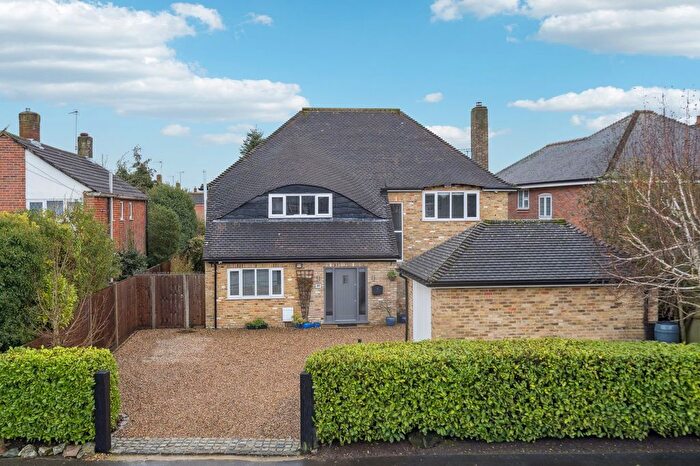
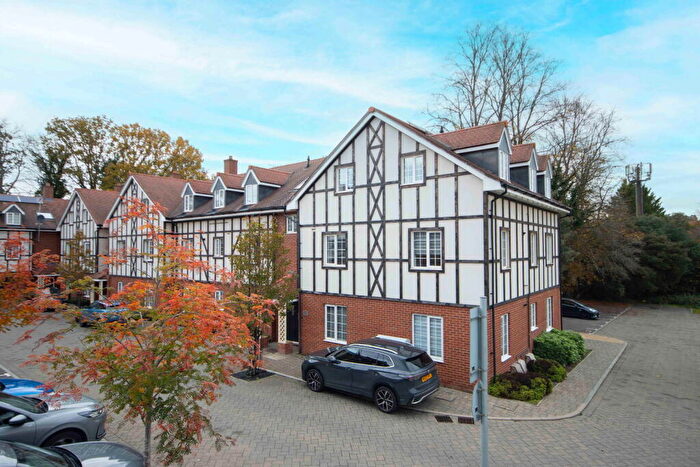
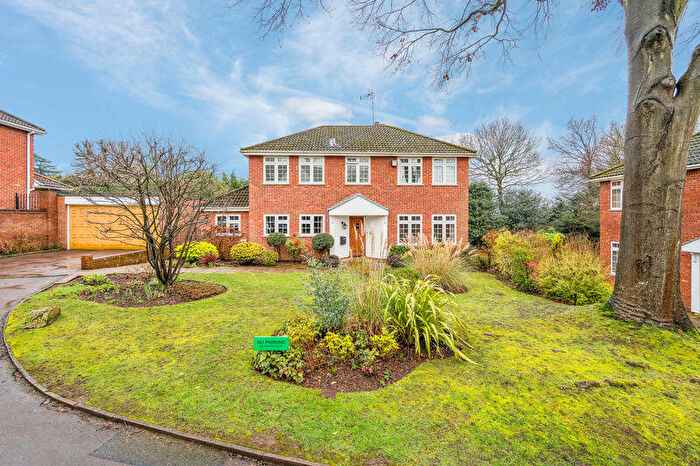
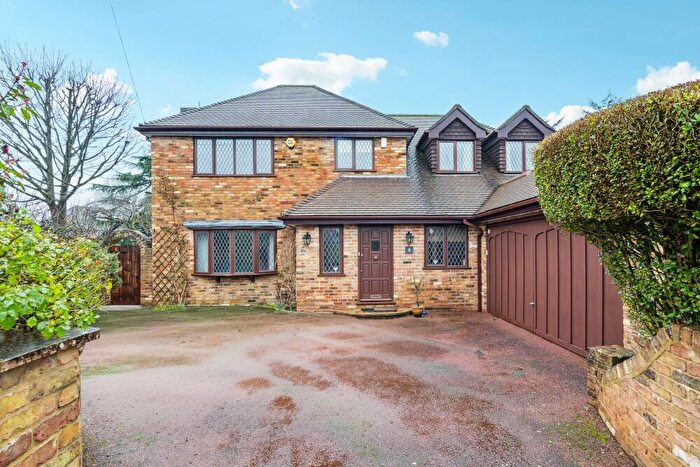
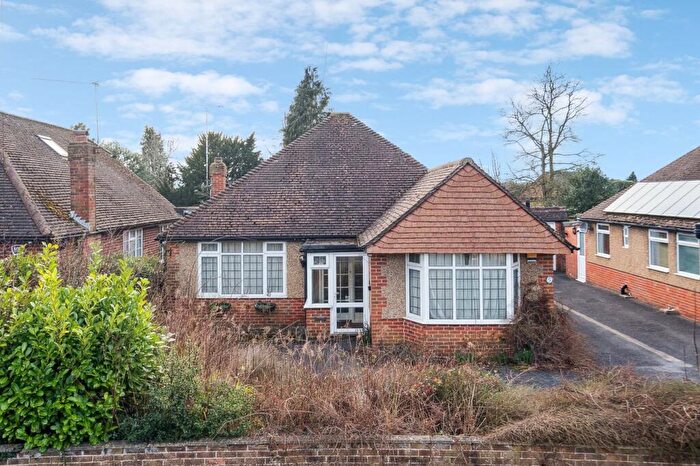
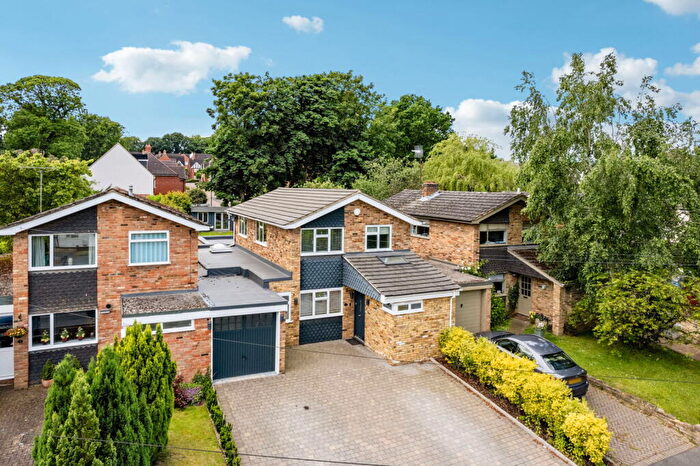
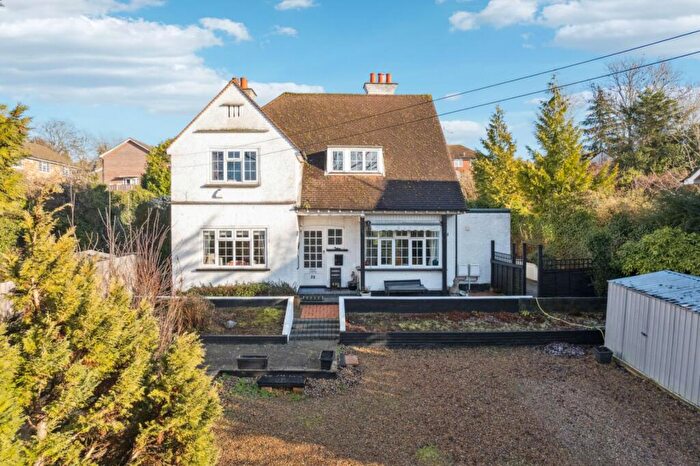
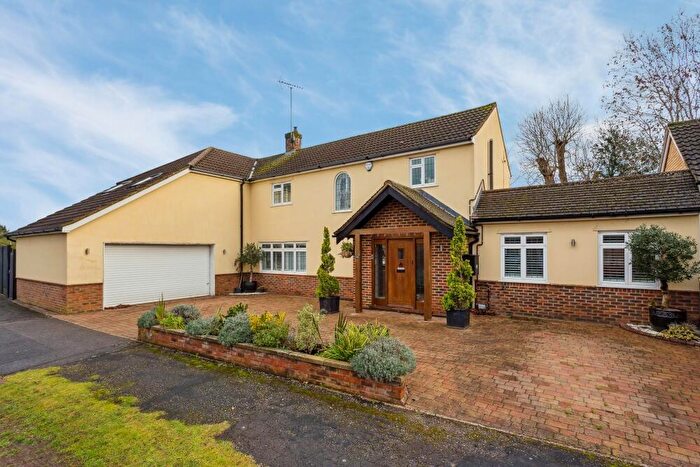
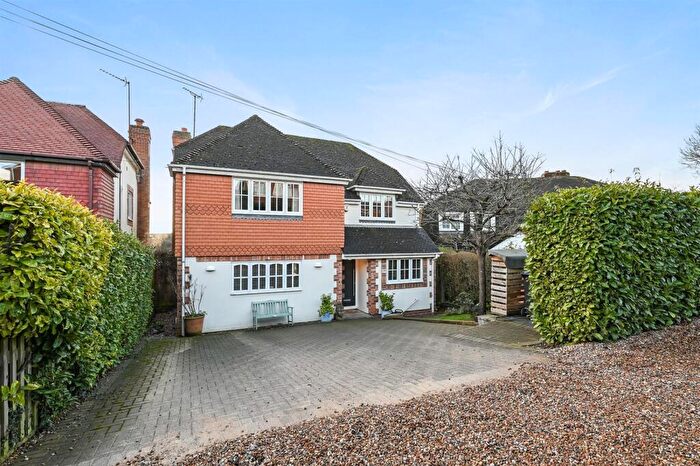
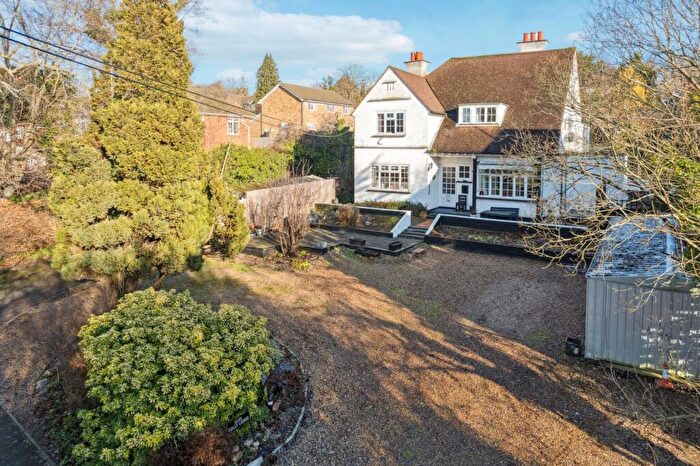
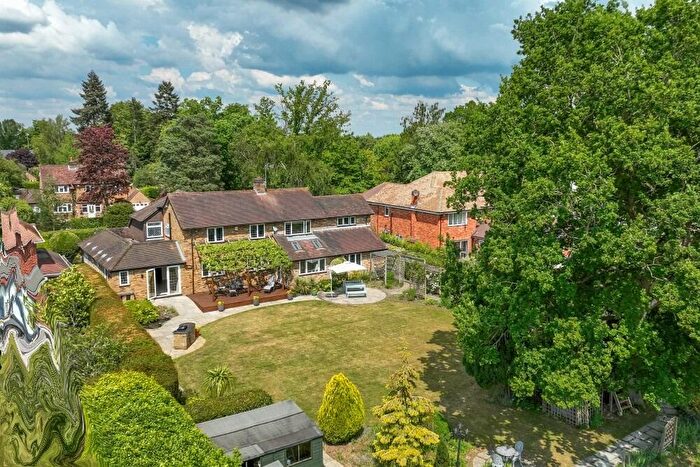
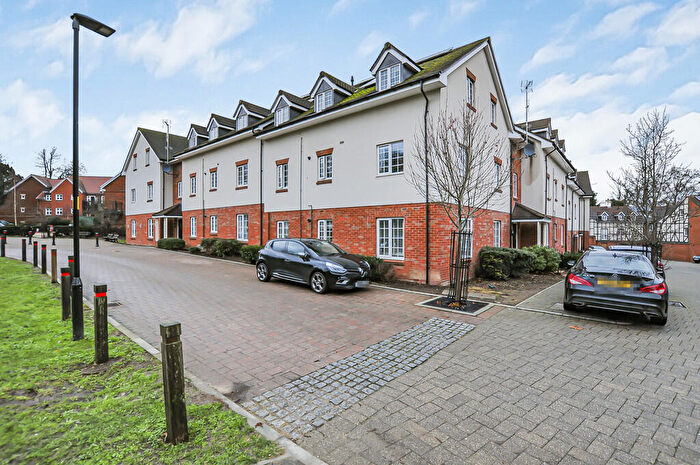
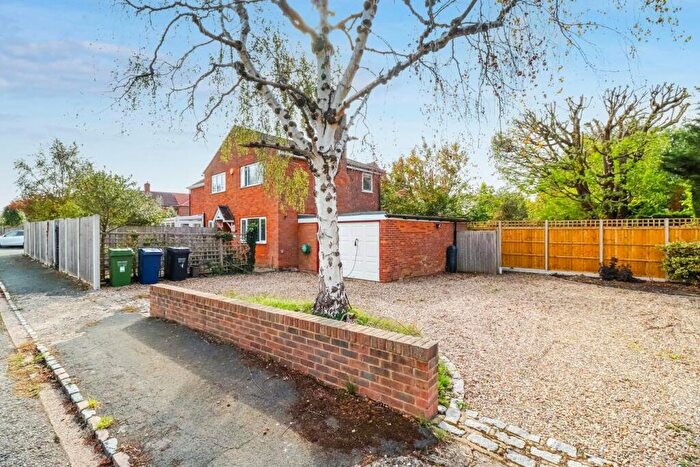
Houses for sale & to rent in Chalfont Common, Gerrards Cross
House Prices in Chalfont Common
Properties in Chalfont Common have an average house price of £849,894.00 and had 116 Property Transactions within the last 3 years¹.
Chalfont Common is an area in Gerrards Cross, Buckinghamshire with 1,425 households², where the most expensive property was sold for £2,100,000.00.
Properties for sale in Chalfont Common
Roads and Postcodes in Chalfont Common
Navigate through our locations to find the location of your next house in Chalfont Common, Gerrards Cross for sale or to rent.
| Streets | Postcodes |
|---|---|
| Amersham Road | SL9 0NY SL9 0NZ SL9 0PA SL9 0PB |
| Bartletts Hillside Close | SL9 0HH |
| Bramble Close | SL9 0JP |
| Brawlings Lane | SL9 0RE |
| By Wood End | SL9 0NQ |
| Cedars Close | SL9 0LL |
| Cherry Acre | SL9 0SX |
| Chesham Lane | SL9 0LE SL9 0LH SL9 0LJ SL9 0LW SL9 0PG SL9 0PJ |
| Cooks Close | SL9 0RX |
| Copper Ridge | SL9 0NF |
| Copthall Close | SL9 0DH |
| Copthall Corner | SL9 0BZ |
| Copthall Lane | SL9 0BX SL9 0BY SL9 0DB SL9 0DG SL9 0DJ SL9 0DQ SL9 0DS |
| Cross Lanes | SL9 0LR SL9 0LT SL9 0LU SL9 0NE |
| Cross Lanes Close | SL9 0LS |
| Deanacre Close | SL9 0NW |
| Deancroft Road | SL9 0HF |
| Denham Lane | SL9 0EP SL9 0ER SL9 0ES SL9 0ET SL9 0EU SL9 0EW SL9 0EX SL9 0EY |
| Denham Walk | SL9 0EN |
| Fernsleigh Close | SL9 0HR |
| Foxdell Way | SL9 0PL SL9 0PN |
| Gables Close | SL9 0PR |
| Garners Close | SL9 0HB |
| Garners End | SL9 0HE |
| Garners Road | SL9 0EZ SL9 0HA |
| Glynswood | SL9 0DP |
| Gravel Hill | SL9 0NP SL9 0NS SL9 0NT SL9 0NU |
| Greenfield End | SL9 0DW |
| Hedgerow | SL9 0HD |
| Highlands Close | SL9 0DR |
| Highlands End | SL9 0DN |
| Highlands Lane | SL9 0DL |
| Hill House Close | SL9 0HW |
| Hillside Close | SL9 0HJ SL9 0HN |
| Hollytree Close | SL9 0JL |
| Llanbury Close | SL9 0DF |
| Mark Drive | SL9 0PP |
| Mid Cross Lane | SL9 0LF |
| Misbourne Avenue | SL9 0PD SL9 0PF |
| Misbourne Close | SL9 0PT |
| Misbourne Vale | SL9 0NN |
| Monument Lane | SL9 0HT SL9 0HU SL9 0HX SL9 0HY SL9 0JB |
| Northdown Road | SL9 0LG SL9 0LQ |
| Nortoft Road | SL9 0LA SL9 0LB SL9 0LD |
| Old Mead | SL9 0SE |
| Peter Hill Close | SL9 0HZ |
| Pheasant Walk | SL9 0PW |
| Ravensmead | SL9 0NB |
| Rickmansworth Lane | SL9 0HG SL9 0HS SL9 0JR SL9 0JS SL9 0JY SL9 0JZ SL9 0LX SL9 0LY SL9 0LZ SL9 0NA SL9 0NG SL9 0QU SL9 0RG SL9 0RQ |
| Ridgemount End | SL9 0SA |
| Roberts Lane | SL9 0QR |
| Roberts Wood Drive | SL9 0NH |
| Robins Orchard | SL9 0HQ |
| Robson Close | SL9 0PS |
| Scholars Walk | SL9 0EJ |
| Southcliffe Drive | SL9 0SD |
| The Dell | SL9 0JA |
| The Drey | SL9 0SZ |
| The Paddock | SL9 0JG SL9 0JH SL9 0JJ SL9 0JQ |
| The Phygtle | SL9 0JT SL9 0JU SL9 0JX |
| Wheatley Way | SL9 0JE SL9 0JF |
| Wheelers Orchard | SL9 0HL |
| White House Close | SL9 0DA |
Transport near Chalfont Common
- FAQ
- Price Paid By Year
- Property Type Price
Frequently asked questions about Chalfont Common
What is the average price for a property for sale in Chalfont Common?
The average price for a property for sale in Chalfont Common is £849,894. This amount is 11% lower than the average price in Gerrards Cross. There are 696 property listings for sale in Chalfont Common.
What streets have the most expensive properties for sale in Chalfont Common?
The streets with the most expensive properties for sale in Chalfont Common are Chesham Lane at an average of £1,500,000, Nortoft Road at an average of £1,395,000 and Garners Close at an average of £1,195,000.
What streets have the most affordable properties for sale in Chalfont Common?
The streets with the most affordable properties for sale in Chalfont Common are Bartletts Hillside Close at an average of £297,000, Hillside Close at an average of £441,000 and Garners Road at an average of £570,000.
Which train stations are available in or near Chalfont Common?
Some of the train stations available in or near Chalfont Common are Gerrards Cross, Seer Green and Denham Golf Club.
Which tube stations are available in or near Chalfont Common?
The tube station available in or near Chalfont Common is Chorleywood.
Property Price Paid in Chalfont Common by Year
The average sold property price by year was:
| Year | Average Sold Price | Price Change |
Sold Properties
|
|---|---|---|---|
| 2025 | £832,473 | 6% |
43 Properties |
| 2024 | £784,589 | -21% |
39 Properties |
| 2023 | £946,835 | 5% |
34 Properties |
| 2022 | £899,109 | 12% |
48 Properties |
| 2021 | £792,161 | 5% |
77 Properties |
| 2020 | £753,413 | 5% |
46 Properties |
| 2019 | £713,087 | -0,5% |
51 Properties |
| 2018 | £716,351 | 3% |
42 Properties |
| 2017 | £694,760 | -9% |
50 Properties |
| 2016 | £756,815 | 17% |
41 Properties |
| 2015 | £627,744 | 7% |
56 Properties |
| 2014 | £580,694 | 8% |
69 Properties |
| 2013 | £535,119 | -0,3% |
51 Properties |
| 2012 | £536,739 | -2% |
46 Properties |
| 2011 | £546,346 | 7% |
41 Properties |
| 2010 | £509,656 | 9% |
54 Properties |
| 2009 | £465,146 | -7% |
47 Properties |
| 2008 | £497,857 | -3% |
39 Properties |
| 2007 | £511,995 | 7% |
63 Properties |
| 2006 | £475,709 | 6% |
72 Properties |
| 2005 | £446,499 | -1% |
47 Properties |
| 2004 | £452,951 | 9% |
60 Properties |
| 2003 | £412,049 | 12% |
73 Properties |
| 2002 | £363,813 | 6% |
62 Properties |
| 2001 | £341,077 | 3% |
98 Properties |
| 2000 | £329,812 | 26% |
72 Properties |
| 1999 | £243,448 | 5% |
70 Properties |
| 1998 | £232,007 | 16% |
77 Properties |
| 1997 | £194,804 | 12% |
45 Properties |
| 1996 | £172,111 | - |
83 Properties |
| 1995 | £172,132 | - |
55 Properties |
Property Price per Property Type in Chalfont Common
Here you can find historic sold price data in order to help with your property search.
The average Property Paid Price for specific property types in the last three years are:
| Property Type | Average Sold Price | Sold Properties |
|---|---|---|
| Semi Detached House | £720,733.00 | 12 Semi Detached Houses |
| Detached House | £909,668.00 | 92 Detached Houses |
| Terraced House | £692,916.00 | 6 Terraced Houses |
| Flat | £348,666.00 | 6 Flats |

