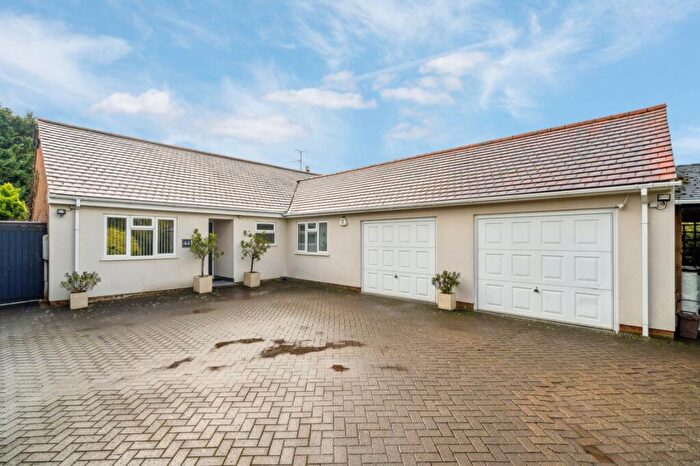
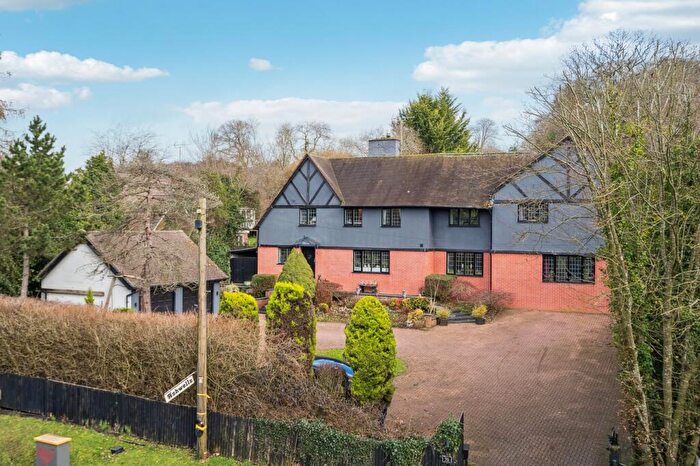
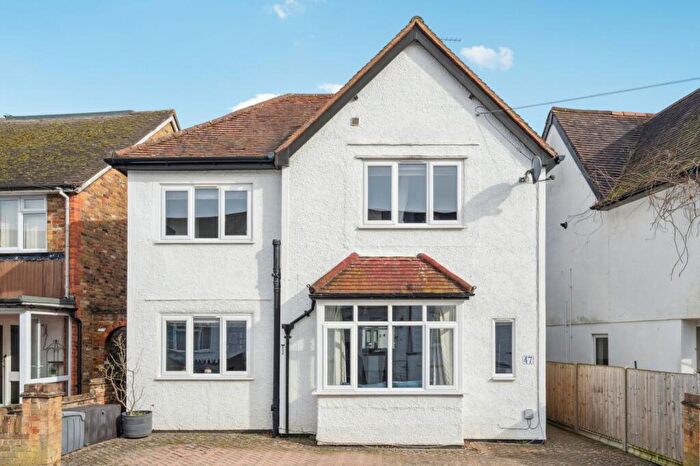
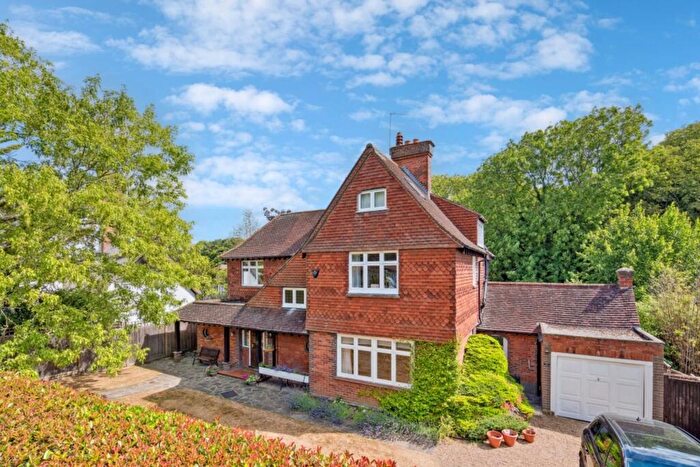
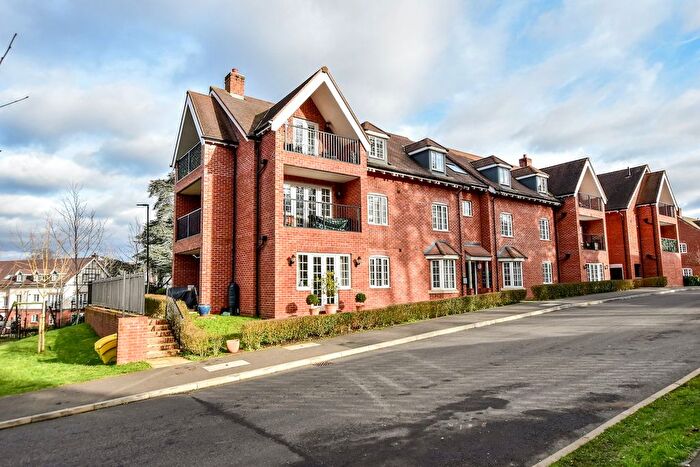
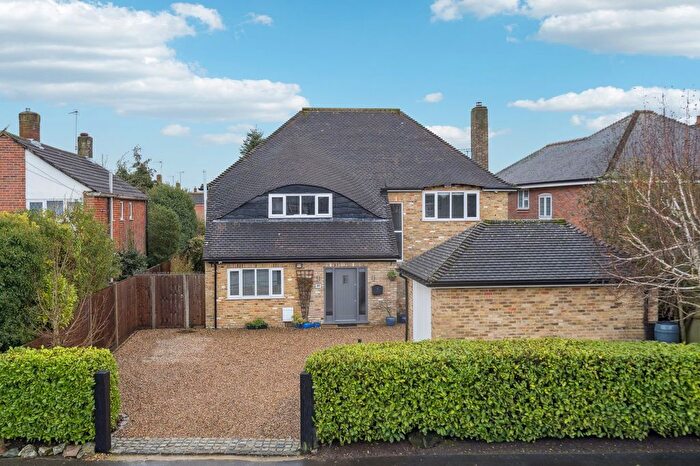
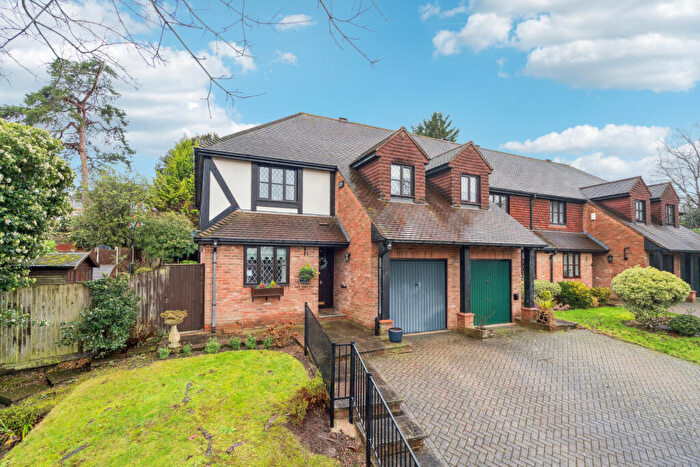
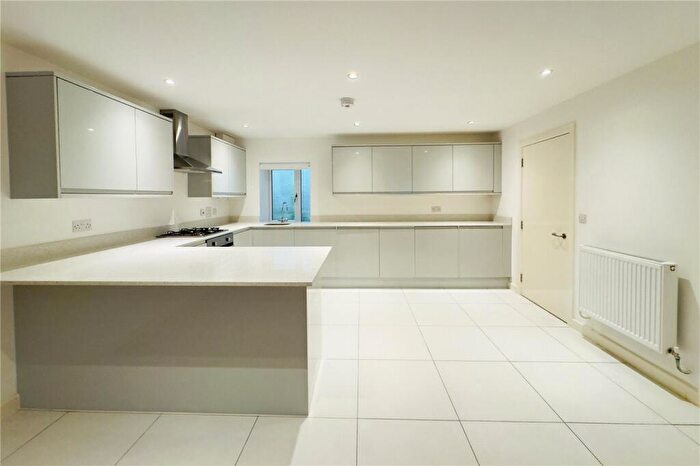
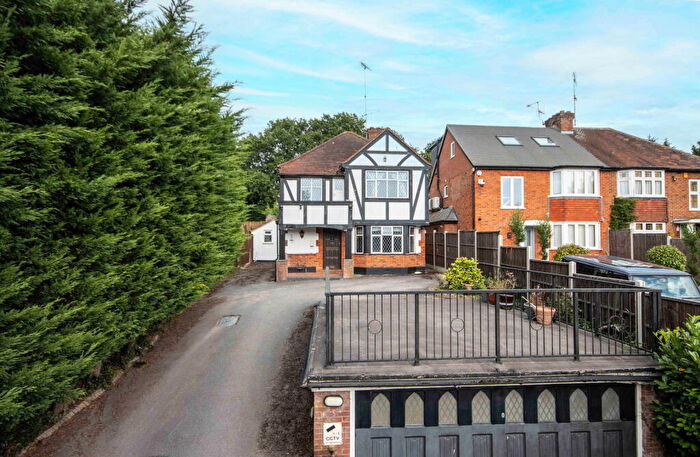
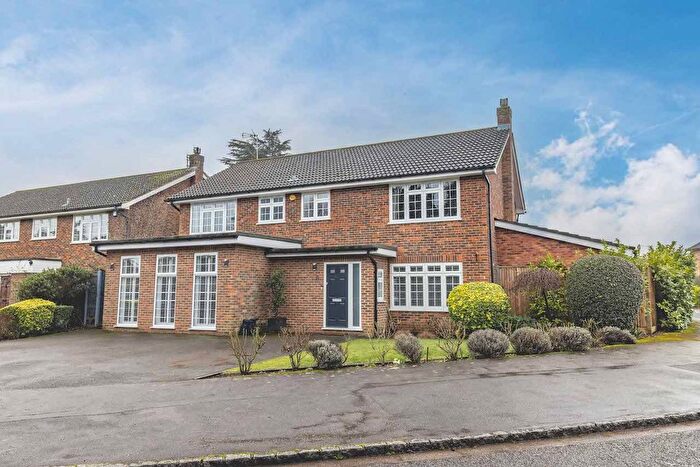
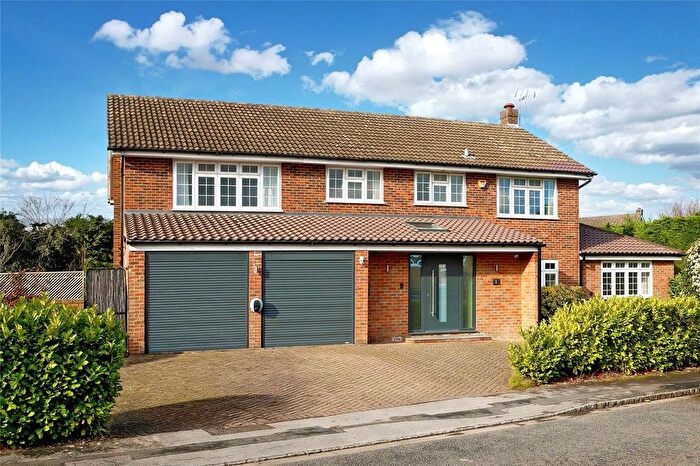
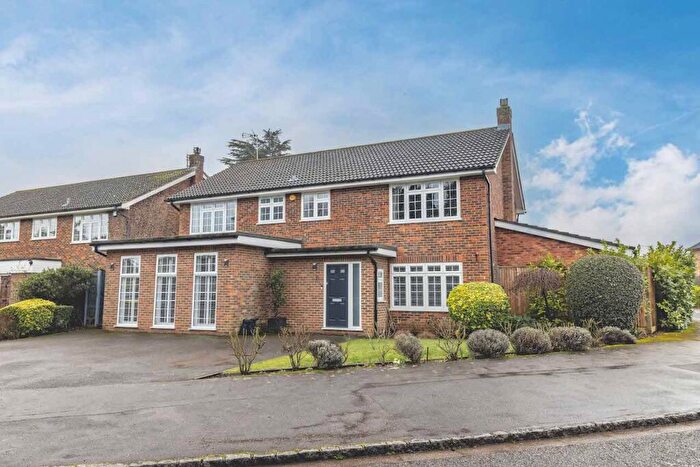
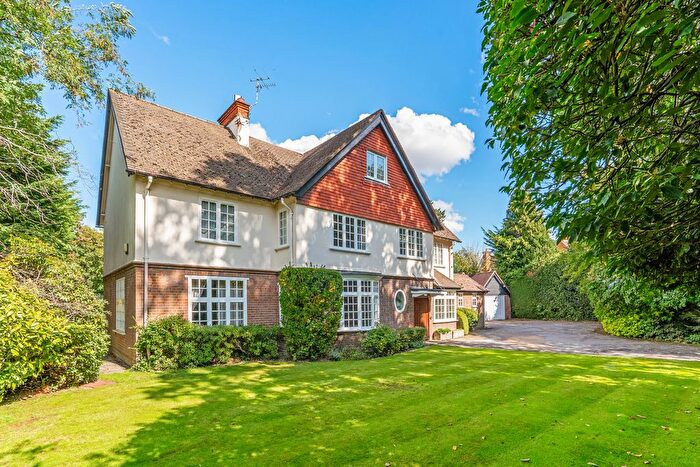
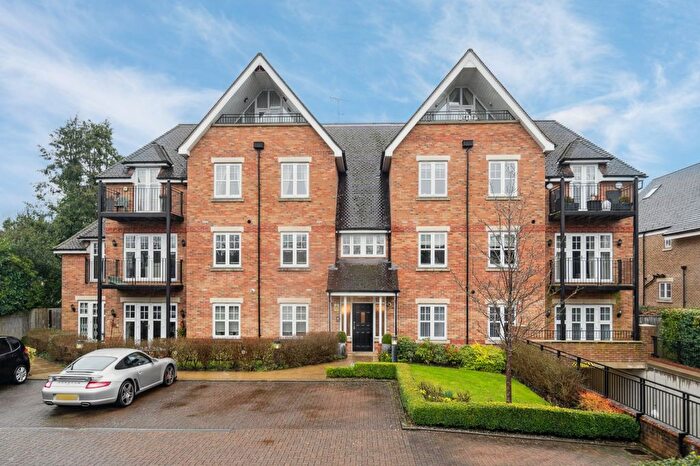
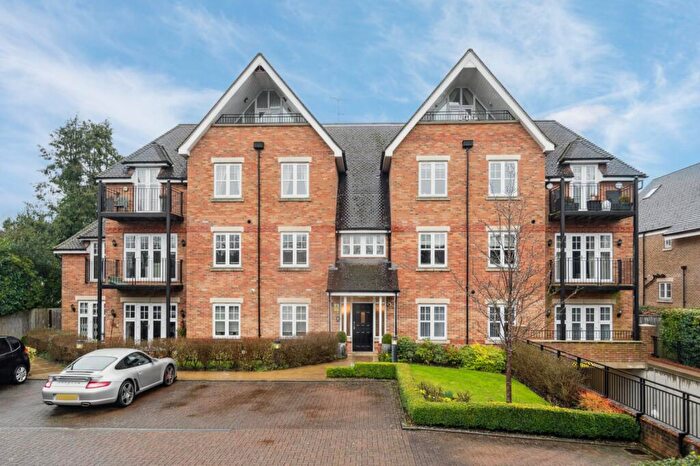
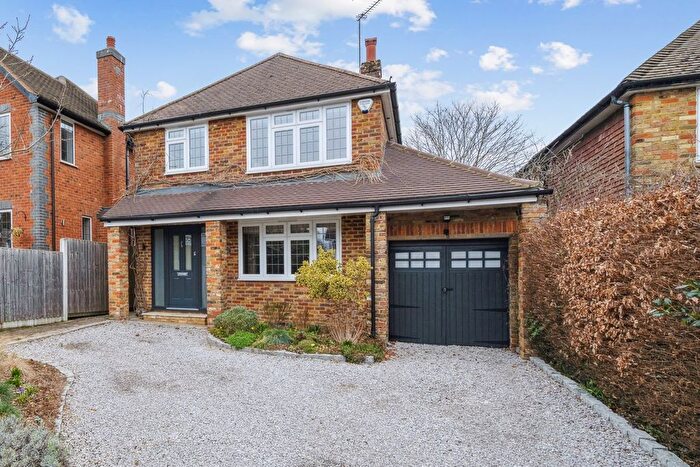
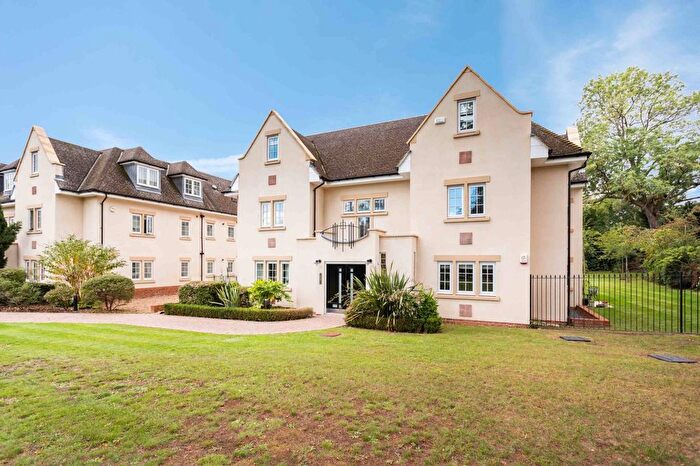
Houses for sale & to rent in Chalfont St Peter, Gerrards Cross
House Prices in Chalfont St Peter
Properties in Chalfont St Peter have an average house price of £600,387.00 and had 56 Property Transactions within the last 3 years¹.
Chalfont St Peter is an area in Gerrards Cross, Buckinghamshire with 183 households², where the most expensive property was sold for £1,875,000.00.
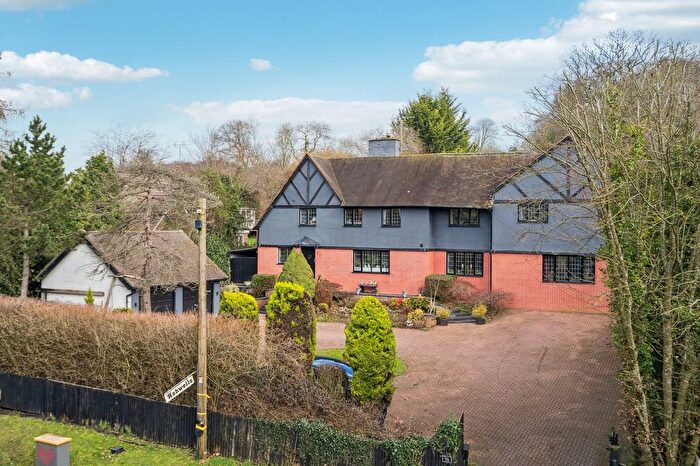
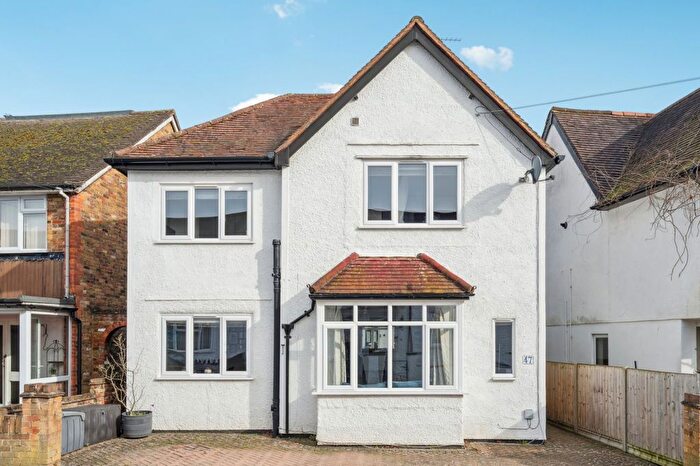
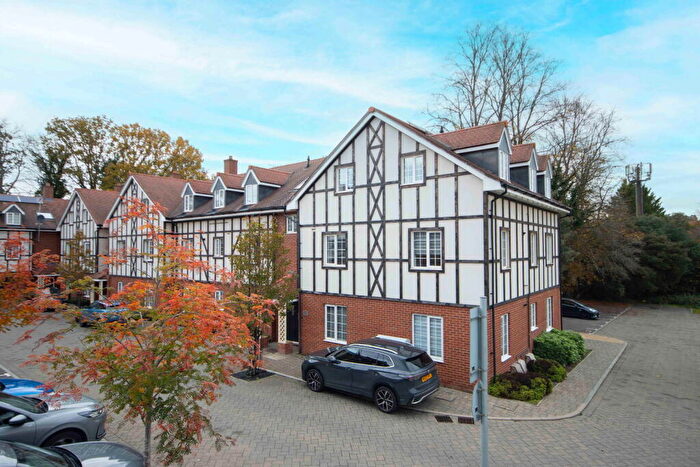
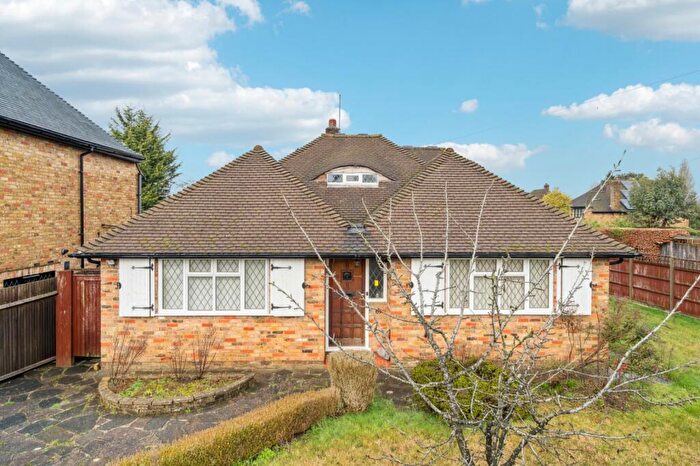
Properties for sale in Chalfont St Peter
Roads and Postcodes in Chalfont St Peter
Navigate through our locations to find the location of your next house in Chalfont St Peter, Gerrards Cross for sale or to rent.
| Streets | Postcodes |
|---|---|
| Austenwood Common | SL9 8SG |
| Bull Lane | SL9 8RJ SL9 8RN |
| Chalfont Centre For Epilepsy | SL9 0RN SL9 0RP |
| Chalfont Dene | SL9 0ED SL9 0EH SL9 0EQ SL9 0FD SL9 0FJ SL9 0FL SL9 0FN SL9 0FP SL9 0FQ SL9 0FR SL9 0FS SL9 0FT SL9 0FU |
| Chalfont Lane | WD3 9XW |
| Chalfont Park | SL9 0BG SL9 0DZ SL9 0GA SL9 0QA SL9 0FW SL9 0FX |
| Chesham Lane | SL9 0LP SL9 0PH SL9 0PQ SL9 0RL |
| Chiltern Hill | SL9 9FG SL9 9TL SL9 9UE SL9 9YZ |
| Church Lane | SL9 9RE SL9 9RR SL9 9RF |
| Churchfield Road | SL9 9EW SL9 9FR |
| Claydon Lane | SL9 8LE |
| Copthall Lane | SL9 0BU |
| Deanacre Close | SL9 0NX |
| Denham Lane | SL9 0QQ SL9 0QW |
| Drummond Crescent | SL9 9FT |
| Drury Close | SL9 0FH |
| Glebe Close | SL9 9NU |
| Grange Road | SL9 9AH SL9 9DW SL9 9FB SL9 9FF SL9 9FH SL9 9FL SL9 9FN SL9 9FP SL9 9FQ SL9 9FS |
| Gravel Hill | SL9 9QX |
| Hampden Road | SL9 9DR SL9 9SA SL9 9SX |
| High Street | SL9 9QL SL9 9QQ |
| Hiljon Crescent | SL9 9TP |
| Joiners Lane | SL9 0AD |
| Lovel Mead | SL9 9PR |
| Lower Road | SL9 9AQ |
| Maltmans Lane | SL9 8RR |
| Market Place | SL9 9HE |
| Marple Lane | SL9 9FU |
| Micholls Avenue | SL9 0EB |
| Morris Close | SL9 0AP SL9 0AR |
| North Park | SL9 8JA |
| Osborne Place | SL9 0FB |
| Oval Way | SL9 8QA |
| Penn Road | SL9 9RL SL9 9SS |
| Rickmansworth Lane | SL9 0QT |
| Saunders Place | SL9 0FF |
| Selman Way | SL9 0FE |
| Shire Lane | SL9 0EA SL9 0QX |
| South Side | SL9 8LU |
| St Peters Court | SL9 9RH |
| Tate Road | SL9 0RH |
| The Broadway | SL9 9DX |
| The Vale | SL9 9RZ |
| Upway | SL9 0AG |
| West Hyde Lane | SL9 0QP |
| Wheatley Way | SL9 0JD |
| Whitchurch Terrace | SL9 0FA |
| Wilkens Place | SL9 0FG |
| Windmill Road | SL9 9PP SL9 9PW |
| SL9 0RJ |
Transport near Chalfont St Peter
- FAQ
- Price Paid By Year
- Property Type Price
Frequently asked questions about Chalfont St Peter
What is the average price for a property for sale in Chalfont St Peter?
The average price for a property for sale in Chalfont St Peter is £600,387. This amount is 37% lower than the average price in Gerrards Cross. There are 1,864 property listings for sale in Chalfont St Peter.
What streets have the most expensive properties for sale in Chalfont St Peter?
The streets with the most expensive properties for sale in Chalfont St Peter are Upway at an average of £1,875,000, Bull Lane at an average of £1,471,000 and Copthall Lane at an average of £1,150,000.
What streets have the most affordable properties for sale in Chalfont St Peter?
The streets with the most affordable properties for sale in Chalfont St Peter are Churchfield Road at an average of £225,000, Marple Lane at an average of £343,605 and Grange Road at an average of £394,255.
Which train stations are available in or near Chalfont St Peter?
Some of the train stations available in or near Chalfont St Peter are Gerrards Cross, Seer Green and Denham Golf Club.
Property Price Paid in Chalfont St Peter by Year
The average sold property price by year was:
| Year | Average Sold Price | Price Change |
Sold Properties
|
|---|---|---|---|
| 2025 | £459,321 | -51% |
14 Properties |
| 2024 | £693,186 | 13% |
21 Properties |
| 2023 | £601,632 | 17% |
21 Properties |
| 2022 | £496,590 | -18% |
17 Properties |
| 2021 | £587,999 | 6% |
19 Properties |
| 2020 | £552,726 | -0,4% |
11 Properties |
| 2019 | £554,810 | 8% |
66 Properties |
| 2018 | £511,014 | -17% |
96 Properties |
| 2017 | £596,338 | -12% |
67 Properties |
| 2016 | £666,918 | -1% |
49 Properties |
| 2015 | £672,435 | -46% |
8 Properties |
| 2010 | £980,000 | 51% |
1 Property |
| 2008 | £480,000 | 70% |
1 Property |
| 1998 | £145,000 | - |
1 Property |
Property Price per Property Type in Chalfont St Peter
Here you can find historic sold price data in order to help with your property search.
The average Property Paid Price for specific property types in the last three years are:
| Property Type | Average Sold Price | Sold Properties |
|---|---|---|
| Detached House | £1,270,857.00 | 7 Detached Houses |
| Flat | £493,102.00 | 46 Flats |
| Terraced House | £556,500.00 | 2 Terraced Houses |
| Semi Detached House | £930,000.00 | 1 Semi Detached House |

