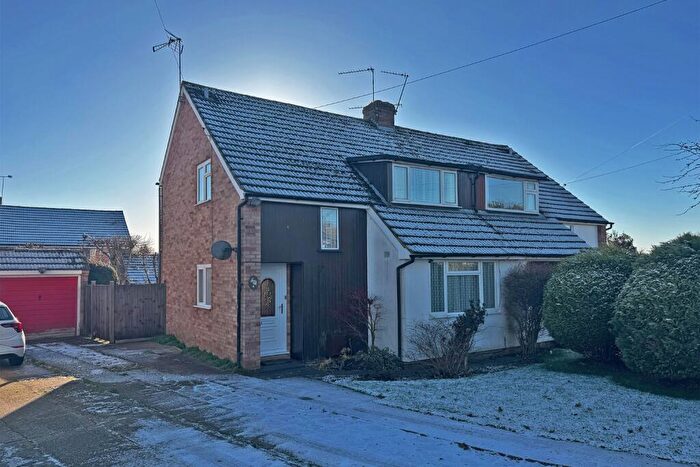
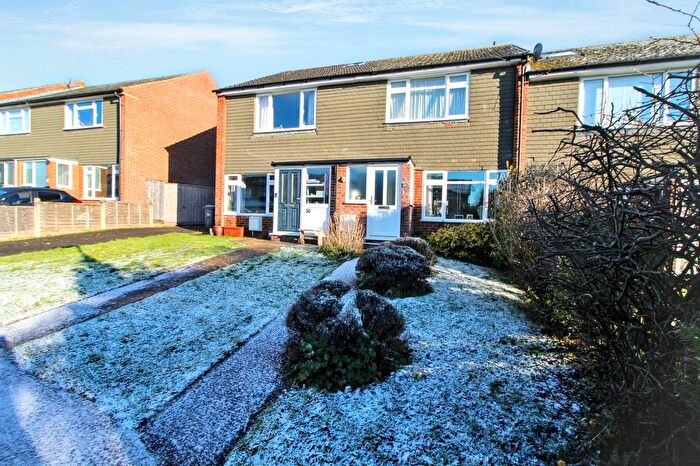
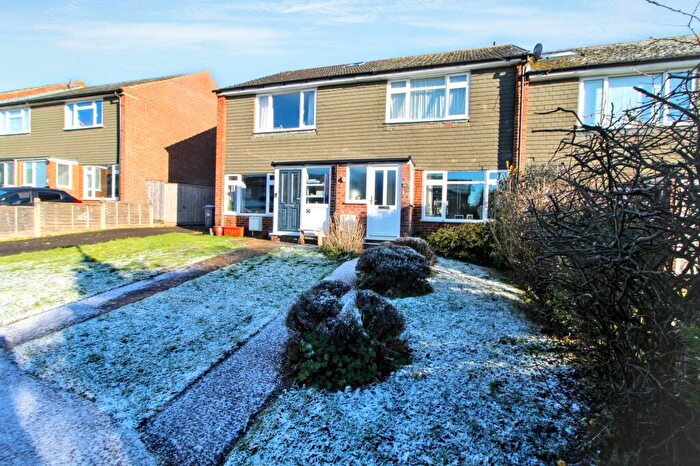
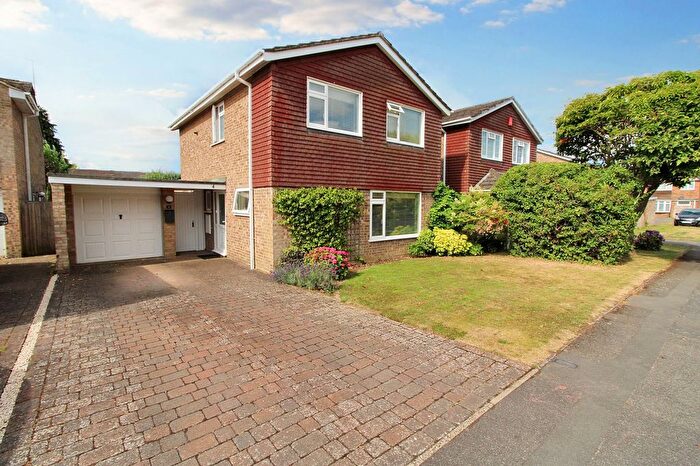
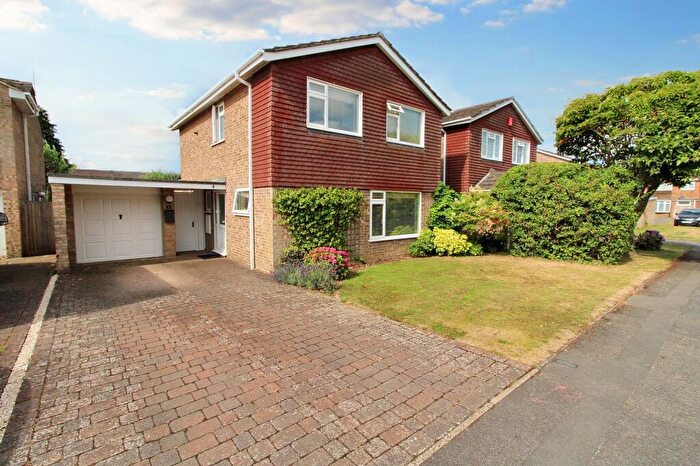
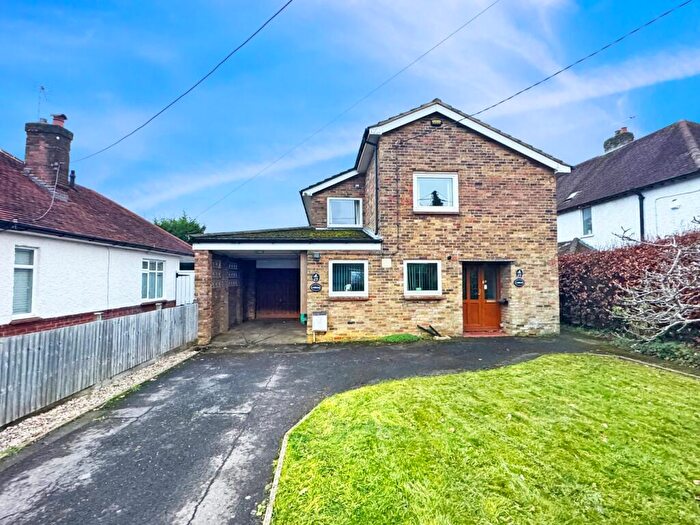
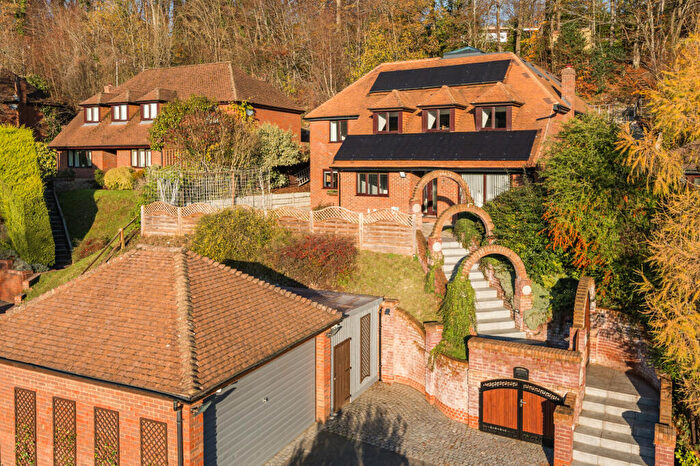
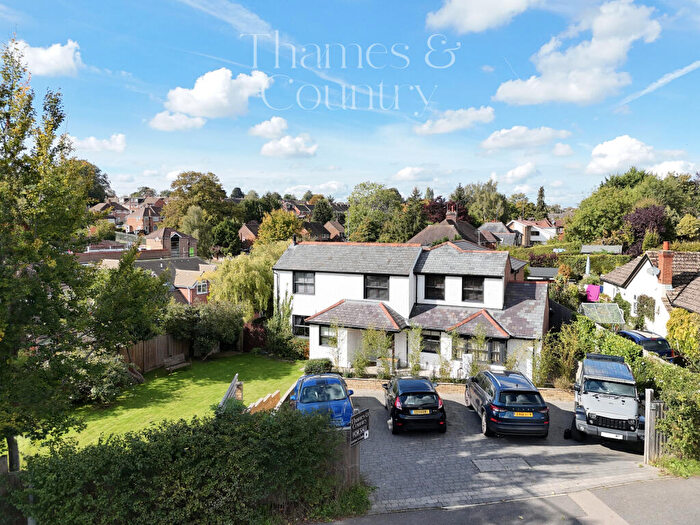
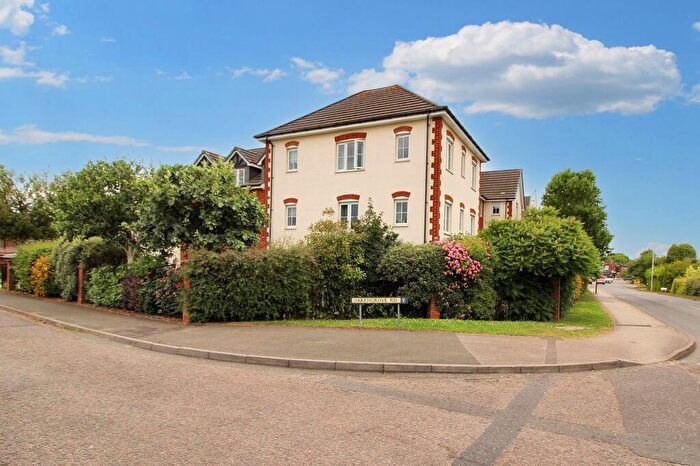
Houses for sale & to rent in Hazlemere North, High Wycombe
House Prices in Hazlemere North
Properties in Hazlemere North have an average house price of £542,445.00 and had 246 Property Transactions within the last 3 years¹.
Hazlemere North is an area in High Wycombe, Buckinghamshire with 1,837 households², where the most expensive property was sold for £1,250,000.00.
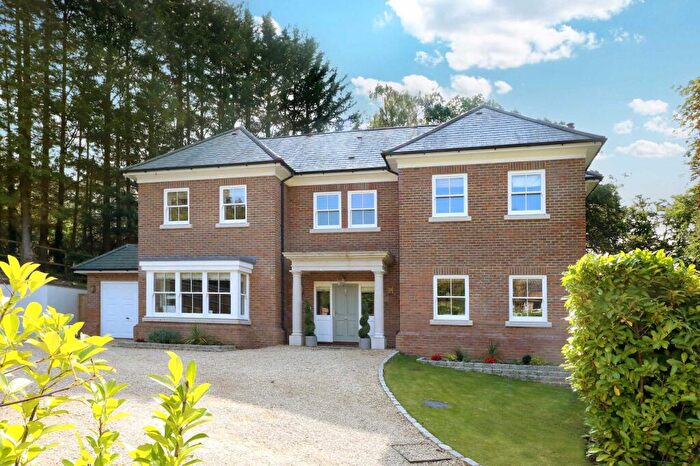
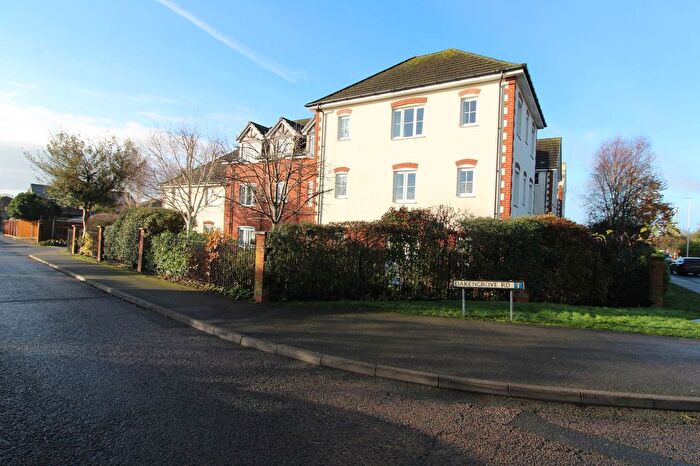
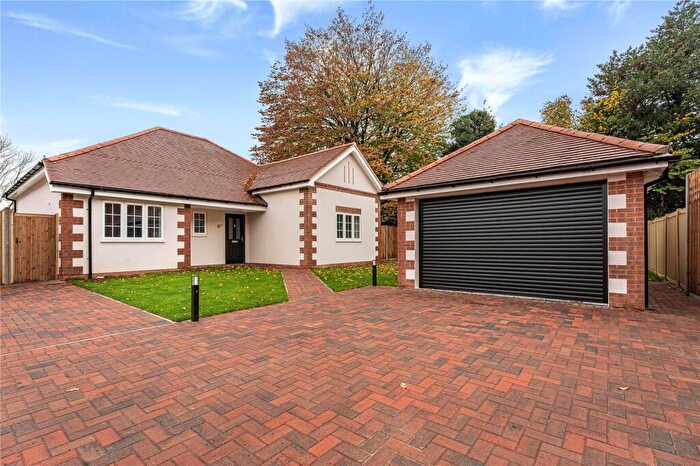
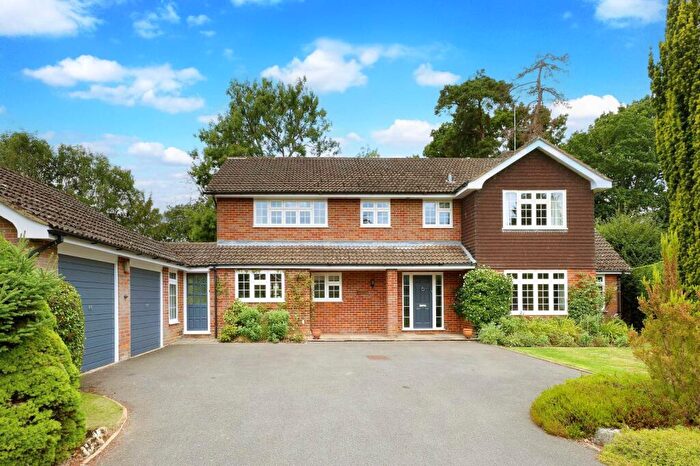
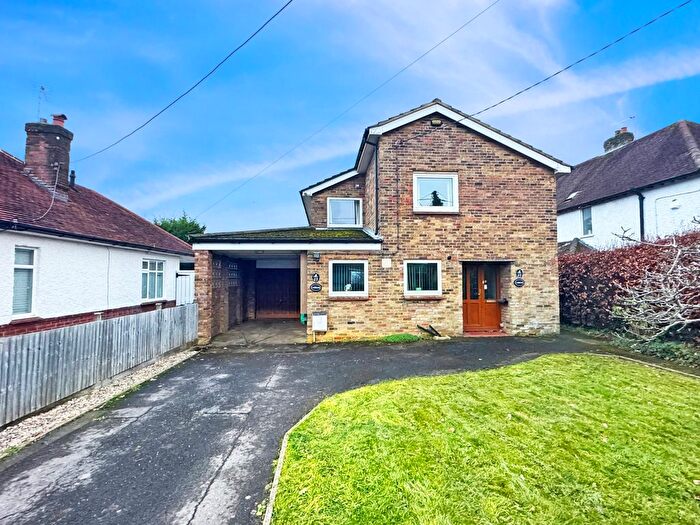
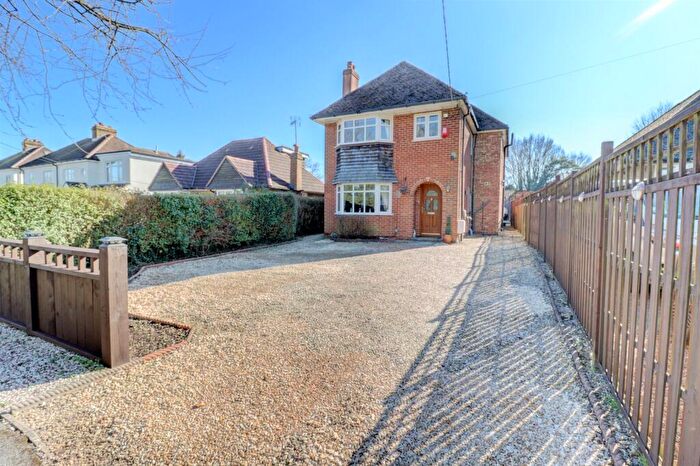
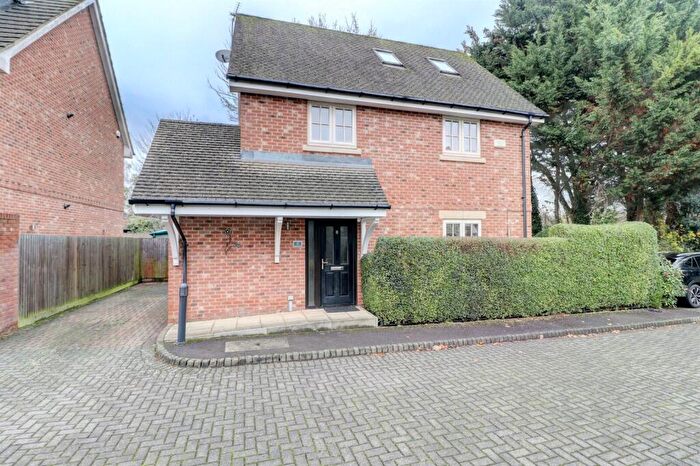
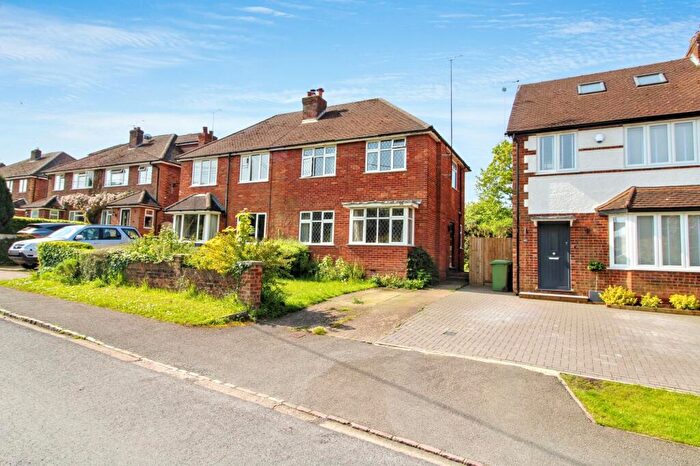
Properties for sale in Hazlemere North
Roads and Postcodes in Hazlemere North
Navigate through our locations to find the location of your next house in Hazlemere North, High Wycombe for sale or to rent.
| Streets | Postcodes |
|---|---|
| Amersham Road | HP15 7AX HP15 7HL HP15 7HR HP15 7HU HP15 7JA HP15 7JG HP15 7PX HP15 7QA HP15 7QW HP15 7QX |
| Badger Way | HP15 7LJ |
| Beaumont Grove | HP15 7RY |
| Beaumont Way | HP15 7BD HP15 7BE |
| Brackley Drive | HP15 7EZ |
| Brackley Road | HP15 7EW HP15 7EY HP15 7HA |
| Cedar Avenue | HP15 7AP HP15 7AW HP15 7BG HP15 7DL HP15 7DW HP15 7EA HP15 7EE HP15 7EF |
| Cherry Way | HP15 7HD |
| Chestnut Lane | HP15 7BZ |
| Chiltern Lane | HP15 7BN |
| Clauds Close | HP15 7AE |
| Copes Shroves | HP15 7AG HP15 7AH HP15 7AL |
| Eastern Dene | HP15 7BS HP15 7BT |
| Farndale Gardens | HP15 7HE |
| Fernside | HP15 7EU |
| Fox Field | HP15 7AQ |
| Grange Road | HP15 7QZ |
| Grange View | HP15 7HQ |
| Green Street | HP15 7RA HP15 7RB |
| Grove Road | HP15 7QY |
| Hazlemere View | HP15 7BY |
| Hill Avenue | HP15 7JU HP15 7JX |
| Holmer Green Road | HP15 7BB HP15 7BL HP15 7BW |
| Inkerman Drive | HP15 7JJ HP15 7JW |
| Inkerman Hill | HP15 7JH |
| James Close | HP15 7EX |
| Kestrel Drive | HP15 7JL |
| Laceys Drive | HP15 7JY |
| Lark Rise | HP15 7JF |
| Lester Grove | HP15 7HW |
| Lower Lodge Lane | HP15 7AT |
| Market Parade | HP15 7LQ |
| Marys Mead | HP15 7DR HP15 7DS HP15 7DT HP15 7DY HP15 7DZ |
| Maurice Mount | HP15 7AJ |
| Maxwell Drive | HP15 7BX |
| Nightingale Close | HP15 7JZ |
| Orchard End | HP15 7DF |
| Park Lane | HP15 7HY HP15 7HZ |
| Park Parade Centre | HP15 7AA |
| Pheasants Drive | HP15 7JT |
| Ralphs Retreat | HP15 7DU |
| Roberts Ride | HP15 7AD HP15 7AF HP15 7AN HP15 7DP |
| Sanctuary Road | HP15 7JS |
| Sawpit Hill | HP15 7DB HP15 7DD HP15 7DE |
| Shepherds Lane | HP15 7AR |
| Southfield Drive | HP15 7HB |
| Swallow Drive | HP15 7JB |
| The Orchard | HP15 7DG |
| The Warren | HP15 7ED |
| Toms Turn | HP15 7DX |
| Trinity Road | HP15 7QB |
| Upper Lodge Lane | HP15 7AS |
| Watchet Lane | HP15 6TZ |
| Western Dene | HP15 7EN HP15 7EP |
| Willow Chase | HP15 7QP |
Transport near Hazlemere North
- FAQ
- Price Paid By Year
- Property Type Price
Frequently asked questions about Hazlemere North
What is the average price for a property for sale in Hazlemere North?
The average price for a property for sale in Hazlemere North is £542,445. This amount is 18% higher than the average price in High Wycombe. There are 1,004 property listings for sale in Hazlemere North.
What streets have the most expensive properties for sale in Hazlemere North?
The streets with the most expensive properties for sale in Hazlemere North are Willow Chase at an average of £830,000, Grange Road at an average of £800,000 and Maxwell Drive at an average of £725,000.
What streets have the most affordable properties for sale in Hazlemere North?
The streets with the most affordable properties for sale in Hazlemere North are Grange View at an average of £311,000, Brackley Drive at an average of £357,000 and Farndale Gardens at an average of £407,500.
Which train stations are available in or near Hazlemere North?
Some of the train stations available in or near Hazlemere North are High Wycombe, Great Missenden and Beaconsfield.
Which tube stations are available in or near Hazlemere North?
The tube station available in or near Hazlemere North is Amersham.
Property Price Paid in Hazlemere North by Year
The average sold property price by year was:
| Year | Average Sold Price | Price Change |
Sold Properties
|
|---|---|---|---|
| 2025 | £571,134 | 7% |
42 Properties |
| 2024 | £528,338 | 0,4% |
73 Properties |
| 2023 | £525,967 | -6% |
67 Properties |
| 2022 | £556,959 | -19% |
64 Properties |
| 2021 | £663,862 | 25% |
106 Properties |
| 2020 | £499,304 | 9% |
67 Properties |
| 2019 | £454,764 | -6% |
86 Properties |
| 2018 | £484,251 | -6% |
68 Properties |
| 2017 | £514,262 | 10% |
68 Properties |
| 2016 | £462,358 | 8% |
72 Properties |
| 2015 | £423,290 | 7% |
82 Properties |
| 2014 | £392,622 | 18% |
93 Properties |
| 2013 | £322,552 | -9% |
90 Properties |
| 2012 | £352,524 | 1% |
89 Properties |
| 2011 | £349,344 | 9% |
43 Properties |
| 2010 | £317,006 | 5% |
53 Properties |
| 2009 | £300,677 | -16% |
69 Properties |
| 2008 | £349,802 | 6% |
38 Properties |
| 2007 | £327,809 | 7% |
86 Properties |
| 2006 | £303,640 | 7% |
119 Properties |
| 2005 | £282,201 | 0,1% |
59 Properties |
| 2004 | £281,897 | 7% |
90 Properties |
| 2003 | £263,292 | 13% |
83 Properties |
| 2002 | £230,306 | 4% |
124 Properties |
| 2001 | £220,588 | 17% |
92 Properties |
| 2000 | £183,952 | 14% |
96 Properties |
| 1999 | £157,726 | 9% |
129 Properties |
| 1998 | £143,475 | 10% |
107 Properties |
| 1997 | £128,852 | 13% |
94 Properties |
| 1996 | £112,085 | 0,4% |
113 Properties |
| 1995 | £111,600 | - |
93 Properties |
Property Price per Property Type in Hazlemere North
Here you can find historic sold price data in order to help with your property search.
The average Property Paid Price for specific property types in the last three years are:
| Property Type | Average Sold Price | Sold Properties |
|---|---|---|
| Semi Detached House | £533,544.00 | 112 Semi Detached Houses |
| Detached House | £625,703.00 | 98 Detached Houses |
| Terraced House | £396,990.00 | 15 Terraced Houses |
| Flat | £305,276.00 | 21 Flats |

