
Houses for sale in High Wycombe, Buckinghamshire
House Prices in High Wycombe
Properties in High Wycombe have an average house price of £464k and had 5,061 Property Transactions within the last 3 years.¹
High Wycombe is an area in Buckinghamshire with 54,975 households², where the most expensive property was sold for £10M.
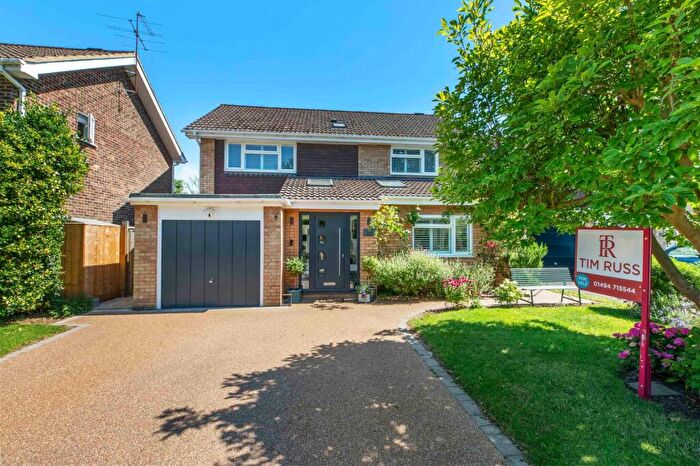
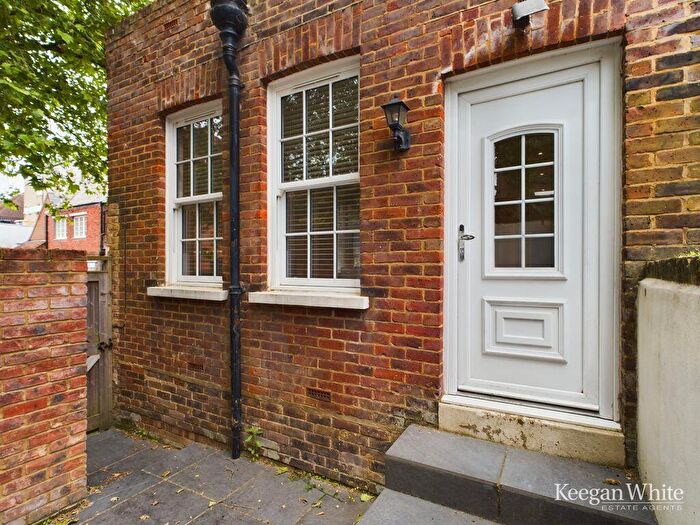
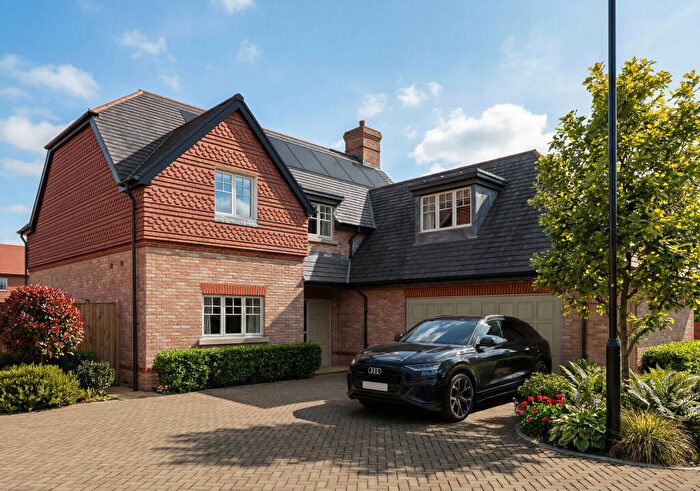
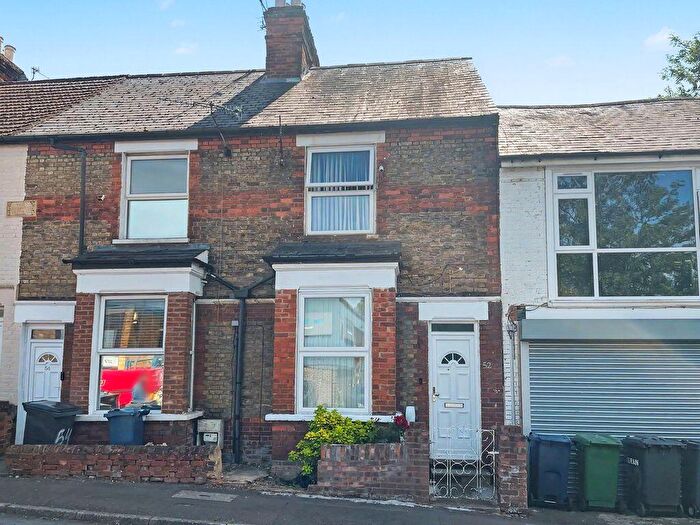
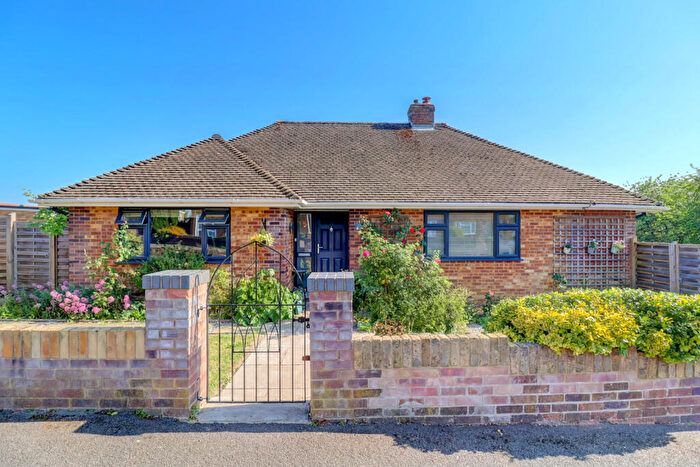
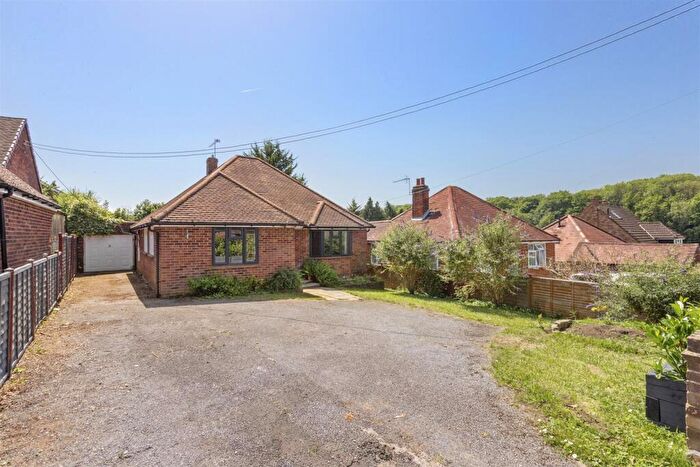
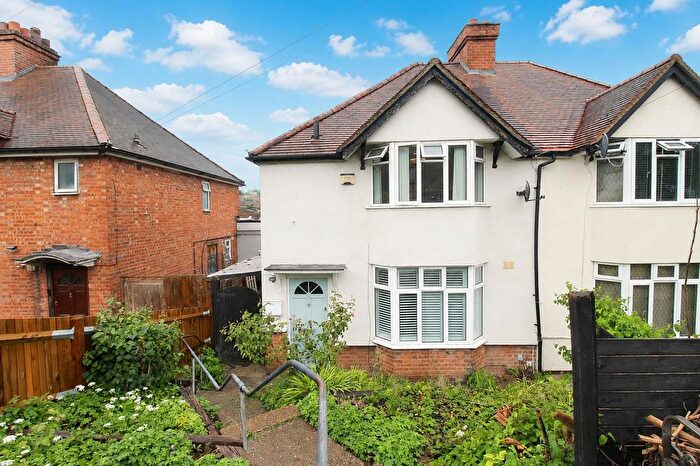
Properties for sale in High Wycombe
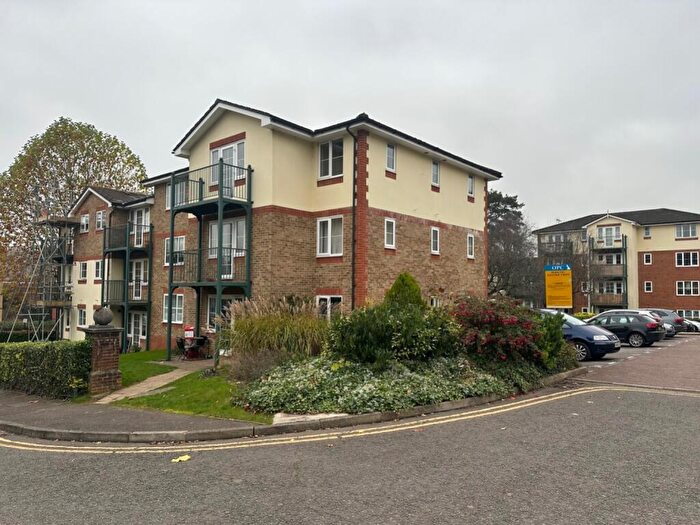
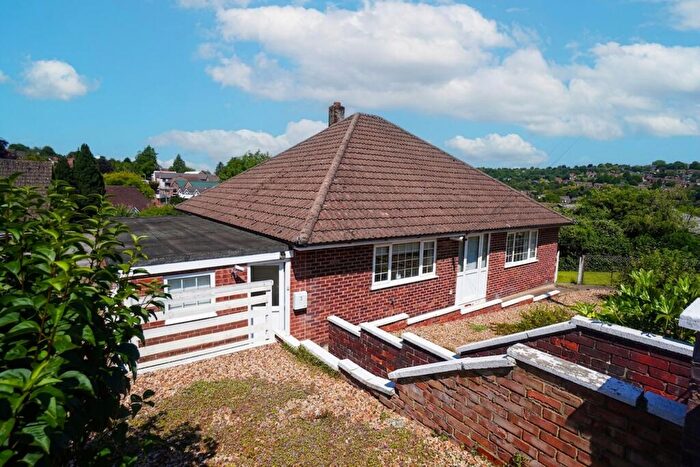
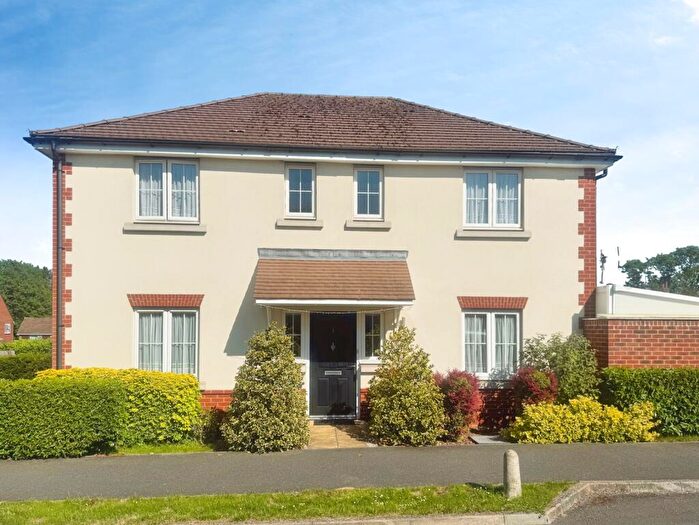
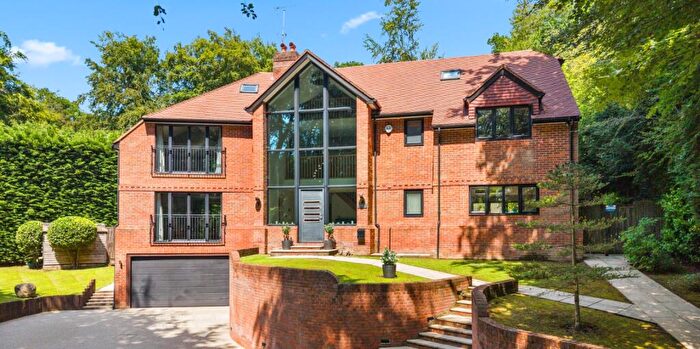
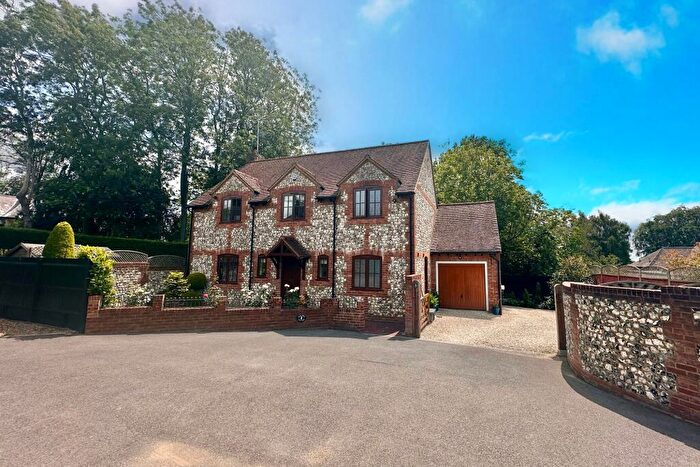
![]()
If you are looking to sell your house, let it out, or receive a property valuation, an expert can help you.
Click the button below to get started.


Neighbourhoods in High Wycombe
Navigate through our locations to find the location of your next house in High Wycombe, Buckinghamshire for sale or to rent.
- Abbey
- Beaconsfield West
- Bledlow And Bradenham
- Booker And Cressex
- Bourne End-cum-hedsor
- Bowerdean
- Chiltern Rise
- Disraeli
- Downley And Plomer Hill
- Flackwell Heath And Little Marlow
- Greater Hughenden
- Hambleden Valley
- Hazlemere North
- Hazlemere South
- Holmer Green
- Lacey Green, Speen And The Hampdens
- Micklefield
- Oakridge And Castlefield
- Penn And Coleshill
- Prestwood And Heath End
- Ryemead
- Sands
- Stokenchurch And Radnage
- Taplow
- Terriers And Amersham Hill
- The Wooburns
- Totteridge
- Tylers Green And Loudwater
- The Wooburns, Bourne End and Hedsor
- Cliveden
- Beaconsfield
- Gerrards Cross
- Penn Wood and Old Amersham
- Flackwell Heath, Little Marlow and Marlow South East
- Ryemead and Micklefield
- Booker, Cressex and Castlefield
- West Wycombe
- Downley
- Totteridge and Bowerdean
- Ridgeway West
- Chiltern Villages
- Haseley Brook
- Ridgeway East
- Hazlemere
- Chinnor
Property price trends in High Wycombe
According to the latest Land Registry data, the average home in High Wycombe sold for £438,594 in 2026. That figure comes from a substantial record of 72,148 sales logged over the past 31 years.
Prices have softened over the last three years. Compared with 2023, when the typical sale came in around £454,009, that's a fall of roughly 3.4%.
Looking back five years, average prices are down about 1.8% since 2021, a drop of around £8,039 in cash terms.
Zoom out to the past decade for the fuller picture. Back in 2016, homes here averaged £366,644, so the typical sold price has climbed about 19.6% since then, roughly 1.8% a year. Stretch the view to fifteen years and that annual pace edges up closer to 2.9%.
Frequently asked questions about High Wycombe
What is the average price for a property for sale in High Wycombe?
The average price for a property for sale in High Wycombe is £463,775. This amount is 18% lower than the average price in Buckinghamshire. There are more than 10,000 property listings for sale in High Wycombe.
What locations have the most expensive properties for sale in High Wycombe?
The locations with the most expensive properties for sale in High Wycombe are Taplow at an average of £1,890,000, Bourne End-cum-hedsor at an average of £1,700,000 and Penn Wood and Old Amersham at an average of £1,330,000.
What locations have the most affordable properties for sale in High Wycombe?
The locations with the most affordable properties for sale in High Wycombe are Oakridge And Castlefield at an average of £267,548, Booker, Cressex and Castlefield at an average of £271,843 and The Wooburns, Bourne End and Hedsor at an average of £276,184.
Which train stations are available in or near High Wycombe?
Some of the train stations available in or near High Wycombe are High Wycombe, Bourne End and Marlow.
Property Price Paid in High Wycombe by Year
The average sold property price by year was:
| Year | Average Sold Price | Price Change |
Sold Properties
|
|---|---|---|---|
| 2026 | £438,594 | -9% |
118 Properties |
| 2025 | £477,153 | 3% |
1,706 Properties |
| 2024 | £460,636 | 1% |
1,775 Properties |
| 2023 | £454,009 | -0,1% |
1,462 Properties |
| 2022 | £454,524 | 2% |
2,086 Properties |
| 2021 | £446,633 | 8% |
2,766 Properties |
| 2020 | £411,097 | 2% |
1,824 Properties |
| 2019 | £401,353 | 3% |
1,969 Properties |
| 2018 | £388,585 | -3% |
2,017 Properties |
| 2017 | £399,549 | 8% |
2,317 Properties |
Property Price per Property Type in High Wycombe
Here you can find historic sold price data in order to help with your property search.
The average Property Paid Price for specific property types in the last three years are:
| Property Type | Average Sold Price | Sold Properties |
|---|---|---|
| Semi Detached House | £457,773.00 | 1,661 Semi Detached Houses |
| Terraced House | £388,835.00 | 894 Terraced Houses |
| Detached House | £755,078.00 | 1,257 Detached Houses |
| Flat | £232,229.00 | 1,249 Flats |
Transport in High Wycombe
Please see below transportation links in this area:
