
Houses for sale & to rent in Pilkington Park, Bury
House Prices in Pilkington Park
Properties in Pilkington Park have an average house price of £188k and had 28 Property Transactions within the last 3 years¹.
Pilkington Park is an area in Bury, Bury with 210 households², where the most expensive property was sold for £380k.
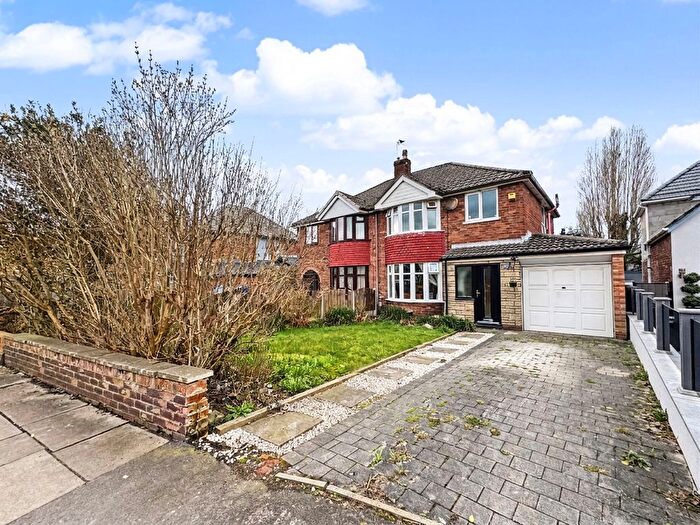
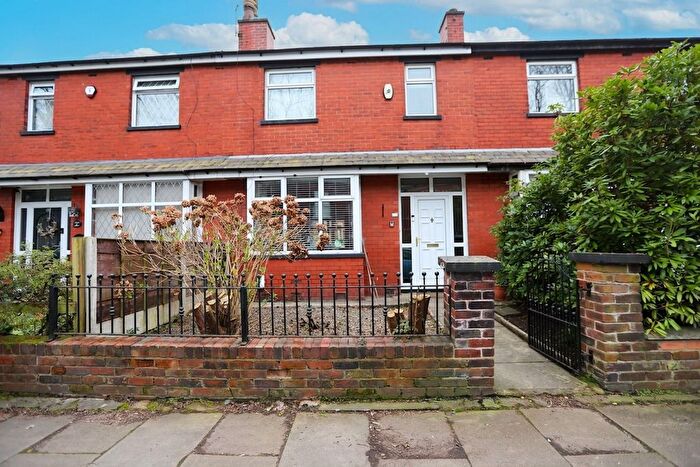
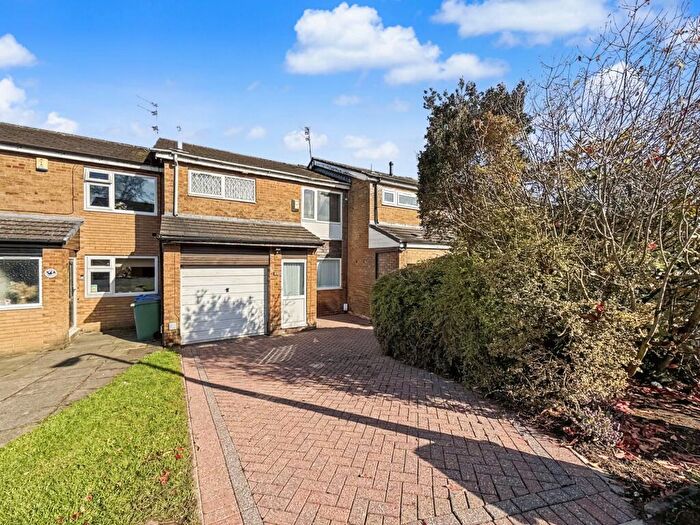
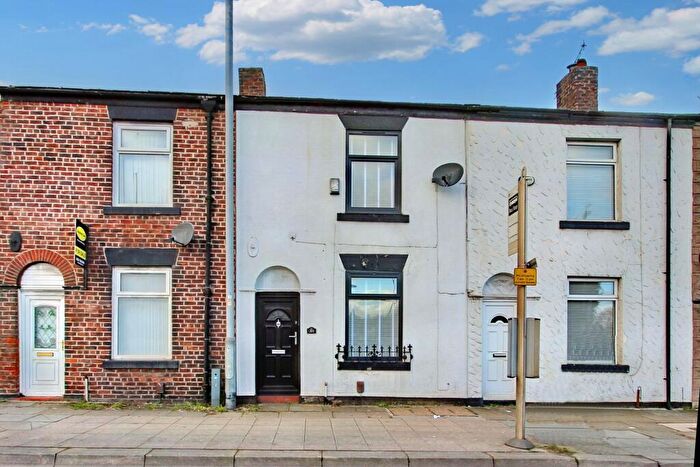
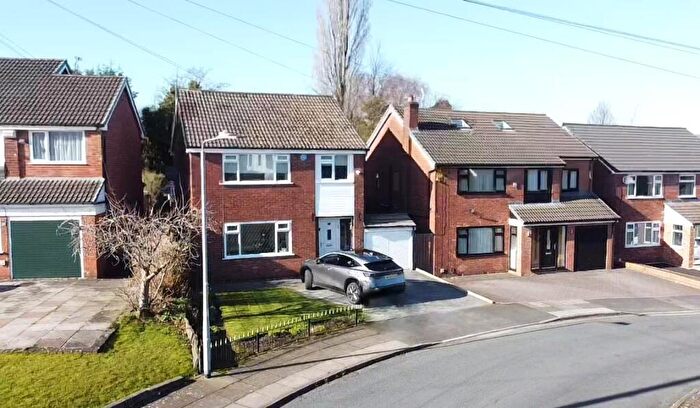
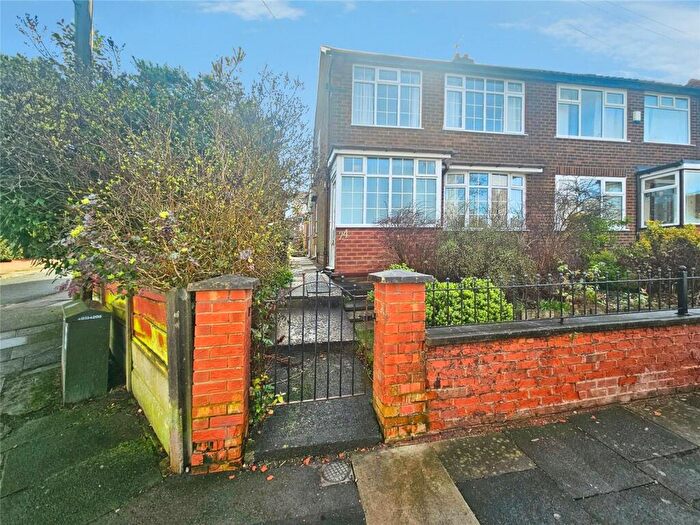
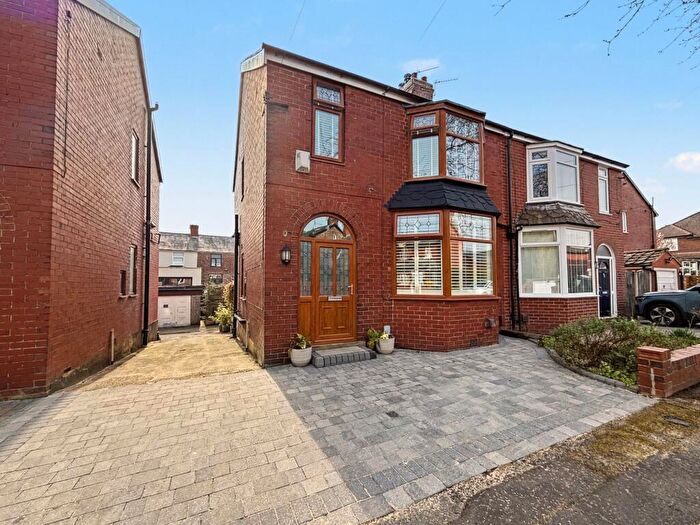
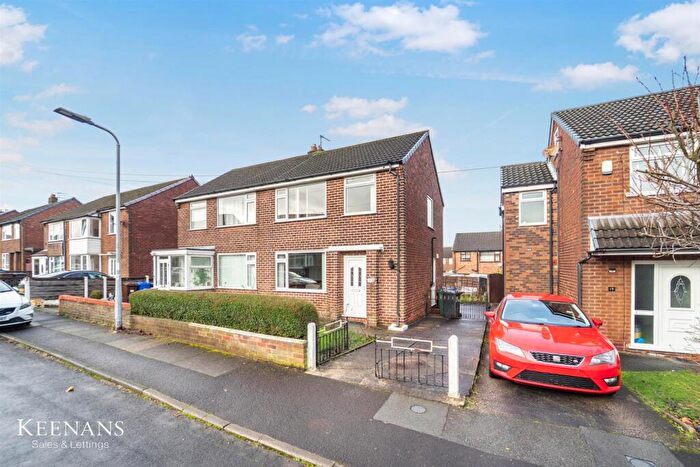
Properties for sale in Pilkington Park

![]()
If you are looking to sell your house, let it out, or receive a property valuation, an expert can help you.
Click the button below to get started.


Roads and Postcodes in Pilkington Park
Navigate through our locations to find the location of your next house in Pilkington Park, Bury for sale or to rent.
| Streets | Postcodes |
|---|---|
| High Bank Road | BL9 9TN |
| Highfield Lane | BL9 8DR |
| Kirkman Street | BL9 8DX |
| Lavenham Close | BL9 8DP |
| Leslie Avenue | BL9 8DL |
| Manchester Road | BL9 8DU BL9 8DW BL9 9TR |
| Middleton Drive | BL9 8DS BL9 8DT |
| Sandy Close | BL9 9TW |
Transport near Pilkington Park
-
 Clifton Station
 -
Kearsley Station
-
Swinton (Greater Manchester) Station
-
Farnworth Station
-
Moorside Station
-
Moses Gate Station
- FAQ
- Price Paid By Year
- Property Type Price
Frequently asked questions about Pilkington Park
What is the average price for a property for sale in Pilkington Park?
The average price for a property for sale in Pilkington Park is £187,819. This amount is 22% lower than the average price in Bury. There are 1,306 property listings for sale in Pilkington Park.
What streets have the most expensive properties for sale in Pilkington Park?
The streets with the most expensive properties for sale in Pilkington Park are High Bank Road at an average of £300,333, Middleton Drive at an average of £292,250 and Kirkman Street at an average of £220,000.
What streets have the most affordable properties for sale in Pilkington Park?
The streets with the most affordable properties for sale in Pilkington Park are Manchester Road at an average of £153,142 and Sandy Close at an average of £203,000.
Which train stations are available in or near Pilkington Park?
Some of the train stations available in or near Pilkington Park are Clifton, Kearsley and Swinton (Greater Manchester).
Property Price Paid in Pilkington Park by Year
The average sold property price by year was:
| Year | Average Sold Price | Price Change |
Sold Properties
|
|---|---|---|---|
| 2025 | £236,666 | 17% |
9 Properties |
| 2024 | £197,444 | 32% |
9 Properties |
| 2023 | £135,195 | -72% |
10 Properties |
| 2022 | £232,750 | 37% |
8 Properties |
| 2021 | £146,900 | -25% |
15 Properties |
| 2020 | £184,222 | 29% |
9 Properties |
| 2019 | £131,666 | -8% |
12 Properties |
| 2018 | £142,571 | -4% |
14 Properties |
| 2017 | £147,900 | 37% |
14 Properties |
| 2016 | £93,157 | -61% |
7 Properties |
| 2015 | £149,772 | -14% |
11 Properties |
| 2014 | £171,375 | -24% |
12 Properties |
| 2013 | £212,290 | 25% |
10 Properties |
| 2012 | £159,999 | 11% |
8 Properties |
| 2011 | £141,846 | -29% |
13 Properties |
| 2010 | £183,333 | 33% |
3 Properties |
| 2009 | £123,666 | -9% |
3 Properties |
| 2008 | £135,241 | -12% |
6 Properties |
| 2007 | £151,090 | 6% |
11 Properties |
| 2006 | £141,390 | 19% |
5 Properties |
| 2005 | £114,888 | -1% |
14 Properties |
| 2004 | £115,664 | 33% |
7 Properties |
| 2003 | £77,412 | 3% |
12 Properties |
| 2002 | £75,168 | 36% |
13 Properties |
| 2001 | £48,346 | -3% |
14 Properties |
| 2000 | £49,956 | -35% |
15 Properties |
| 1999 | £67,574 | 42% |
16 Properties |
| 1998 | £38,890 | -2% |
10 Properties |
| 1997 | £39,803 | 5% |
15 Properties |
| 1996 | £37,812 | -34% |
8 Properties |
| 1995 | £50,743 | - |
8 Properties |
Property Price per Property Type in Pilkington Park
Here you can find historic sold price data in order to help with your property search.
The average Property Paid Price for specific property types in the last three years are:
| Property Type | Average Sold Price | Sold Properties |
|---|---|---|
| Semi Detached House | £238,333.00 | 6 Semi Detached Houses |
| Terraced House | £252,500.00 | 2 Terraced Houses |
| Flat | £111,067.00 | 14 Flats |
| Detached House | £294,833.00 | 6 Detached Houses |