
Houses for sale in Unsworth, Manchester
House Prices in Unsworth
Properties in Unsworth have an average house price of £211k and had 77 Property Transactions within the last 3 years¹.
Unsworth is an area in Manchester, Bury with 997 households², where the most expensive property was sold for £480k.
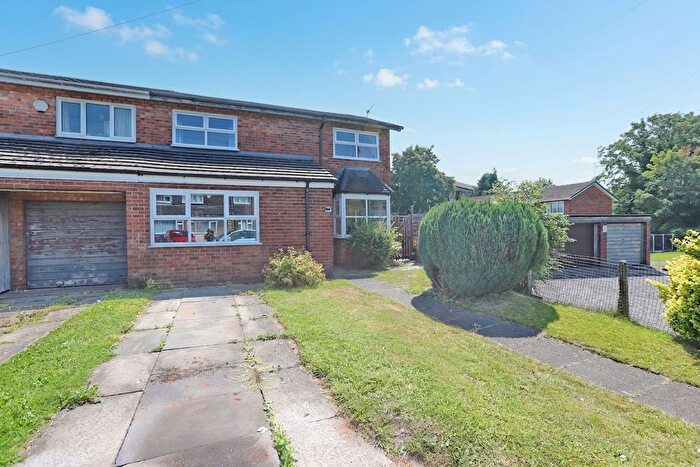
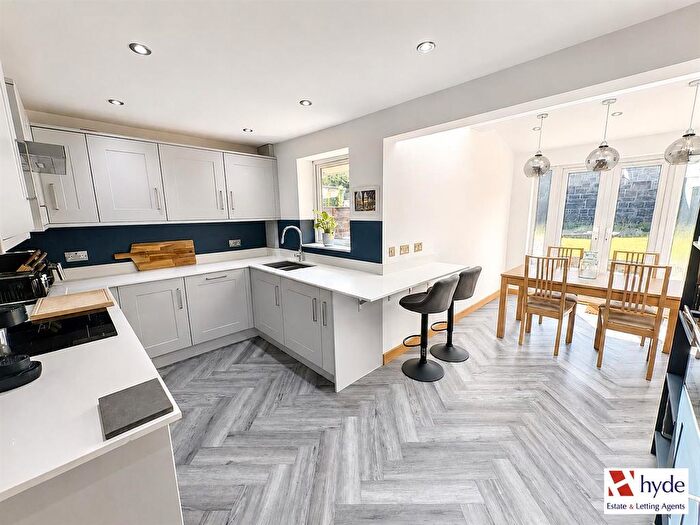
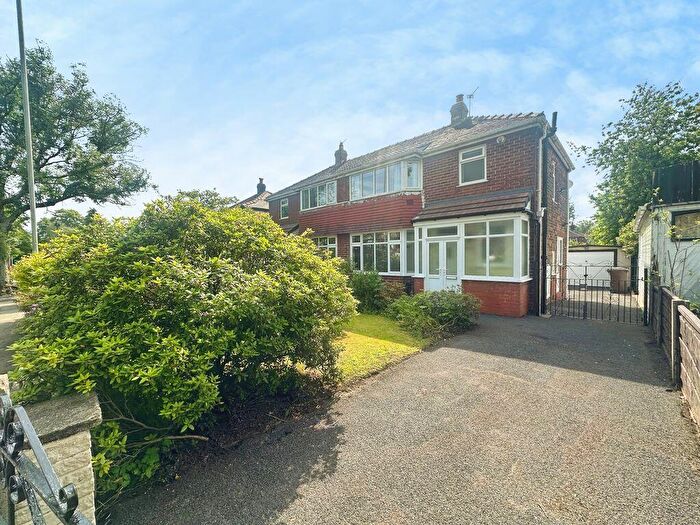
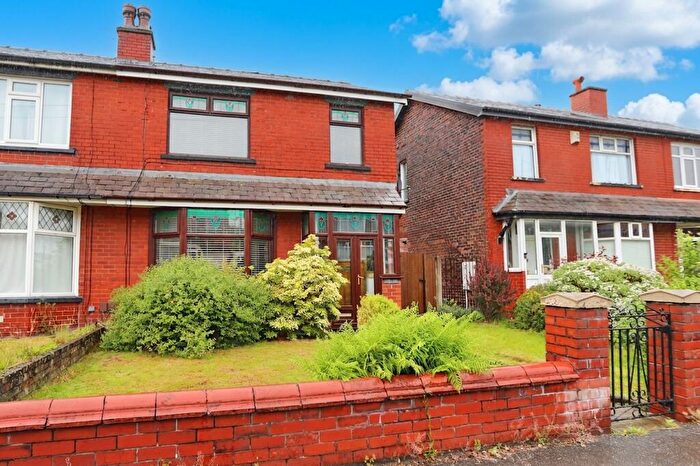
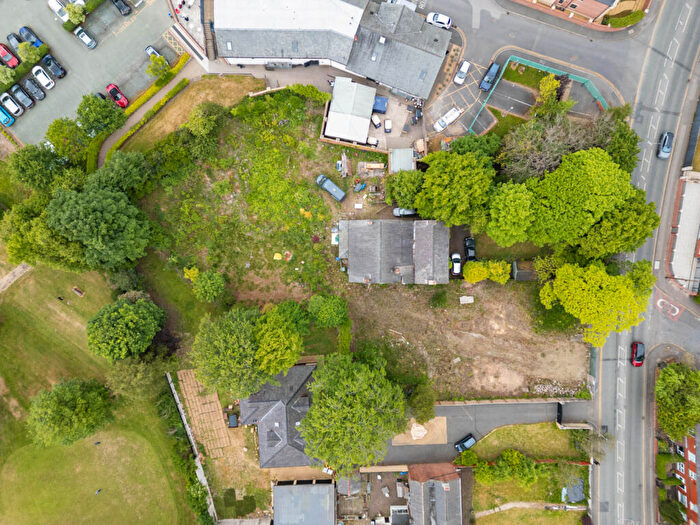
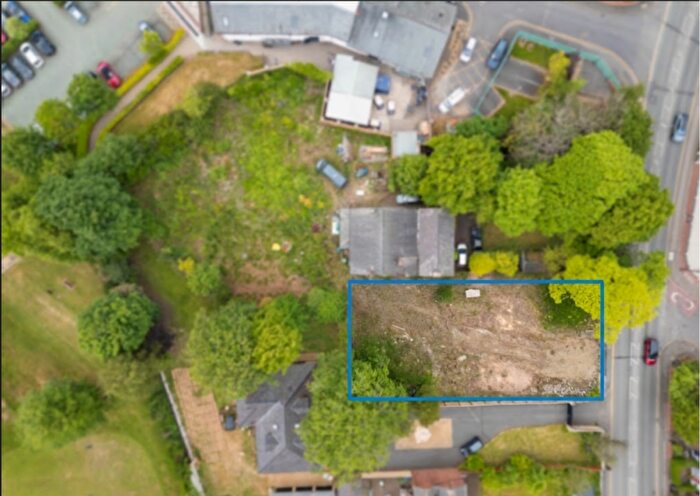
Properties for sale in Unsworth

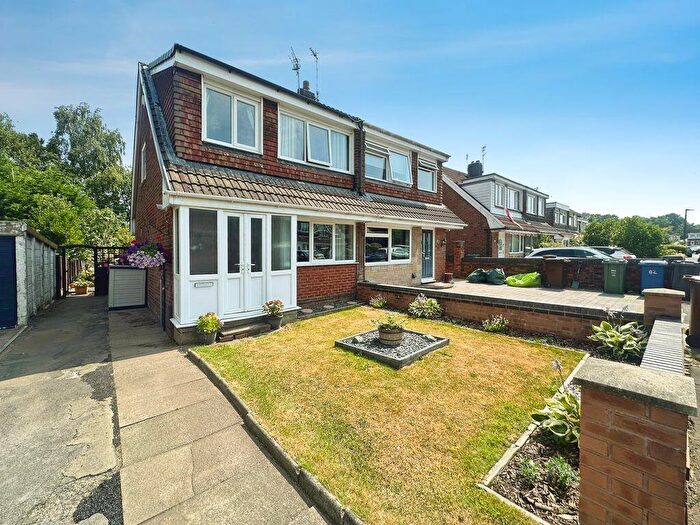

![]()
If you are looking to sell your house, let it out, or receive a property valuation, an expert can help you.
Click the button below to get started.
Roads and Postcodes in Unsworth
Navigate through our locations to find the location of your next house in Unsworth, Manchester for sale or to rent.
| Streets | Postcodes |
|---|---|
| Abingdon Avenue | M45 8PT |
| Abingdon Close | M45 8PU |
| Bury New Road | M45 7SX M45 7SY |
| Dunkirk Road | M45 8NX |
| Egypt Lane | M25 2RU |
| Elms Close | M45 8XR |
| Elms Road | M45 8GF M45 8GP M45 8GR |
| Elms Square | M45 7TA |
| Elms Street | M45 8GQ |
| George Street | M45 7SZ |
| Green Lane | M45 7FD |
| Heathfield Road | M45 8PX |
| Heathfield Square | M45 8AN |
| Holly Fold | M45 8SR |
| Malton Avenue | M45 8PG M45 8PR M45 8PS |
| Malton Close | M45 8PQ |
| Mather Avenue | M45 8NT M45 8NU M45 8WU M45 8WX M45 8XS |
| Melrose Close | M45 8XZ |
| Moreton Avenue | M45 8GG |
| Moss Lane | M45 8NG |
| Richardson Close | M45 8SS |
| Ripon Avenue | M45 8PE M45 8PJ |
| Ripon Close | M45 8PF M45 8PH |
| Rufford Close | M45 8UD |
| Rufford Drive | M45 8PD M45 8PL M45 8PN M45 8PW |
| Sawley Avenue | M45 8PP |
| Selby Avenue | M45 8UT |
| Simon Lane | M24 4SH |
| Stanley Close | M45 8QU |
| Stanley Road | M45 8GT M45 8QW M45 8QY |
| Stanley Street | M45 8GY |
| Sycamore Close | M45 8AQ |
| Tintern Avenue | M45 8NY M45 8WY |
| Welbeck Close | M45 8PB |
| Whalley Close | M45 8NZ |
| Whalley Road | M45 8PA M45 8UZ M45 8WZ |
Property price trends in Unsworth
According to the latest Land Registry data, the average home in Unsworth sold for £216,131 in 2025. That figure comes from 757 sales logged over the past 30 years.
Prices have continued to climb over the last three years. Compared with 2022, when the typical sale came in around £202,687, that's a rise of roughly 6.6%.
Looking back five years, average prices are up about 54.9% since 2020, a gain of around £76,574 in cash terms.
Zoom out to the past decade for the fuller picture. Back in 2015, homes here averaged £117,932, so the typical sold price has climbed about 83.3% since then, roughly 6.2% a year. Stretch the view to fifteen years and that annual pace eases back to about 5.2%.
Frequently asked questions about Unsworth
What is the average price for a property for sale in Unsworth?
The average price for a property for sale in Unsworth is £210,607. This amount is 17% lower than the average price in Manchester. There are 1,486 property listings for sale in Unsworth.
What streets have the most expensive properties for sale in Unsworth?
The streets with the most expensive properties for sale in Unsworth are Stanley Road at an average of £298,000, Moreton Avenue at an average of £258,000 and Tintern Avenue at an average of £232,156.
What streets have the most affordable properties for sale in Unsworth?
The streets with the most affordable properties for sale in Unsworth are Welbeck Close at an average of £163,250, Sawley Avenue at an average of £168,000 and Stanley Street at an average of £169,000.
Which train stations are available in or near Unsworth?
Some of the train stations available in or near Unsworth are Clifton, Swinton (Greater Manchester) and Kearsley.
Property Price Paid in Unsworth by Year
The average sold property price by year was:
| Year | Average Sold Price | Price Change |
Sold Properties
|
|---|---|---|---|
| 2025 | £216,131 | 7% |
27 Properties |
| 2024 | £201,308 | -6% |
23 Properties |
| 2023 | £213,004 | 5% |
27 Properties |
| 2022 | £202,687 | 20% |
24 Properties |
| 2021 | £163,092 | 14% |
38 Properties |
| 2020 | £139,557 | -14% |
13 Properties |
| 2019 | £159,333 | 16% |
24 Properties |
| 2018 | £133,470 | 4% |
25 Properties |
| 2017 | £128,256 | 8% |
21 Properties |
| 2016 | £118,200 | 0,2% |
27 Properties |
Property Price per Property Type in Unsworth
Here you can find historic sold price data in order to help with your property search.
The average Property Paid Price for specific property types in the last three years are:
| Property Type | Average Sold Price | Sold Properties |
|---|---|---|
| Semi Detached House | £236,334.00 | 27 Semi Detached Houses |
| Detached House | £281,250.00 | 2 Detached Houses |
| Terraced House | £196,591.00 | 46 Terraced Houses |
| Flat | £115,000.00 | 2 Flats |
