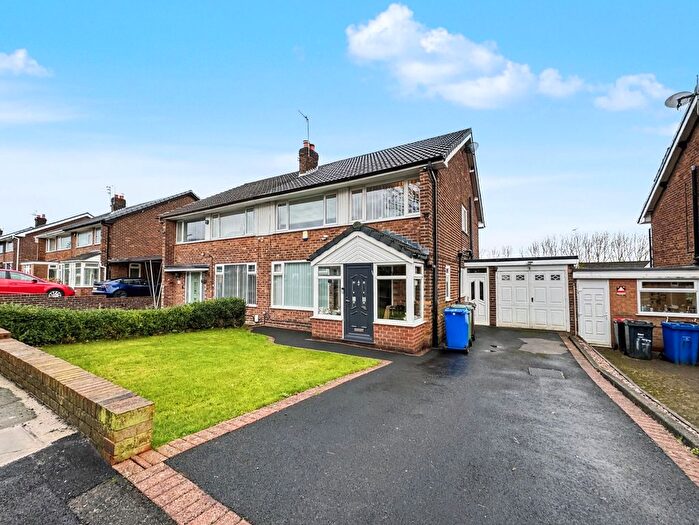
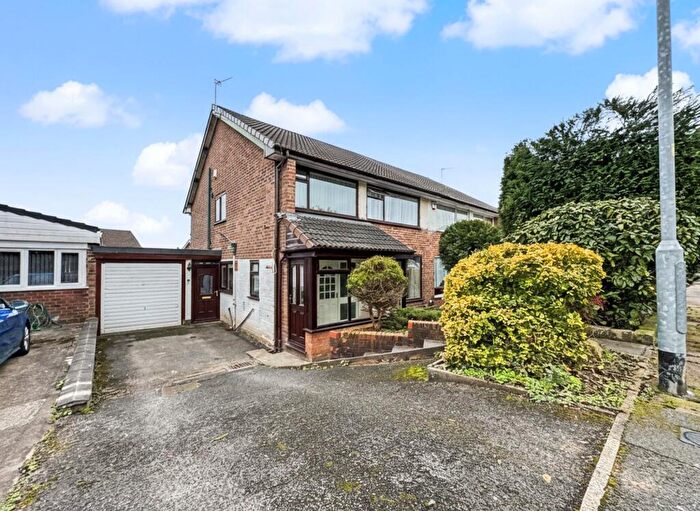
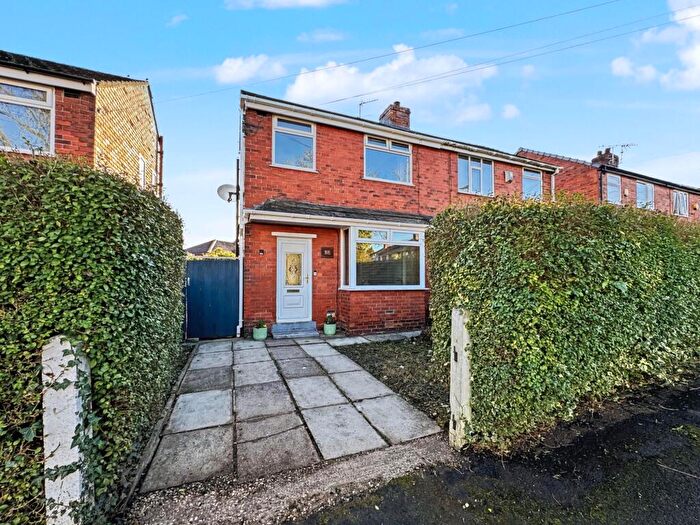
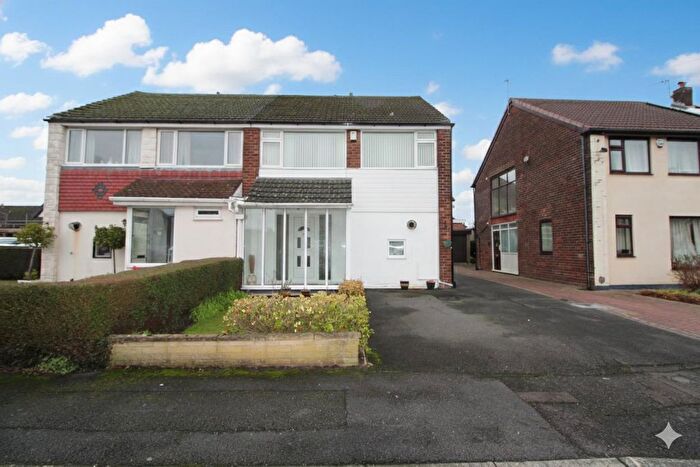
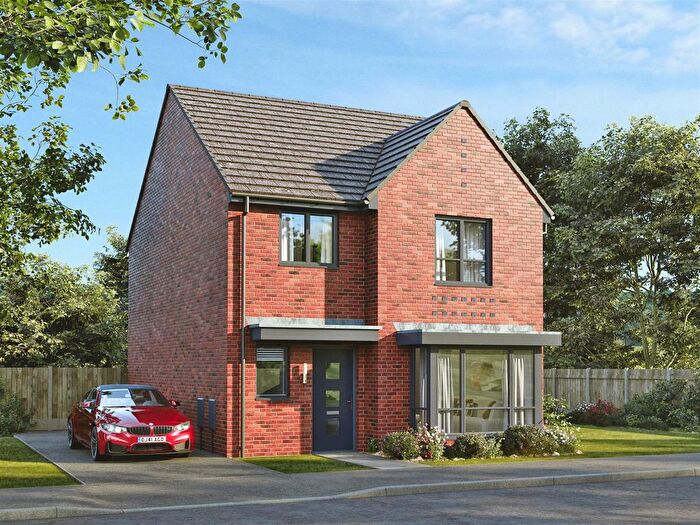
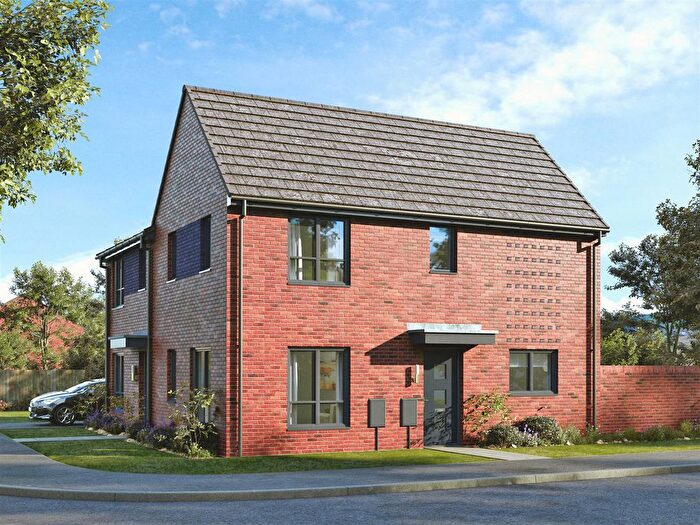
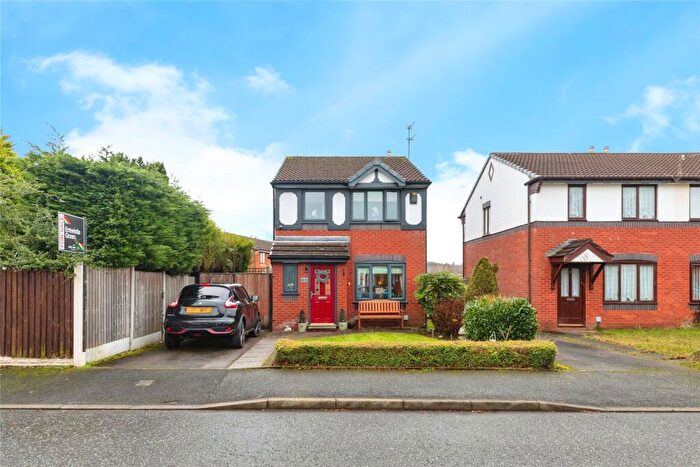
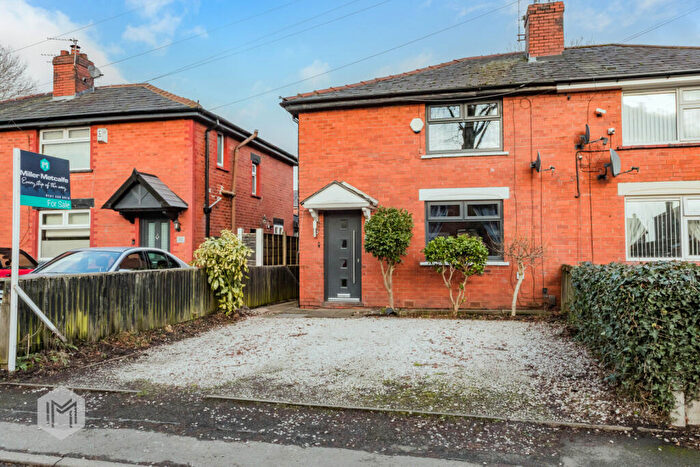
Houses for sale & to rent in Manchester, Bury
House Prices in Manchester
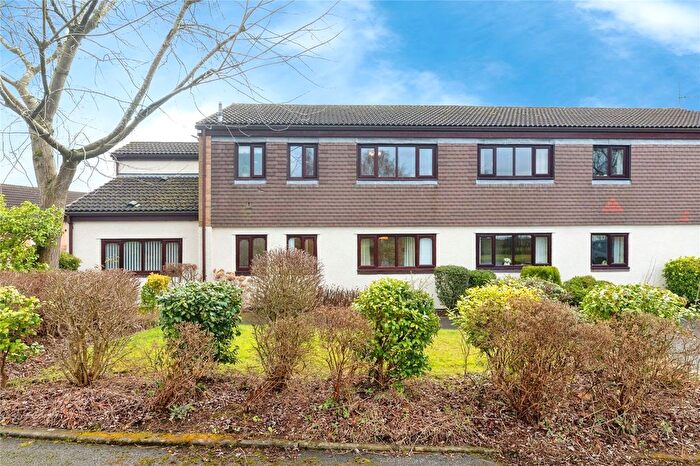
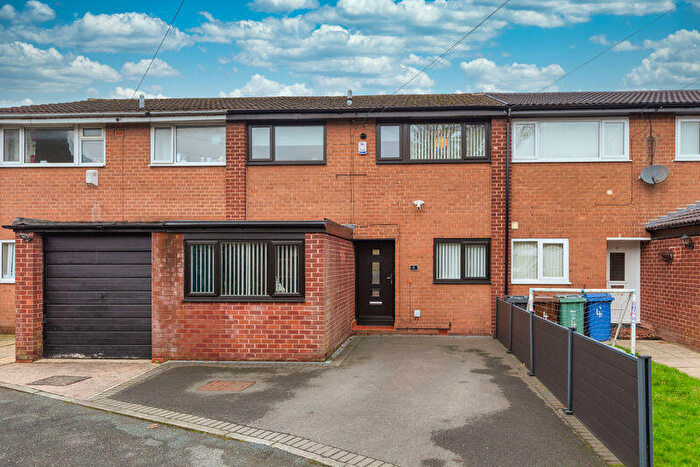
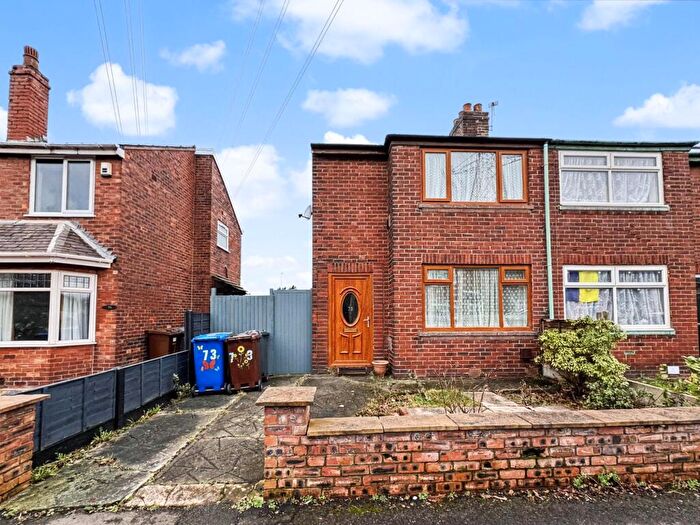
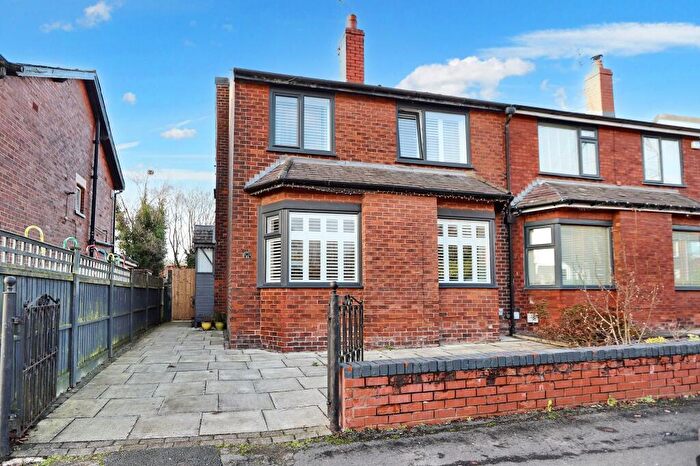
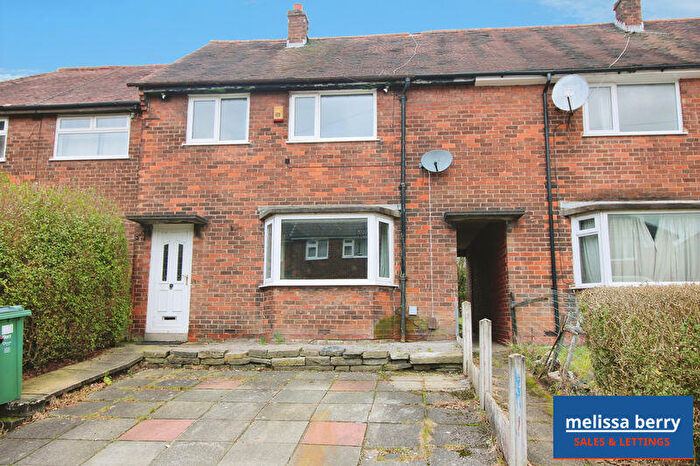
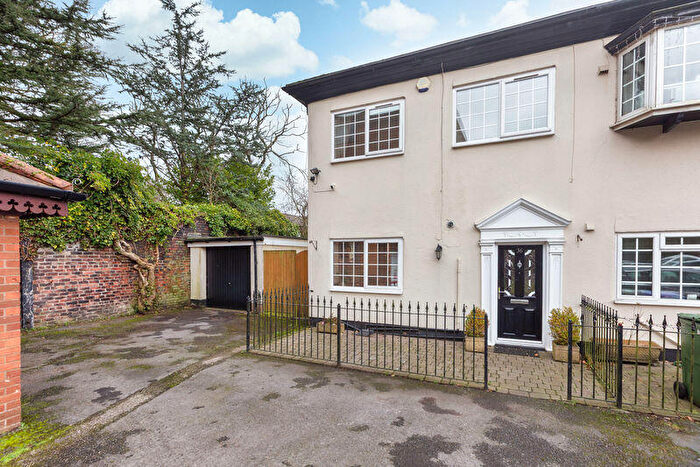
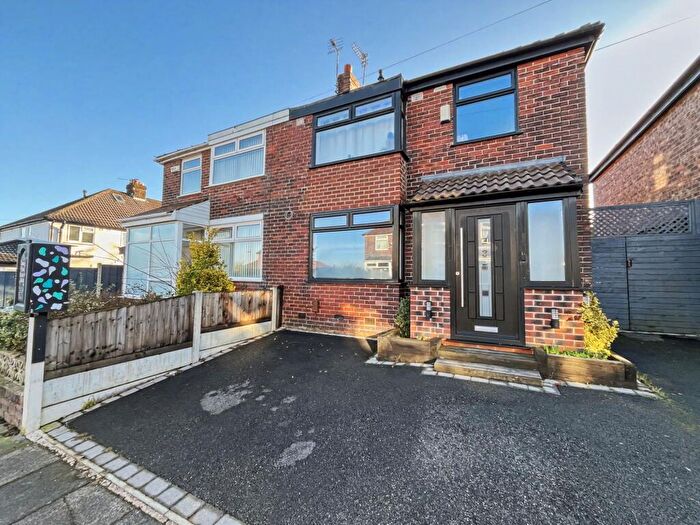
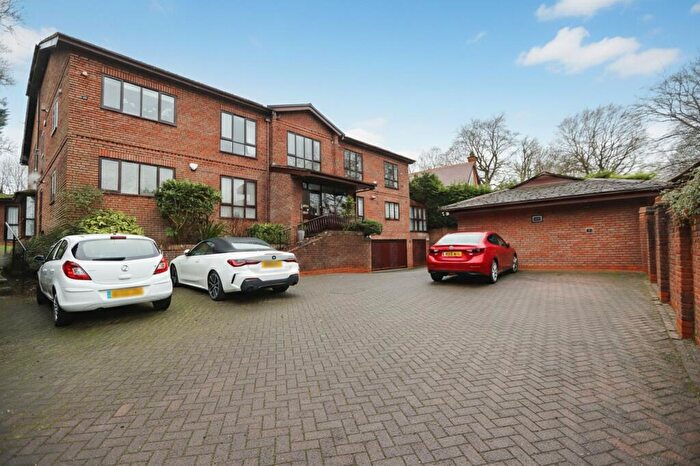
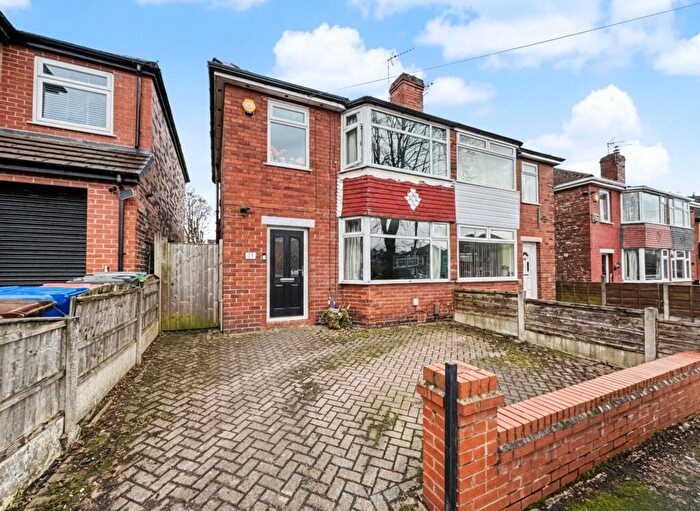
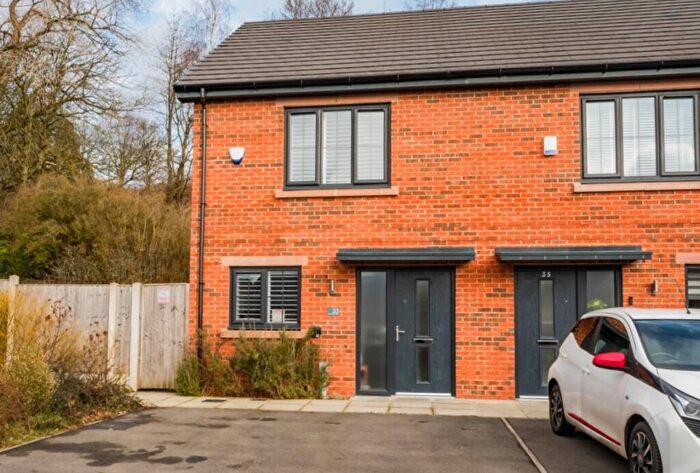
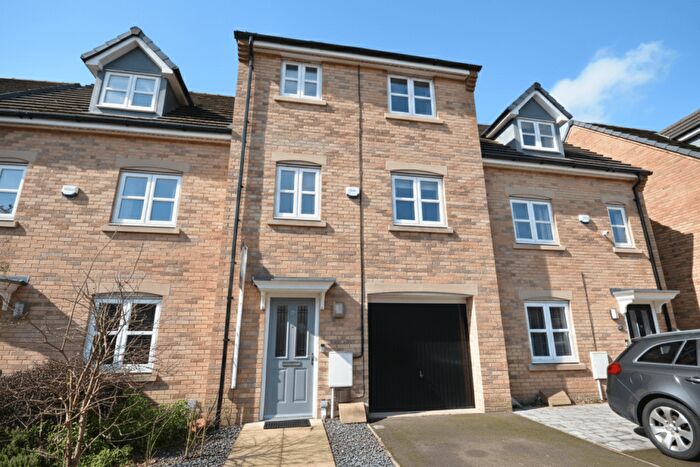
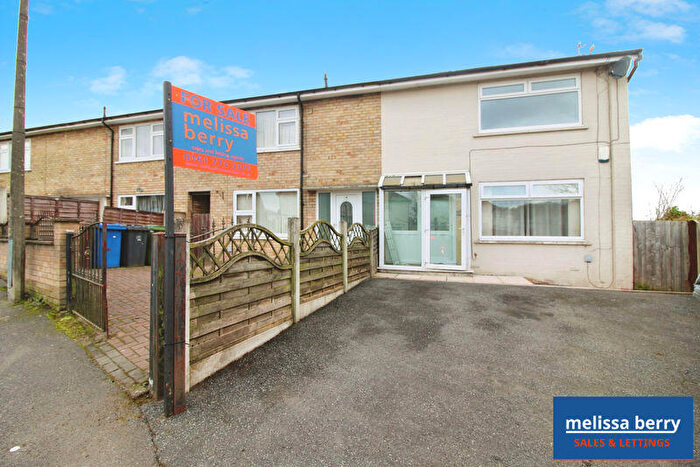
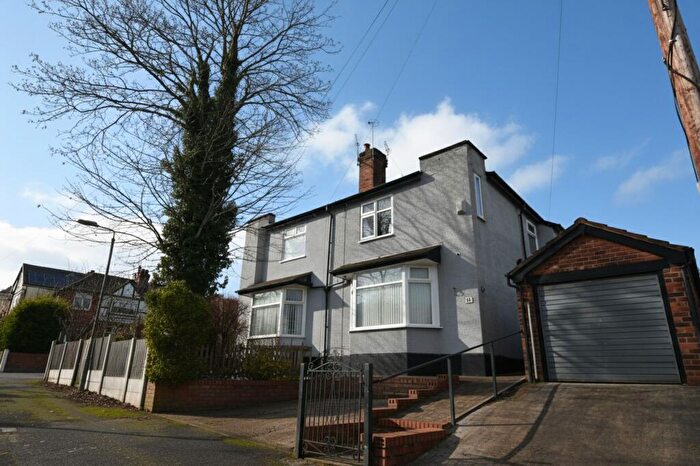
Properties in Manchester have an average house price of £252,880.00 and had 3,268 Property Transactions within the last 3 years.¹
Manchester is an area in Bury with 36,024 households², where the most expensive property was sold for £1,600,000.00.
Properties for sale in Manchester
Neighbourhoods in Manchester
Navigate through our locations to find the location of your next house in Manchester, Bury for sale or to rent.
Transport in Manchester
Please see below transportation links in this area:
-
Clifton Station
-
Swinton (Greater Manchester) Station
-
Moorside Station
-
Kearsley Station
-
Farnworth Station
-
Salford Crescent Station
-
Moses Gate Station
-
Walkden Station
-
Eccles Station
-
Manchester Victoria Station
- FAQ
- Price Paid By Year
- Property Type Price
Frequently asked questions about Manchester
What is the average price for a property for sale in Manchester?
The average price for a property for sale in Manchester is £252,880. This amount is 3% higher than the average price in Bury. There are more than 10,000 property listings for sale in Manchester.
What locations have the most expensive properties for sale in Manchester?
The locations with the most expensive properties for sale in Manchester are Pilkington Park at an average of £351,066, Sedgley at an average of £318,278 and St Marys at an average of £300,233.
What locations have the most affordable properties for sale in Manchester?
The locations with the most affordable properties for sale in Manchester are Radcliffe West at an average of £177,082, Radcliffe East at an average of £185,505 and Unsworth at an average of £213,264.
Which train stations are available in or near Manchester?
Some of the train stations available in or near Manchester are Clifton, Swinton (Greater Manchester) and Moorside.
Property Price Paid in Manchester by Year
The average sold property price by year was:
| Year | Average Sold Price | Price Change |
Sold Properties
|
|---|---|---|---|
| 2025 | £262,771 | 3% |
942 Properties |
| 2024 | £255,133 | 5% |
1,228 Properties |
| 2023 | £241,874 | -1% |
1,098 Properties |
| 2022 | £244,299 | 5% |
1,355 Properties |
| 2021 | £232,782 | 10% |
1,573 Properties |
| 2020 | £210,232 | 4% |
1,188 Properties |
| 2019 | £201,423 | 2% |
1,369 Properties |
| 2018 | £196,866 | 3% |
1,538 Properties |
| 2017 | £190,078 | 11% |
1,595 Properties |
| 2016 | £169,240 | 5% |
1,704 Properties |
| 2015 | £160,287 | 9% |
1,574 Properties |
| 2014 | £145,887 | 3% |
1,399 Properties |
| 2013 | £140,877 | -1% |
955 Properties |
| 2012 | £141,730 | -3% |
781 Properties |
| 2011 | £145,905 | -0,2% |
773 Properties |
| 2010 | £146,191 | -0,5% |
816 Properties |
| 2009 | £146,854 | -1% |
705 Properties |
| 2008 | £148,081 | -2% |
990 Properties |
| 2007 | £151,770 | 5% |
1,843 Properties |
| 2006 | £143,727 | 2% |
1,998 Properties |
| 2005 | £140,649 | 14% |
1,675 Properties |
| 2004 | £120,816 | 17% |
2,079 Properties |
| 2003 | £100,473 | 18% |
2,191 Properties |
| 2002 | £82,574 | 20% |
2,152 Properties |
| 2001 | £66,005 | 11% |
1,836 Properties |
| 2000 | £58,643 | 2% |
1,778 Properties |
| 1999 | £57,434 | 5% |
1,725 Properties |
| 1998 | £54,451 | 3% |
1,570 Properties |
| 1997 | £52,658 | 8% |
1,620 Properties |
| 1996 | £48,465 | 0,3% |
1,466 Properties |
| 1995 | £48,308 | - |
1,310 Properties |
Property Price per Property Type in Manchester
Here you can find historic sold price data in order to help with your property search.
The average Property Paid Price for specific property types in the last three years are:
| Property Type | Average Sold Price | Sold Properties |
|---|---|---|
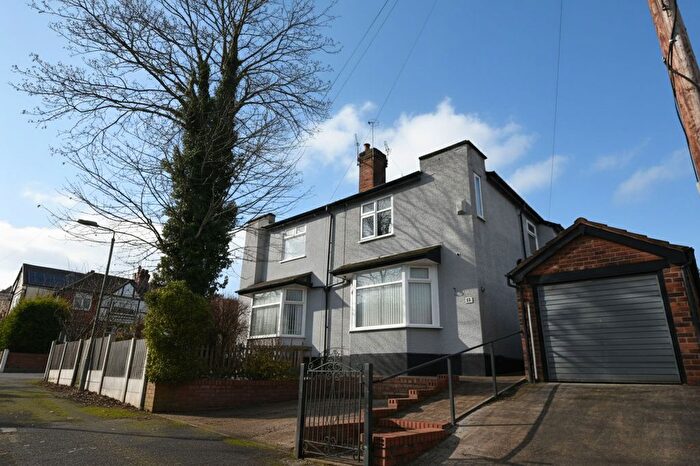
| Semi Detached House | £275,026.00 | 1,277 Semi Detached Houses |
| Terraced House | £189,369.00 | 1,166 Terraced Houses |
| Detached House | £434,062.00 | 470 Detached Houses |
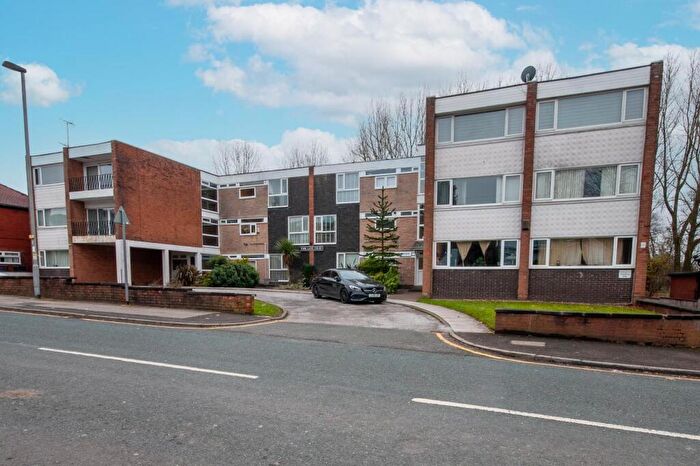
| Flat | £141,945.00 | 355 Flats |

