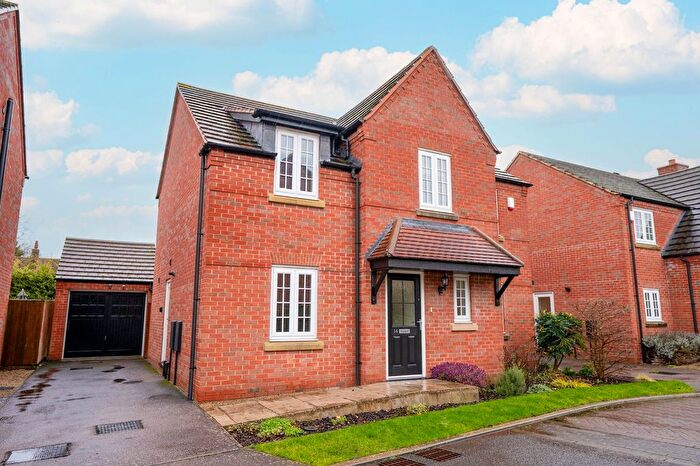
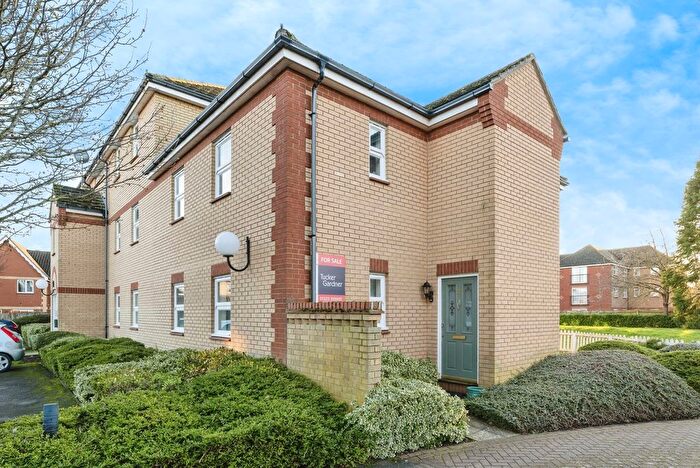
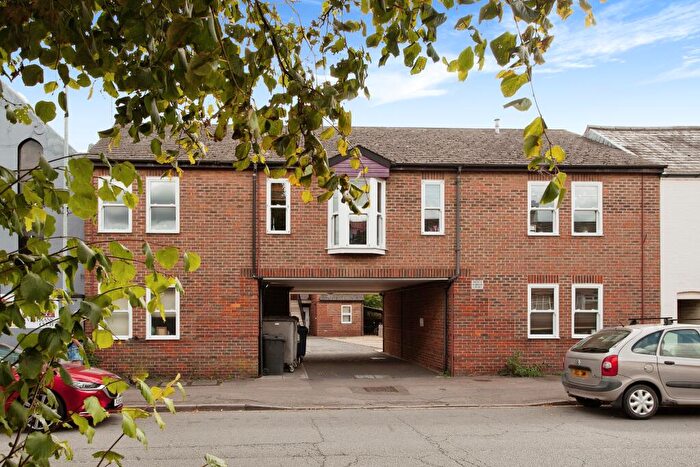
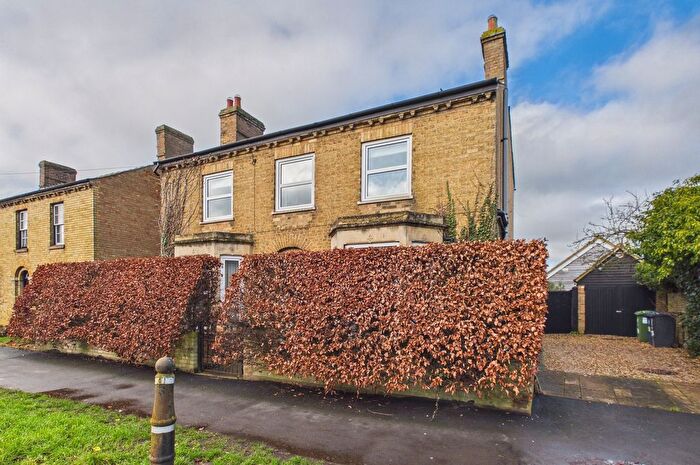
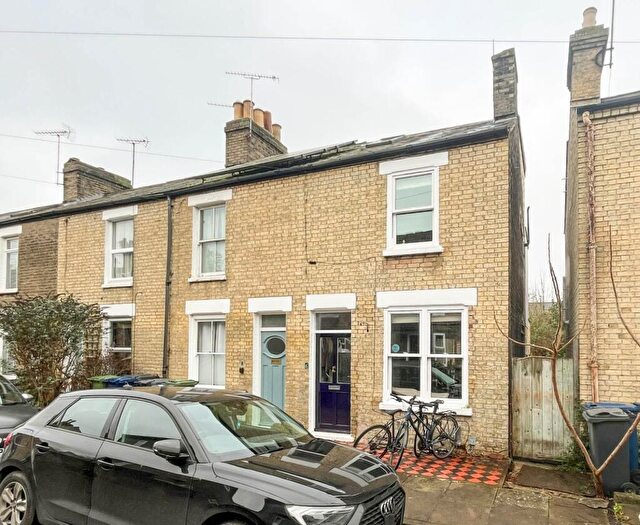
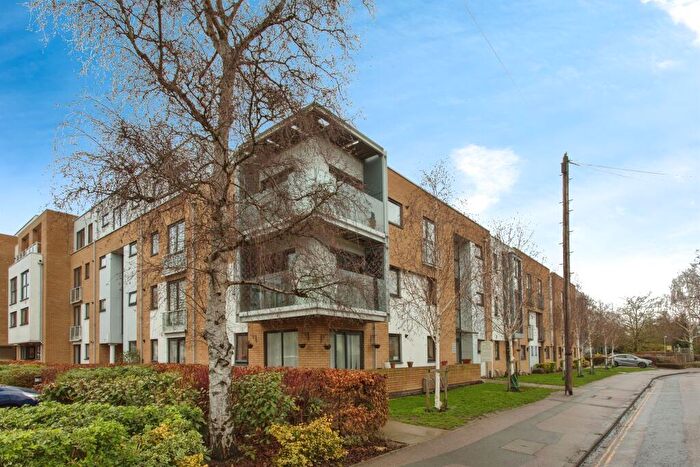
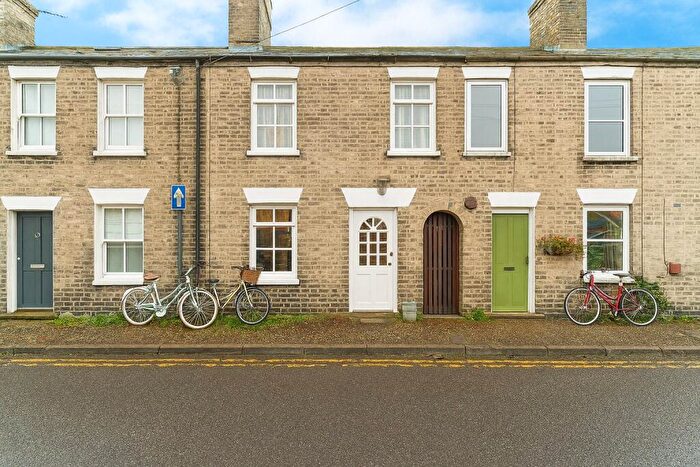
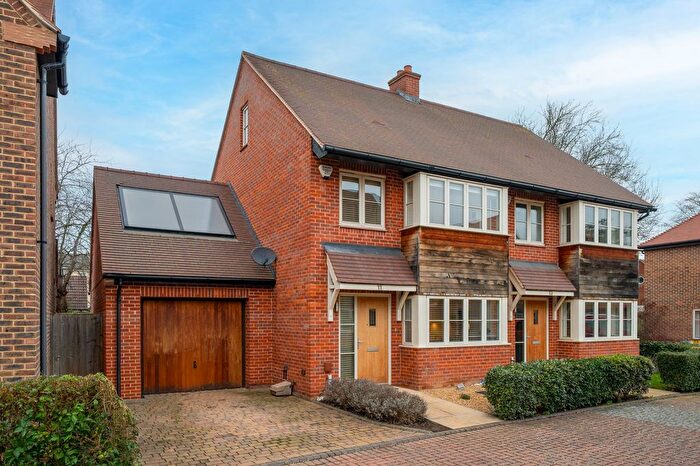
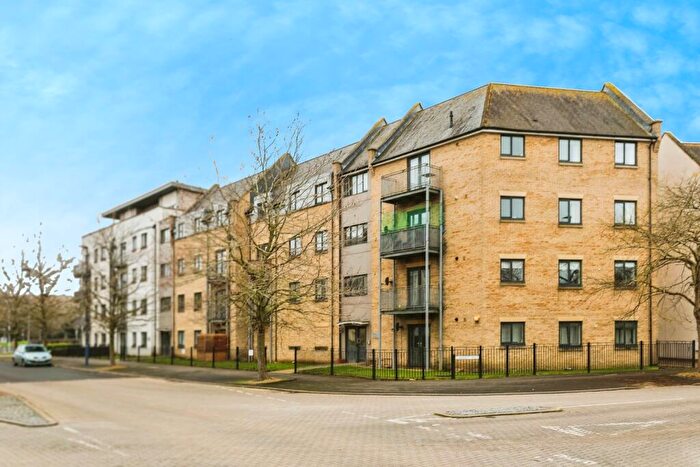
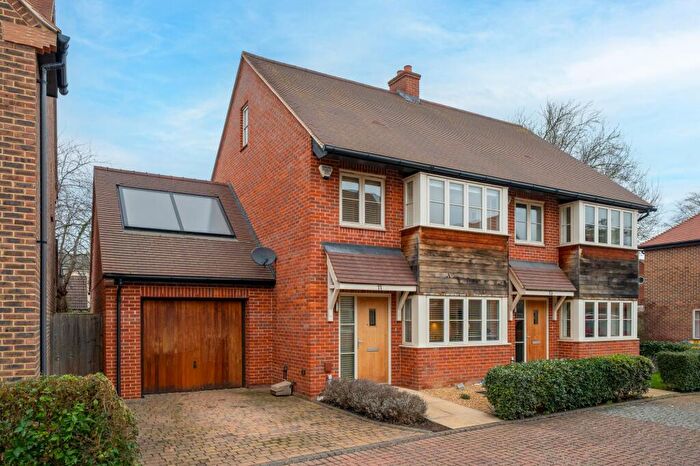
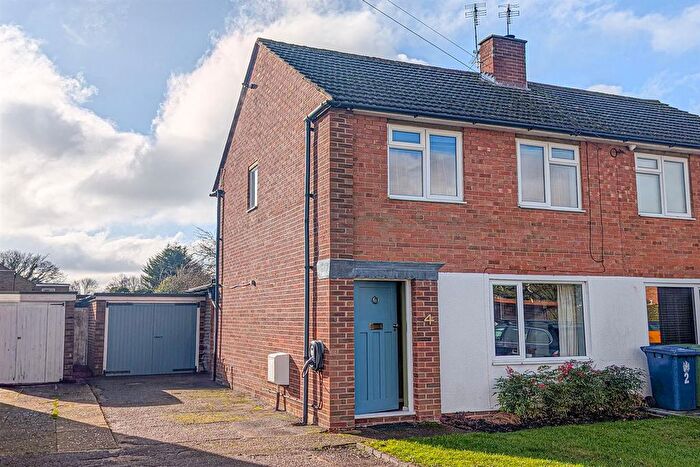
Houses for sale & to rent in Milton & Waterbeach, Cambridge
House Prices in Milton & Waterbeach
Properties in Milton & Waterbeach have an average house price of £411,239.00 and had 41 Property Transactions within the last 3 years¹.
Milton & Waterbeach is an area in Cambridge, Cambridgeshire with 333 households², where the most expensive property was sold for £860,000.00.
Properties for sale in Milton & Waterbeach
Roads and Postcodes in Milton & Waterbeach
Navigate through our locations to find the location of your next house in Milton & Waterbeach, Cambridge for sale or to rent.
| Streets | Postcodes |
|---|---|
| A10 Milton Bypass | CB24 6AE |
| Abbey Court | CB25 9PT |
| Abbey Place | CB25 9LG |
| Anglers Way | CB25 9RD |
| Bannold Drove | CB25 9QQ |
| Banworth Lane | CB25 9FS |
| Barnabas Court | CB24 6WR |
| Barnfield Close | CB25 9GW |
| Butt Lane | CB24 6DQ |
| Cambridge Research Park | CB25 9PD CB25 9PE CB25 9TL CB25 9TN CB25 9TP |
| Cambridge Road | CB24 6AS CB24 6AT CB24 6AU CB24 6AY |
| Cambridge Road Industrial Estate | CB24 6AZ |
| Caravan Site Road | CB24 6AN |
| Clayhithe Road | CB25 9HZ |
| Convent Drive | CB25 9QT |
| Cooke's Field | CB25 9GP |
| Cosy Nook Park | CB25 9NL |
| Cowley Road | CB4 0DS CB4 0ZT |
| Daniels Park | CB24 6UD |
| Denny End Road | CB25 9GL CB25 9GU CB25 9QU CB25 9QE |
| Dimmock Road | CB25 9GT |
| Dowding Avenue | CB25 9LJ |
| Edmund Close | CB24 6ZS |
| Ely Road | CB24 6WZ CB25 9FH CB25 9PQ |
| Fen Road | CB24 6AF CB4 1GJ |
| Fletcher Avenue | CB25 9LZ |
| Flint Lane | CB25 9QZ |
| Glenmore Business Park | CB25 9FX |
| Harvey Way | CB25 9GJ |
| Hop Bine Drive | CB25 9RF |
| Kings Hedges Road | CB4 2QL CB4 2QT |
| Landbeach Road | CB24 6DB |
| Mason Road | CB25 9GS |
| Merton Park | CB25 9JX |
| Milton Avenue | CB4 0AE |
| Milton Road | CB4 0GH CB4 0JL |
| Orchard Drive | CB25 9LF |
| Park Crescent | CB25 9LH |
| Pembroke Avenue | CB25 9PY CB25 9QD CB25 9QP CB25 9QR CB25 9QX |
| Robson Terrace | CB25 9GR |
| Sandy Park | CB4 1TH |
| Science Park | CB4 0AB CB4 0DW CB4 0EY CB4 0FE CB4 0FJ CB4 0FN CB4 0FP CB4 0FW CB4 0FX CB4 0FY CB4 0FZ CB4 0GD CB4 0GF CB4 0GJ CB4 0GN CB4 0GQ CB4 0GW CB4 0GZ CB4 0PE CB4 0PZ CB4 0QA CB4 0WA CB4 0WB CB4 0WD CB4 0WE CB4 0WF CB4 0WG CB4 0WH CB4 0WN CB4 0WW CB4 0XL CB4 0XR CB4 0GA |
| Star Drive | CB25 9RE |
| Station Road | CB25 9HX |
| Waddelow Road | CB25 9GF |
| Waterbeach Court | CB25 9PF |
| Watermans Road | CB25 9RP |
| Wheatsheaf Way | CB25 9GG |
| Whiterod Close | CB25 9GY |
| Whittons Park | CB25 9JY |
| Winship Road | CB24 6AP CB24 6BQ CB24 6PP |
| CB4 0AF CB25 9RT |
Transport near Milton & Waterbeach
- FAQ
- Price Paid By Year
- Property Type Price
Frequently asked questions about Milton & Waterbeach
What is the average price for a property for sale in Milton & Waterbeach?
The average price for a property for sale in Milton & Waterbeach is £411,239. This amount is 20% lower than the average price in Cambridge. There are 3,285 property listings for sale in Milton & Waterbeach.
What streets have the most expensive properties for sale in Milton & Waterbeach?
The streets with the most expensive properties for sale in Milton & Waterbeach are Dimmock Road at an average of £660,000, Barnabas Court at an average of £607,000 and Mason Road at an average of £506,000.
What streets have the most affordable properties for sale in Milton & Waterbeach?
The streets with the most affordable properties for sale in Milton & Waterbeach are Cooke's Field at an average of £161,333, Star Drive at an average of £368,750 and Hop Bine Drive at an average of £371,000.
Which train stations are available in or near Milton & Waterbeach?
Some of the train stations available in or near Milton & Waterbeach are Waterbeach, Cambridge North and Cambridge.
Property Price Paid in Milton & Waterbeach by Year
The average sold property price by year was:
| Year | Average Sold Price | Price Change |
Sold Properties
|
|---|---|---|---|
| 2025 | £434,000 | 11% |
12 Properties |
| 2024 | £386,795 | -6% |
11 Properties |
| 2023 | £411,002 | 5% |
18 Properties |
| 2022 | £391,287 | 1% |
27 Properties |
| 2021 | £388,895 | 8% |
12 Properties |
| 2020 | £356,070 | -13% |
7 Properties |
| 2019 | £402,643 | 7% |
31 Properties |
| 2018 | £373,723 | -8% |
71 Properties |
| 2017 | £403,877 | -1% |
52 Properties |
| 2016 | £406,093 | 42% |
22 Properties |
| 2015 | £234,323 | -36% |
17 Properties |
| 2014 | £319,356 | 23% |
17 Properties |
| 2011 | £247,250 | 45% |
2 Properties |
| 2010 | £135,000 | -141% |
1 Property |
| 2004 | £325,000 | -23% |
1 Property |
| 2002 | £400,000 | - |
1 Property |
Property Price per Property Type in Milton & Waterbeach
Here you can find historic sold price data in order to help with your property search.
The average Property Paid Price for specific property types in the last three years are:
| Property Type | Average Sold Price | Sold Properties |
|---|---|---|
| Semi Detached House | £337,028.00 | 26 Semi Detached Houses |
| Detached House | £591,375.00 | 12 Detached Houses |
| Terraced House | £333,850.00 | 3 Terraced Houses |

