
Houses for sale in Cambridge, Cambridgeshire
House Prices in Cambridge
Properties in Cambridge have an average house price of £516k and had 9,320 Property Transactions within the last 3 years.¹
Cambridge is an area in Cambridgeshire with 113,771 households², where the most expensive property was sold for £5.5M.
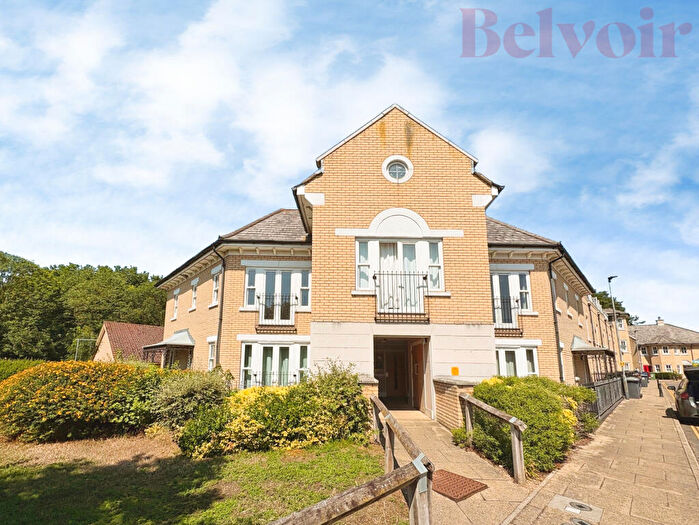
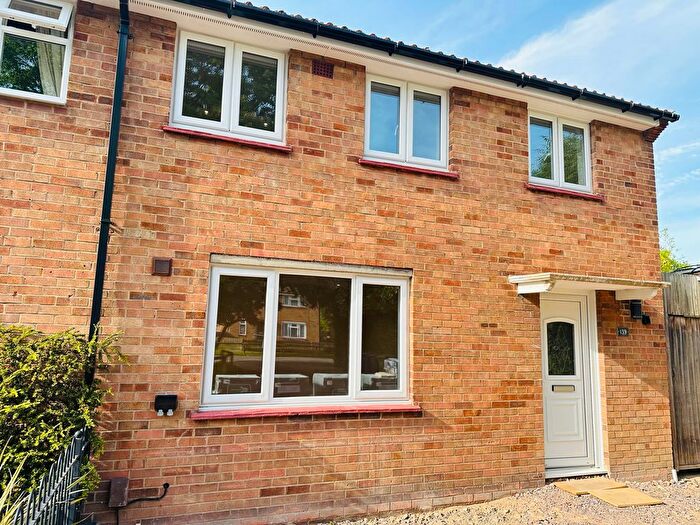
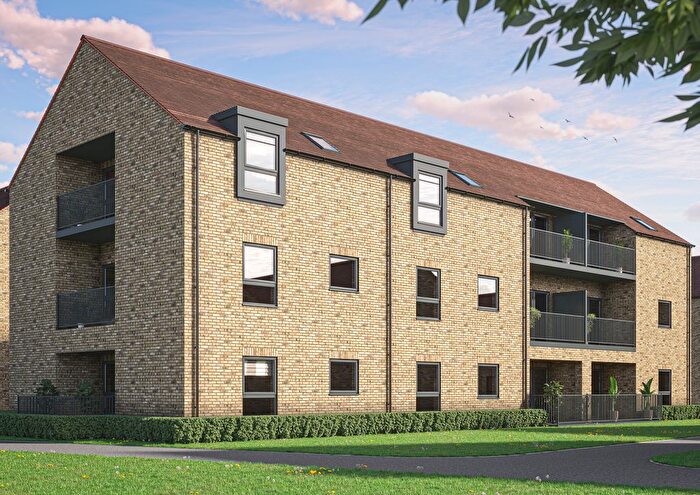
Properties for sale in Cambridge
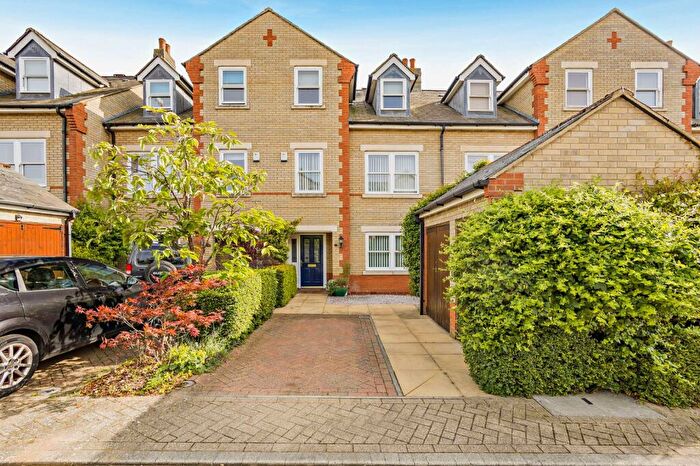
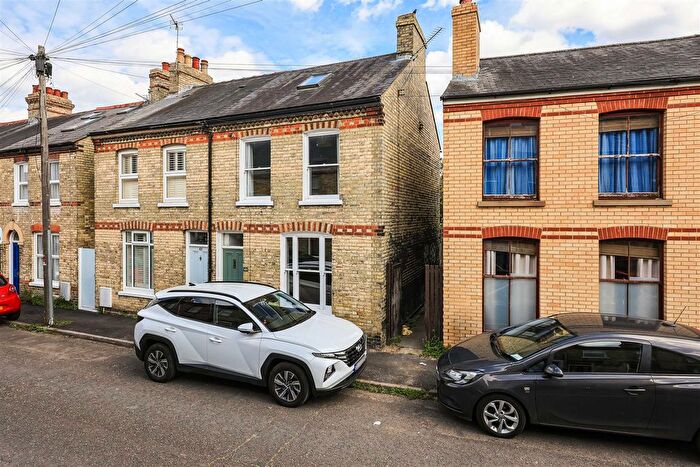
![]()
If you are looking to sell your house, let it out, or receive a property valuation, an expert can help you.
Click the button below to get started.

Neighbourhoods in Cambridge
Navigate through our locations to find the location of your next house in Cambridge, Cambridgeshire for sale or to rent.
- Abbey
- Arbury
- Balsham
- Bar Hill
- Barton
- Bottisham
- Bourn
- Burwell
- Caldecote
- Castle
- Cherry Hinton
- Coleridge
- Comberton
- Cottenham
- Duxford
- East Chesterton
- Fowlmere And Foxton
- Fulbourn
- Gamlingay
- Girton
- Hardwick
- Harston And Hauxton
- Haslingfield And The Eversdens
- Histon And Impington
- Kings Hedges
- Linton
- Longstanton
- Market
- Milton
- Newnham
- Orwell And Barrington
- Papworth And Elsworth
- Petersfield
- Queen Ediths
- Romsey
- Sawston
- Swavesey
- Teversham
- The Abingtons
- The Shelfords And Stapleford
- The Swaffhams
- The Wilbrahams
- Trumpington
- Waterbeach
- West Chesterton
- Whittlesford
- Willingham And Over
- Cambourne
- Fen Ditton & Fulbourn
- Harston & Comberton
- Shelford
- Foxton
- Barrington
- Caxton & Papworth
- Over & Willingham
- Milton & Waterbeach
- Histon & Impington
Property price trends in Cambridge
According to the latest Land Registry data, the average home in Cambridge sold for £512,919 in 2026. That figure comes from a substantial record of 128,860 sales logged over the past 31 years.
Prices have softened over the last three years. Compared with 2023, when the typical sale came in around £521,635, that's a fall of roughly 1.7%.
Looking back five years, average prices are up about 7.6% since 2021, a gain of around £36,175 in cash terms.
Zoom out to the past decade for the fuller picture. Back in 2016, homes here averaged £434,774, so the typical sold price has climbed about 18% since then, roughly 1.7% a year. Stretch the view to fifteen years and that annual pace edges up closer to 3.7%.
Frequently asked questions about Cambridge
What is the average price for a property for sale in Cambridge?
The average price for a property for sale in Cambridge is £516,382. This amount is 31% higher than the average price in Cambridgeshire. There are more than 10,000 property listings for sale in Cambridge.
What locations have the most expensive properties for sale in Cambridge?
The locations with the most expensive properties for sale in Cambridge are Newnham at an average of £1,211,843, Queen Ediths at an average of £886,936 and Shelford at an average of £812,875.
What locations have the most affordable properties for sale in Cambridge?
The locations with the most affordable properties for sale in Cambridge are Cambourne at an average of £344,345, Caxton & Papworth at an average of £345,625 and Gamlingay at an average of £360,000.
Which train stations are available in or near Cambridge?
Some of the train stations available in or near Cambridge are Cambridge, Cambridge North and Shelford.
Property Price Paid in Cambridge by Year
The average sold property price by year was:
| Year | Average Sold Price | Price Change |
Sold Properties
|
|---|---|---|---|
| 2026 | £512,919 | 0,1% |
211 Properties |
| 2025 | £512,403 | -1% |
2,970 Properties |
| 2024 | £515,449 | -1% |
3,184 Properties |
| 2023 | £521,635 | -1% |
2,955 Properties |
| 2022 | £525,677 | 9% |
3,529 Properties |
| 2021 | £476,744 | 4% |
4,478 Properties |
| 2020 | £456,743 | 2% |
3,329 Properties |
| 2019 | £448,725 | 1% |
3,877 Properties |
| 2018 | £442,496 | -3% |
3,953 Properties |
| 2017 | £457,815 | 5% |
4,197 Properties |
Property Price per Property Type in Cambridge
Here you can find historic sold price data in order to help with your property search.
The average Property Paid Price for specific property types in the last three years are:
| Property Type | Average Sold Price | Sold Properties |
|---|---|---|
| Semi Detached House | £492,516.00 | 2,431 Semi Detached Houses |
| Terraced House | £468,482.00 | 2,733 Terraced Houses |
| Detached House | £717,629.00 | 2,573 Detached Houses |
| Flat | £308,628.00 | 1,583 Flats |
Transport in Cambridge
Please see below transportation links in this area:
