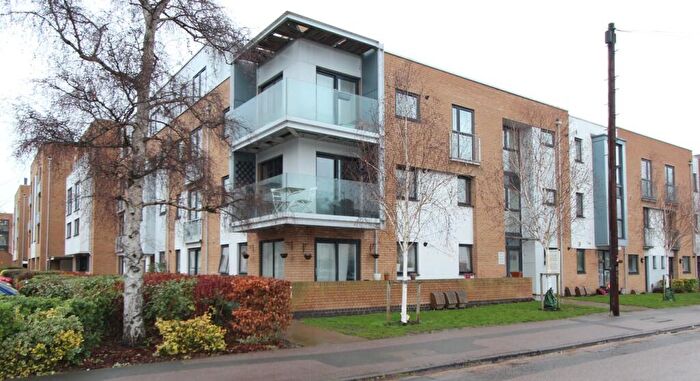
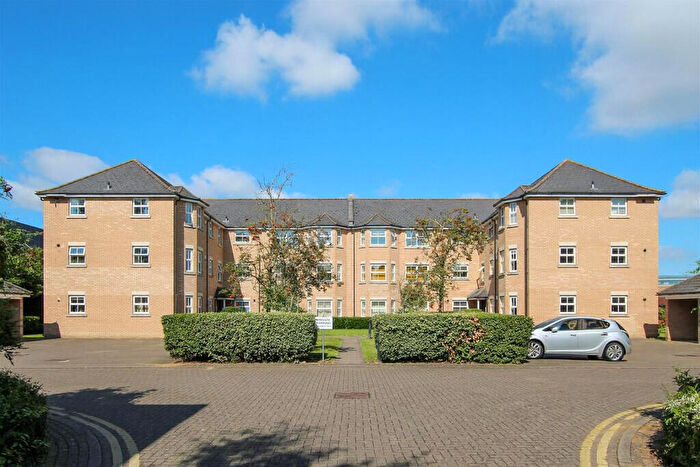
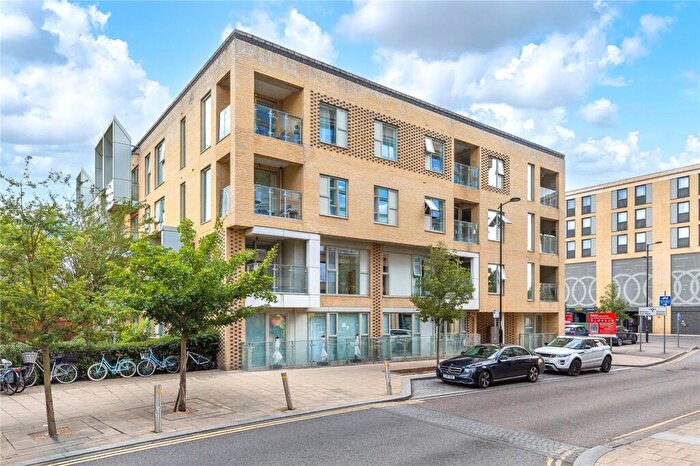
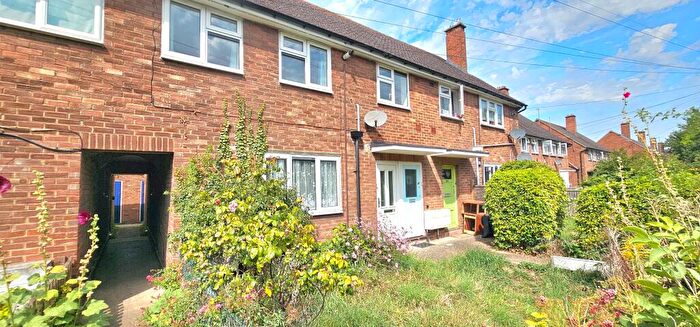
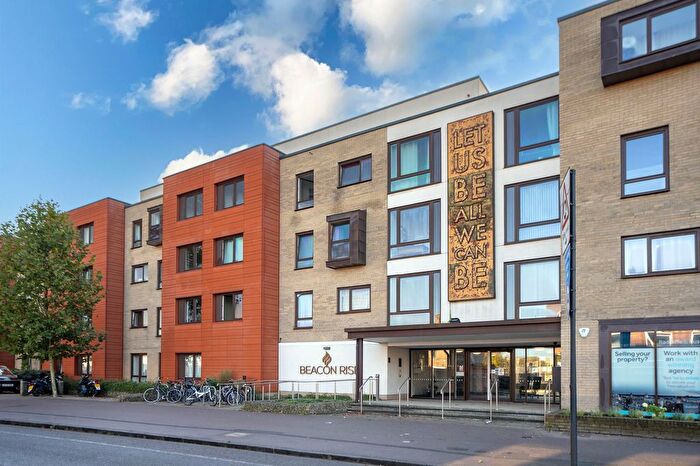
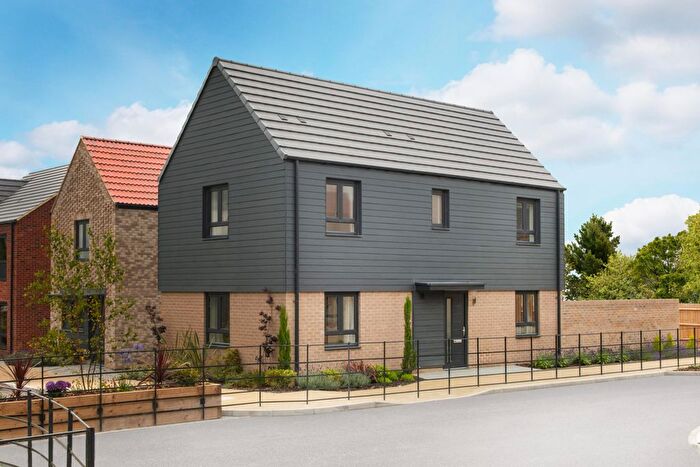
Houses for sale & to rent in Romsey, Cambridge
House Prices in Romsey
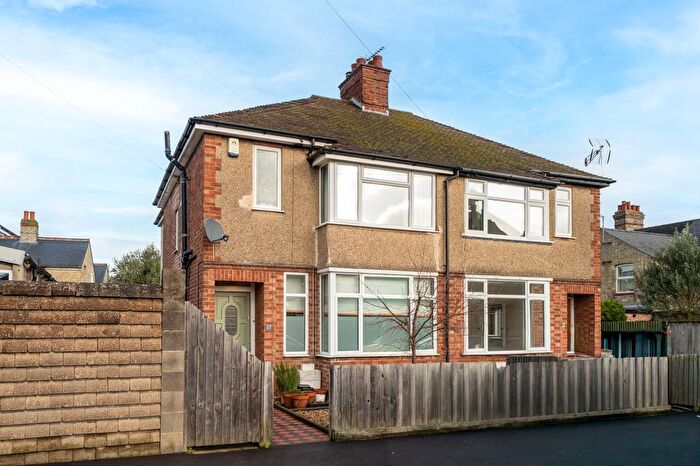
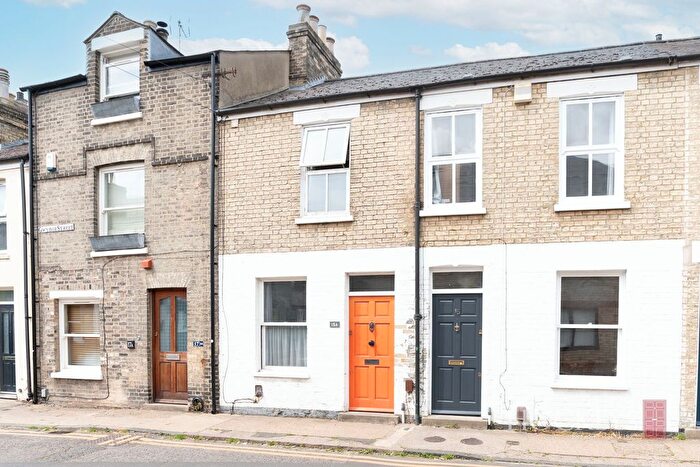
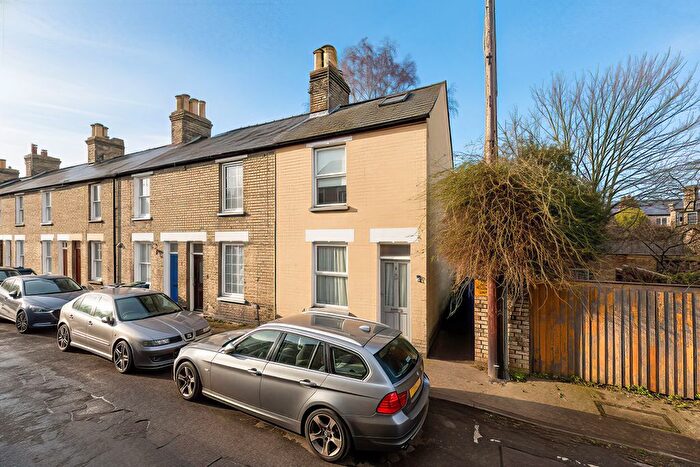
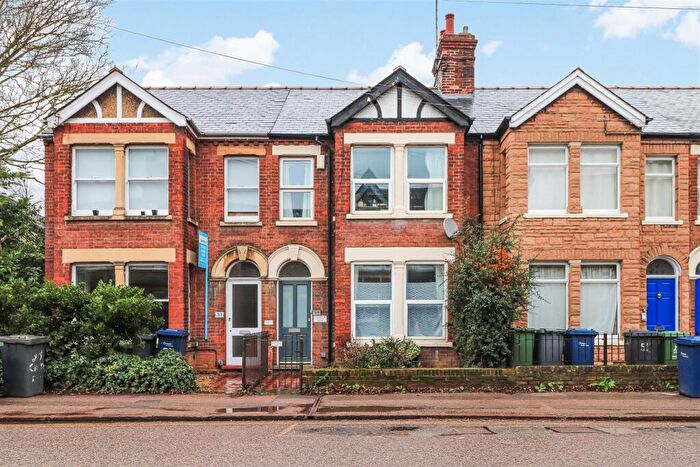
Properties in Romsey have an average house price of £495,374.00 and had 363 Property Transactions within the last 3 years¹.
Romsey is an area in Cambridge, Cambridgeshire with 3,837 households², where the most expensive property was sold for £1,100,000.00.
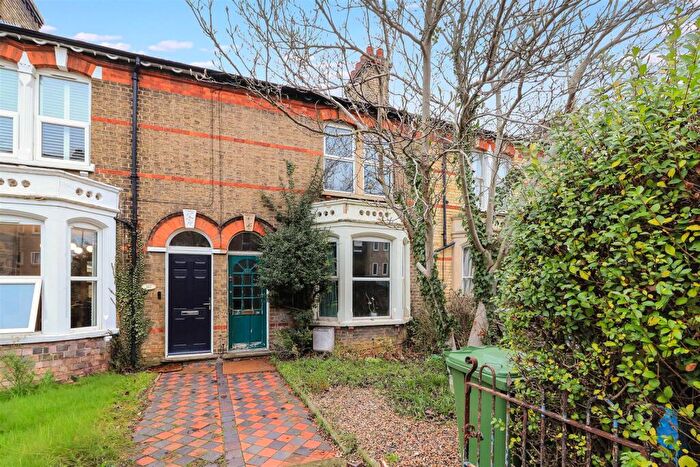
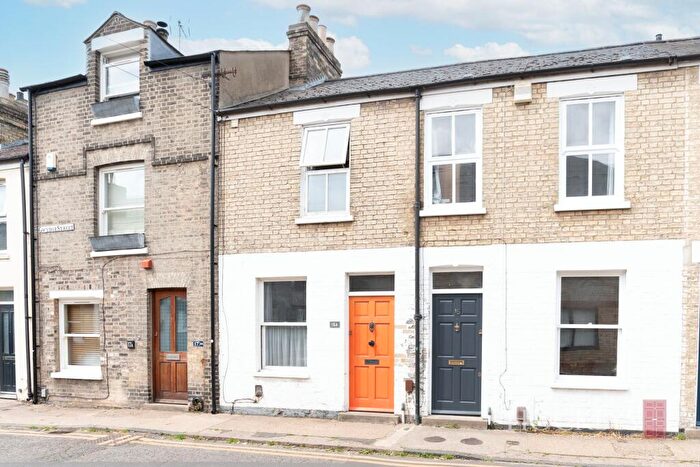
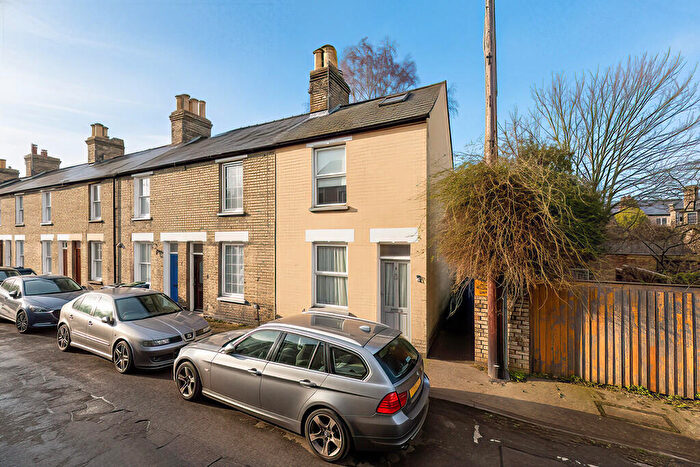
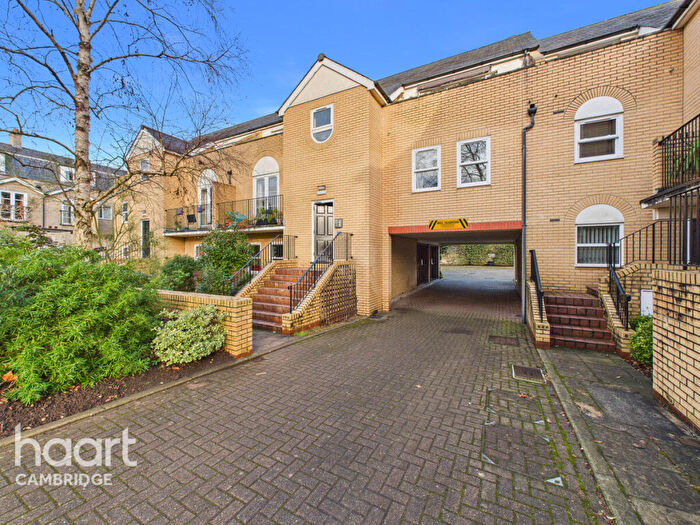
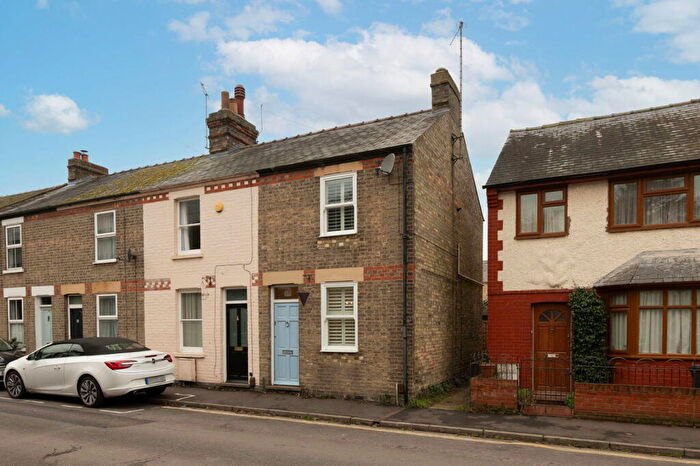
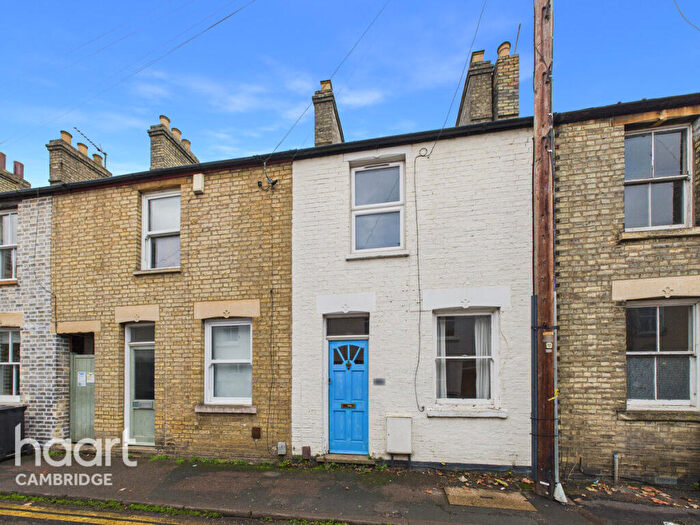
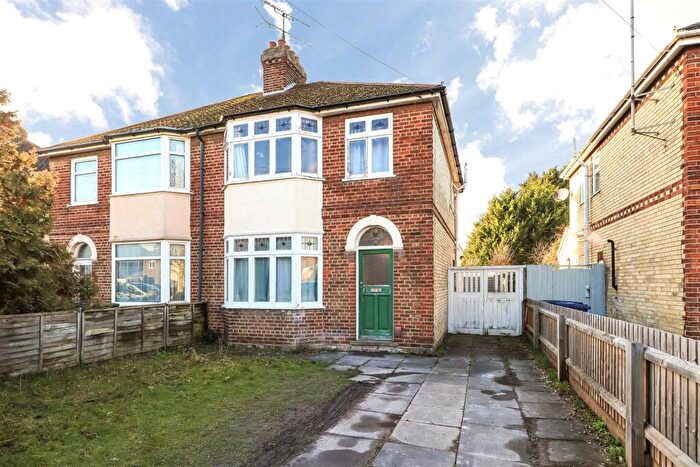
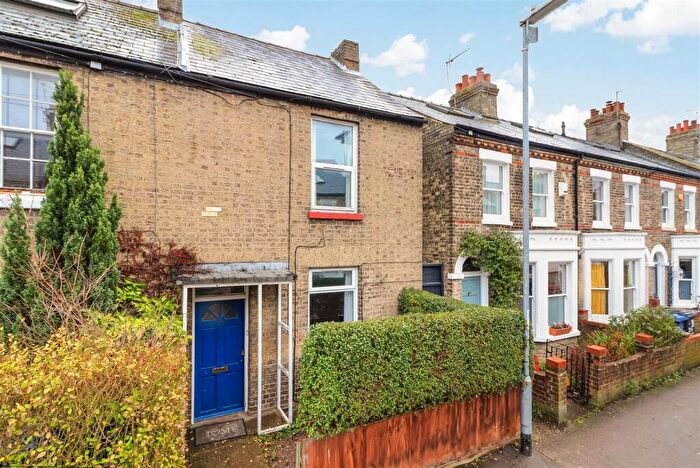
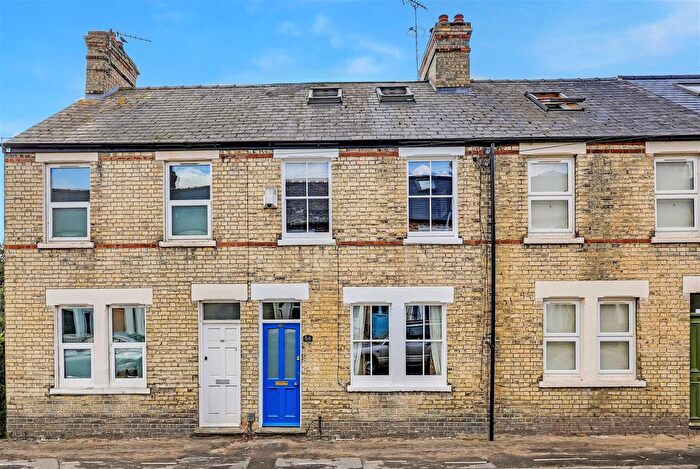
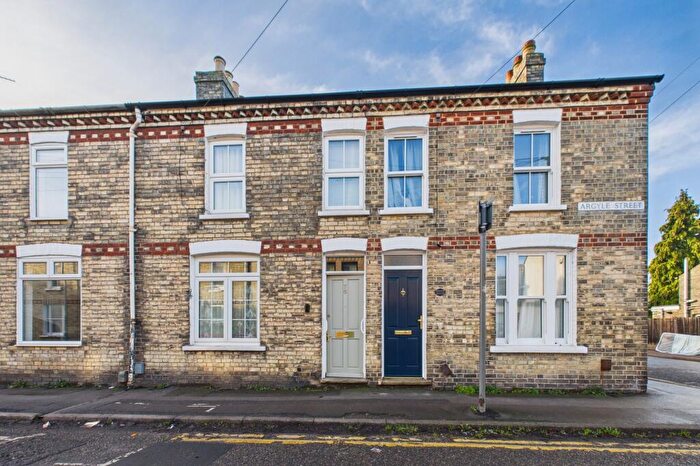
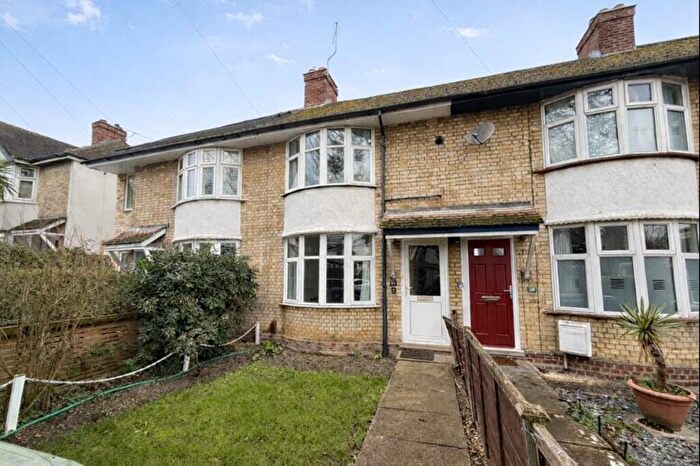
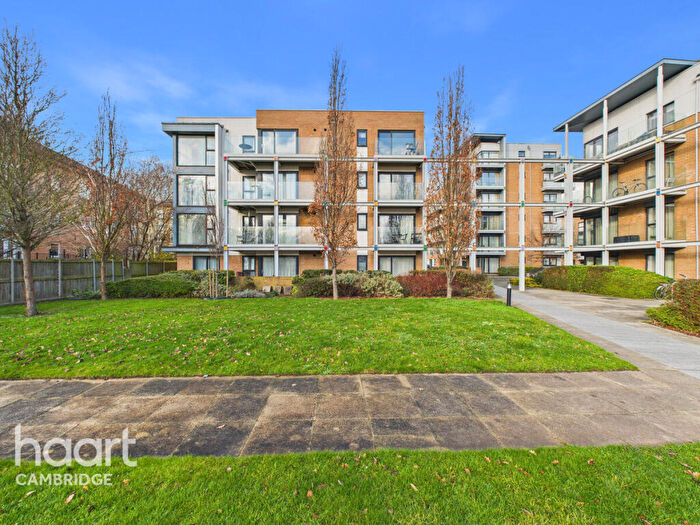
Properties for sale in Romsey
Roads and Postcodes in Romsey
Navigate through our locations to find the location of your next house in Romsey, Cambridge for sale or to rent.
| Streets | Postcodes |
|---|---|
| Alfred Court | CB1 3XB |
| Antwerp Cottages | CB1 3AU |
| Argyle Street | CB1 3LR CB1 3LS |
| Belgrave Road | CB1 3DE |
| Bill Briggs Court | CB1 3UY |
| Brampton Road | CB1 3HJ CB1 3HL |
| Brookfields | CB1 3NW CB1 3NZ CB1 3EJ |
| Brooks Road | CB1 3HP CB1 3HR |
| Budleigh Close | CB1 3BJ |
| Burnside | CB1 3PA |
| Campbell Street | CB1 3NE |
| Catharine Street | CB1 3AP CB1 3AR CB1 3AW CB1 3BQ |
| Cavendish Place | CB1 3BH |
| Cavendish Road | CB1 3AE CB1 3AF CB1 3FZ |
| Charles Street | CB1 3LZ |
| Clara Rackham Street | CB1 3FH CB1 3FJ CB1 3FL CB1 3FN |
| Cockburn Street | CB1 3NB CB1 3LT |
| Coldhams Grove | CB1 3HW |
| Coldhams Lane | CB1 3HH CB1 3HN CB1 3HY CB1 3JB CB1 3EN CB1 3HS |
| Coldhams Place | CB1 3HE |
| Coldhams Road | CB1 3EW |
| Coleridge Road | CB1 3NU CB1 3GB |
| Cromarty Place | CB1 3XD |
| Cromwell Road | CB1 3EB CB1 3EE CB1 3EF CB1 3EG CB1 3EQ CB1 3FA CB1 3FB CB1 3UR CB1 3US CB1 3BA |
| Cyprus Road | CB1 3QA |
| David Street | CB1 3LY |
| Fairfax Road | CB1 3AY CB1 3AZ CB1 3BB CB1 3BD |
| Fletchers Terrace | CB1 3LU |
| Great Eastern Street | CB1 3AB CB1 3AD |
| Greville Road | CB1 3QJ CB1 3QL |
| Hampden Gardens | CB1 3EL |
| Hemingford Road | CB1 3BY CB1 3BZ |
| Hobart Road | CB1 3PU |
| Hope Street | CB1 3NA |
| Janes Court | CB1 3JJ |
| Jubilee Terrace | CB1 3GQ |
| Leah Manning Close | CB1 3FR |
| Madras Road | CB1 3PX |
| Malta Road | CB1 3PZ CB1 3EY |
| Marmora Road | CB1 3PY |
| Mill Road | CB1 3AA CB1 3AN CB1 3BE CB1 3DF CB1 3LP CB1 3NF CB1 3NL CB1 3NN CB1 3PE CB1 3UG CB1 3DG CB1 3DL CB1 3NQ |
| Montreal Road | CB1 3NP |
| Montreal Square | CB1 3NR |
| Natal Road | CB1 3NS CB1 3NY |
| Nuttings Road | CB1 3HU |
| Redmond Court | CB1 3GA |
| Romsey Mews | CB1 3PB |
| Romsey Road | CB1 3DD |
| Romsey Terrace | CB1 3NH |
| Ross Street | CB1 3BP CB1 3BS CB1 3BT CB1 3BU CB1 3BX CB1 3UZ |
| Sedgwick Street | CB1 3AJ CB1 3AL |
| Seymour Street | CB1 3DH CB1 3DQ CB1 3DJ |
| St Philips Road | CB1 3AQ CB1 3DA CB1 3DB CB1 3UU |
| Stockwell Street | CB1 3DZ CB1 3ND |
| Stourbridge Grove | CB1 3HZ CB1 3JA |
| Suez Road | CB1 3QB |
| Swanns Terrace | CB1 3LX |
| The Broadway | CB1 3AH |
| The Paddocks | CB1 3HG |
| The Terrace | CB1 3DU |
| Thoday Street | CB1 3AS CB1 3AT CB1 3AX CB1 3BN |
| Tom Amey Court | CB1 3UX |
| Uphall Road | CB1 3HX |
| Vinery Park | CB1 3GN |
| Vinery Road | CB1 3DN CB1 3DP CB1 3DS CB1 3DT CB1 3DW CB1 3BW |
| Vinery Way | CB1 3DR |
| Vineyard Place | CB1 3BL |
| Wetenhall Road | CB1 3AG |
| William Smith Close | CB1 3QE CB1 3QF |
| Wycliffe Road | CB1 3JD CB1 3JE |
Transport near Romsey
- FAQ
- Price Paid By Year
- Property Type Price
Frequently asked questions about Romsey
What is the average price for a property for sale in Romsey?
The average price for a property for sale in Romsey is £495,374. This amount is 4% lower than the average price in Cambridge. There are 1,037 property listings for sale in Romsey.
What streets have the most expensive properties for sale in Romsey?
The streets with the most expensive properties for sale in Romsey are Romsey Road at an average of £756,666, Greville Road at an average of £738,273 and Hemingford Road at an average of £688,137.
What streets have the most affordable properties for sale in Romsey?
The streets with the most affordable properties for sale in Romsey are Coleridge Road at an average of £197,166, Hampden Gardens at an average of £326,166 and William Smith Close at an average of £332,779.
Which train stations are available in or near Romsey?
Some of the train stations available in or near Romsey are Cambridge, Cambridge North and Shelford.
Property Price Paid in Romsey by Year
The average sold property price by year was:
| Year | Average Sold Price | Price Change |
Sold Properties
|
|---|---|---|---|
| 2025 | £490,535 | -5% |
112 Properties |
| 2024 | £514,249 | 6% |
117 Properties |
| 2023 | £482,939 | 1% |
134 Properties |
| 2022 | £476,942 | 1% |
127 Properties |
| 2021 | £469,930 | 7% |
167 Properties |
| 2020 | £435,760 | 3% |
117 Properties |
| 2019 | £422,506 | 1% |
170 Properties |
| 2018 | £419,118 | -8% |
125 Properties |
| 2017 | £454,284 | 10% |
140 Properties |
| 2016 | £408,985 | 5% |
143 Properties |
| 2015 | £386,877 | 14% |
151 Properties |
| 2014 | £333,855 | 11% |
192 Properties |
| 2013 | £297,659 | 5% |
183 Properties |
| 2012 | £281,924 | 6% |
125 Properties |
| 2011 | £264,958 | 1% |
182 Properties |
| 2010 | £263,452 | 16% |
164 Properties |
| 2009 | £221,445 | -9% |
163 Properties |
| 2008 | £240,679 | -4% |
127 Properties |
| 2007 | £250,105 | 21% |
210 Properties |
| 2006 | £198,700 | -3% |
311 Properties |
| 2005 | £205,327 | -2% |
218 Properties |
| 2004 | £208,964 | 16% |
205 Properties |
| 2003 | £176,180 | 3% |
260 Properties |
| 2002 | £171,055 | 16% |
195 Properties |
| 2001 | £144,433 | 13% |
220 Properties |
| 2000 | £125,209 | 13% |
199 Properties |
| 1999 | £108,797 | 14% |
248 Properties |
| 1998 | £93,868 | 9% |
215 Properties |
| 1997 | £85,865 | 19% |
237 Properties |
| 1996 | £69,437 | 5% |
227 Properties |
| 1995 | £65,972 | - |
192 Properties |
Property Price per Property Type in Romsey
Here you can find historic sold price data in order to help with your property search.
The average Property Paid Price for specific property types in the last three years are:
| Property Type | Average Sold Price | Sold Properties |
|---|---|---|
| Semi Detached House | £606,305.00 | 57 Semi Detached Houses |
| Detached House | £710,000.00 | 8 Detached Houses |
| Terraced House | £522,222.00 | 230 Terraced Houses |
| Flat | £286,329.00 | 68 Flats |

