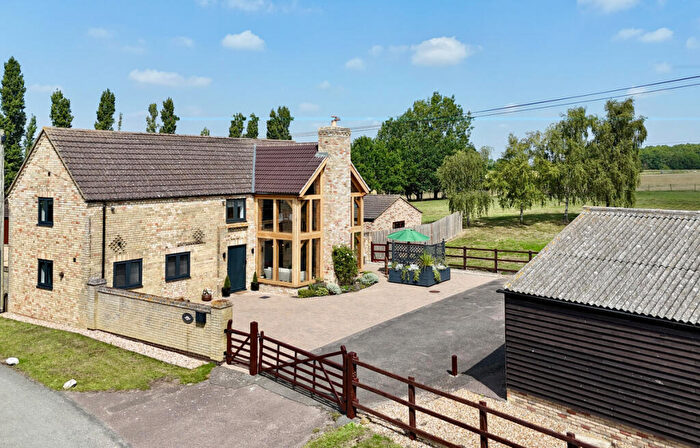
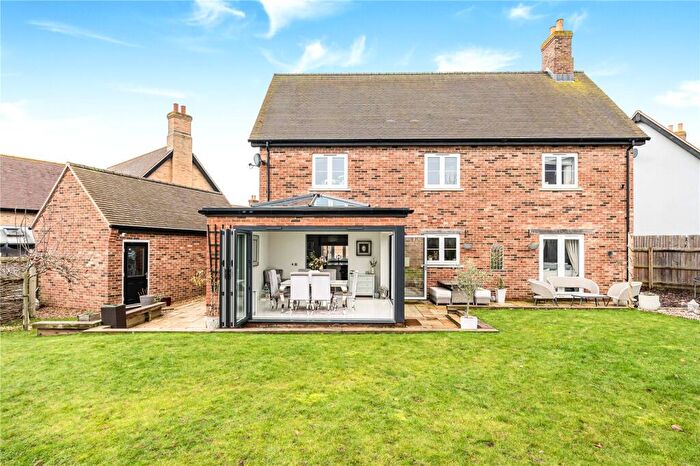
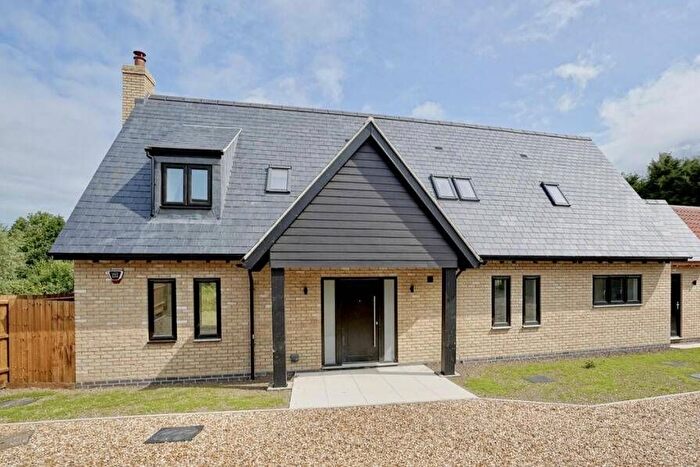
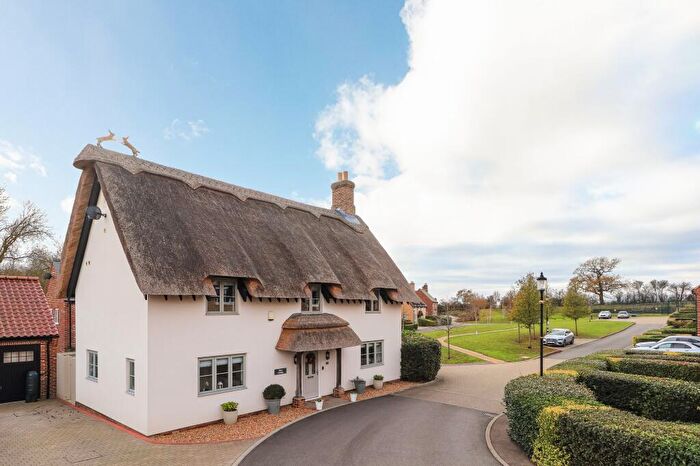
Houses for sale & to rent in Ellington, Huntingdon
House Prices in Ellington
Properties in Ellington have an average house price of £554,132.00 and had 79 Property Transactions within the last 3 years¹.
Ellington is an area in Huntingdon, Cambridgeshire with 1,156 households², where the most expensive property was sold for £1,350,000.00.
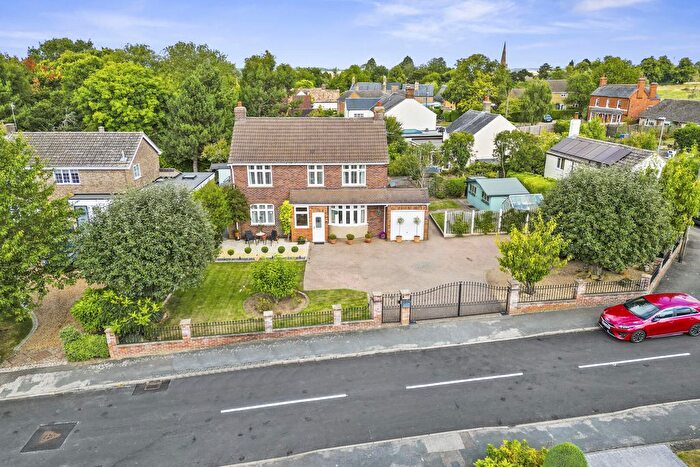
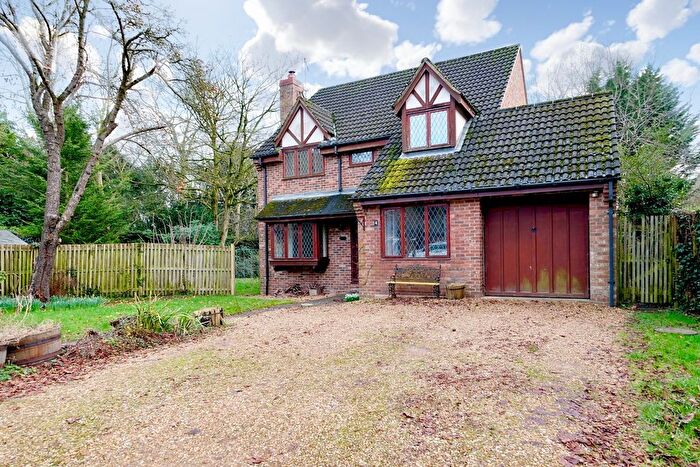
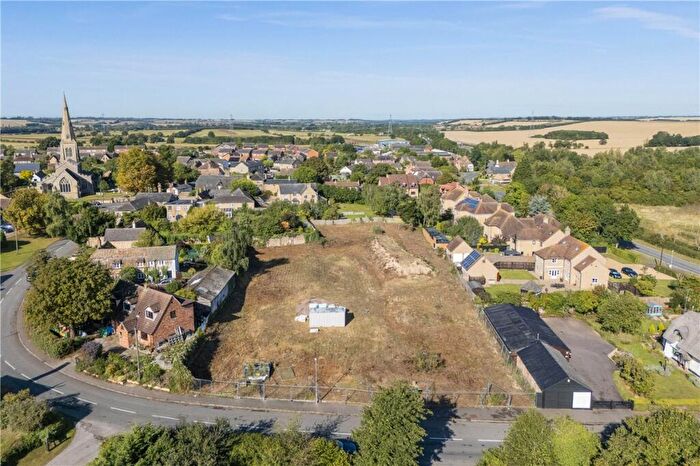
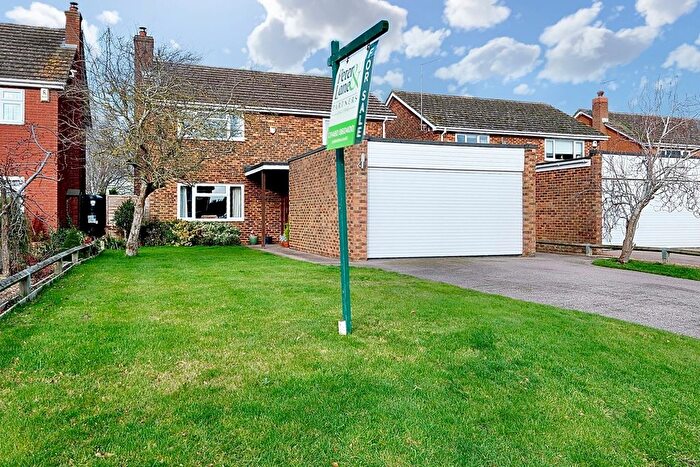
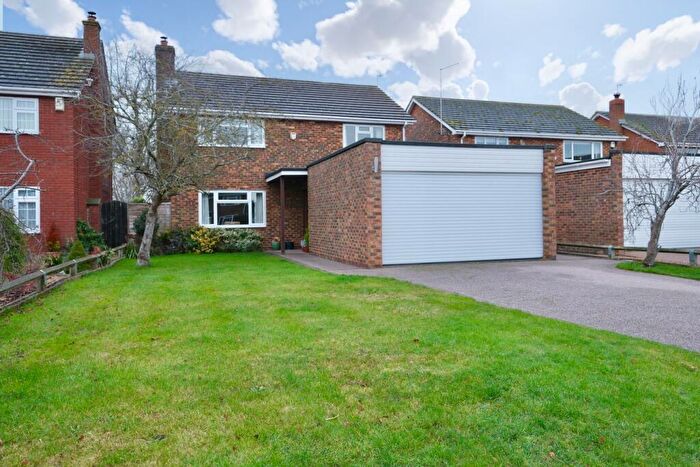
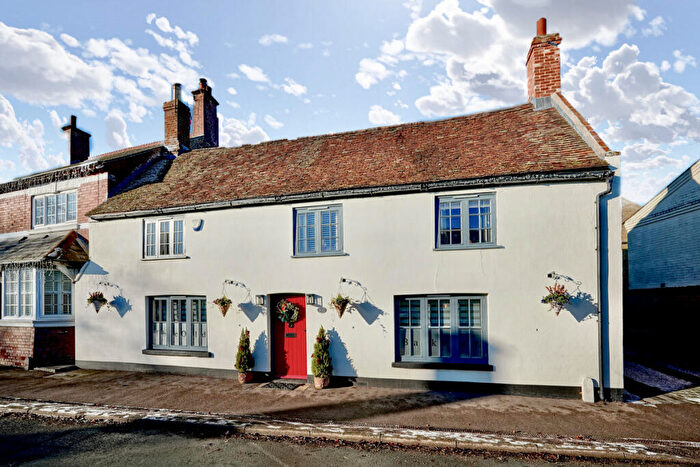
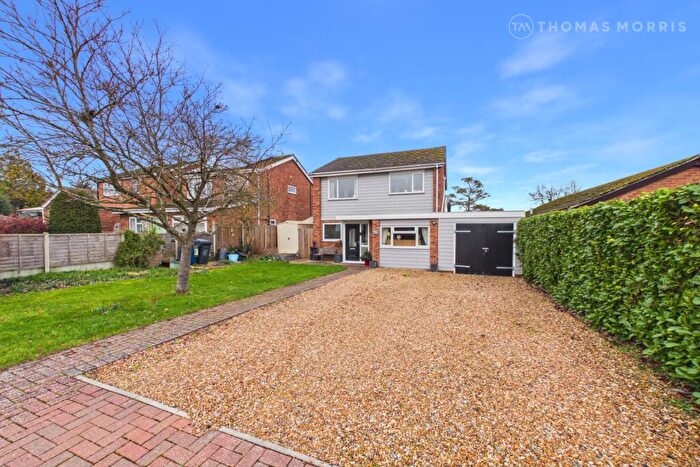
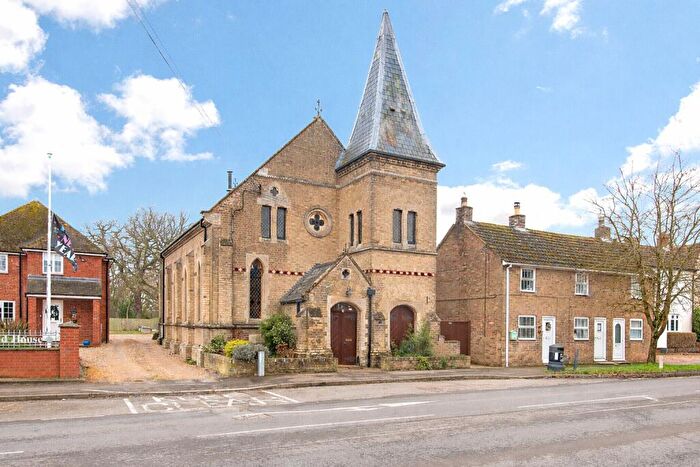
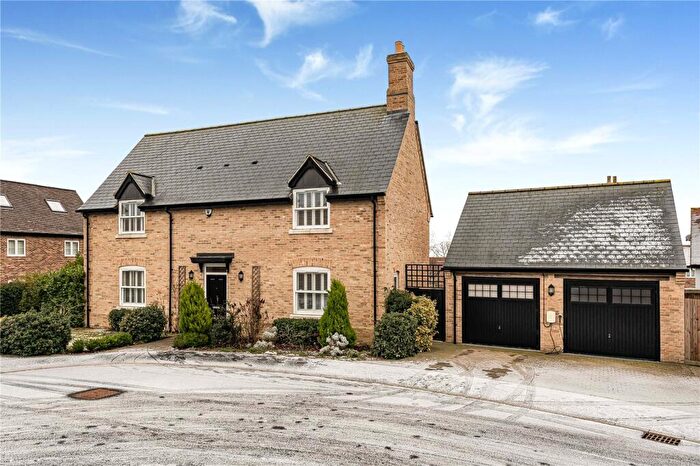
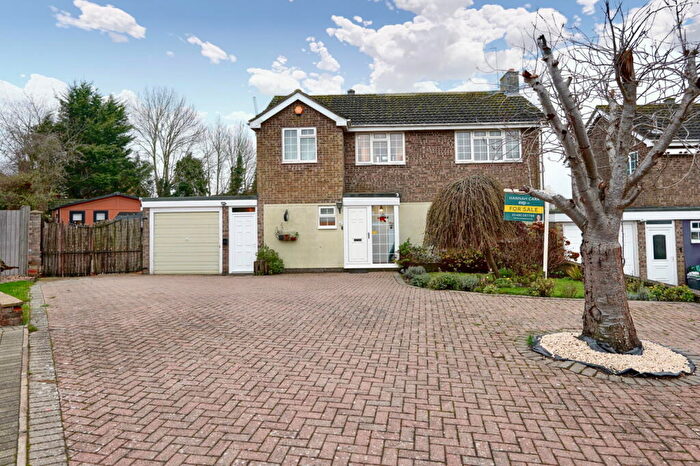
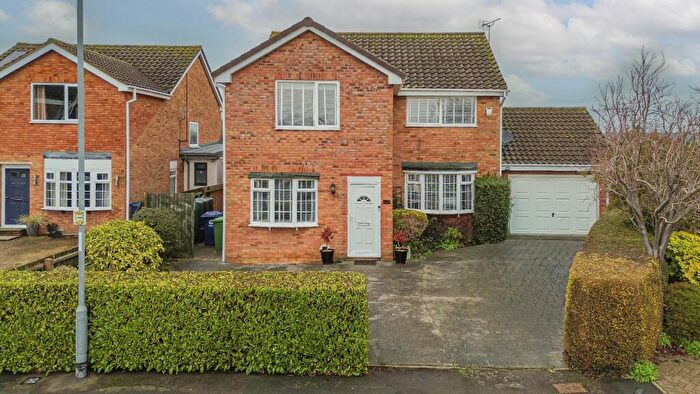
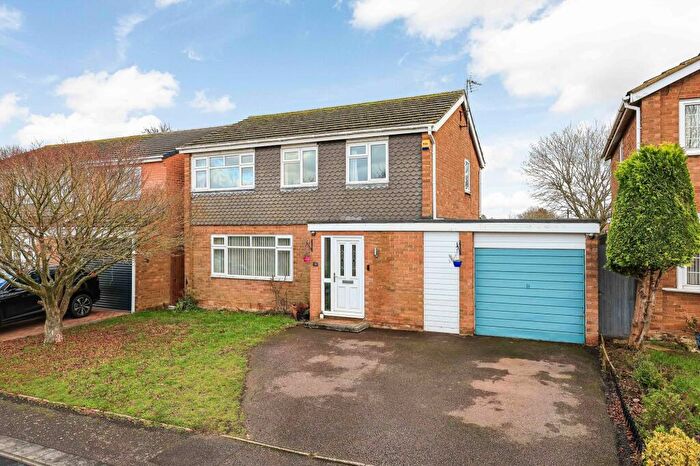
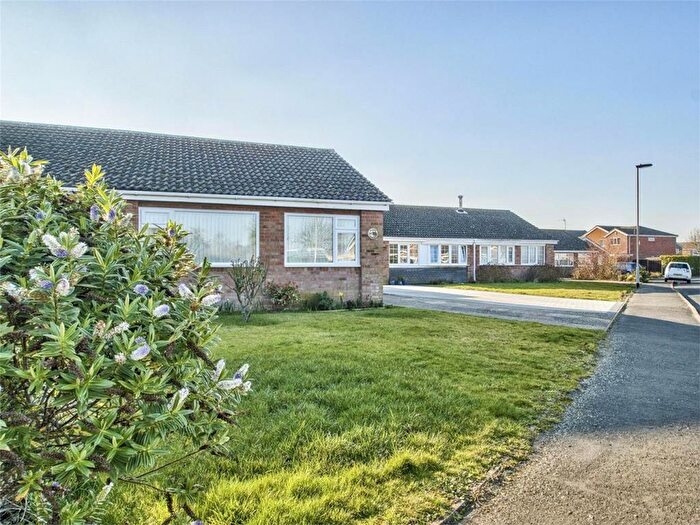
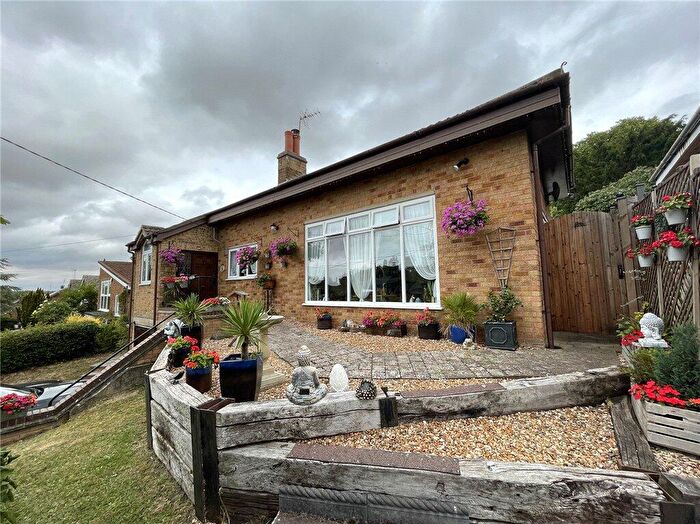
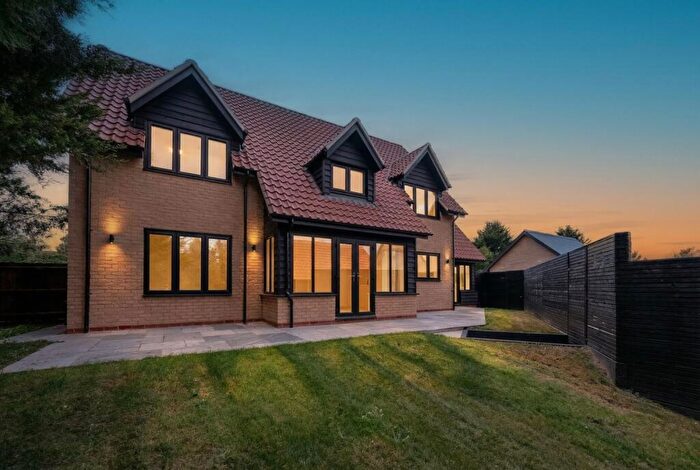
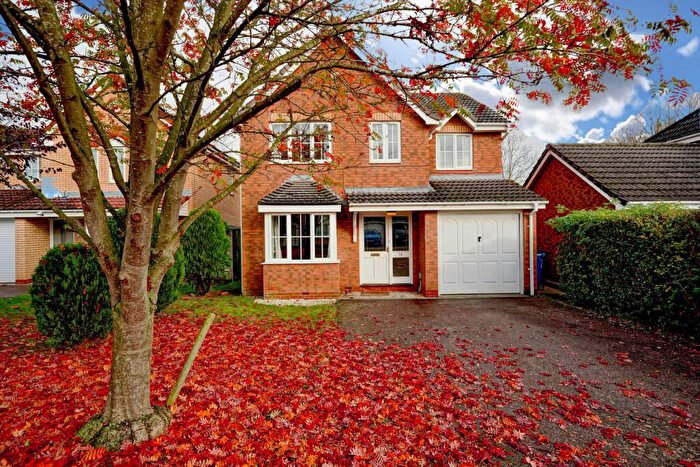
Properties for sale in Ellington
Roads and Postcodes in Ellington
Navigate through our locations to find the location of your next house in Ellington, Huntingdon for sale or to rent.
| Streets | Postcodes |
|---|---|
| Barham Road | PE28 5AN PE28 5AP PE28 5AQ PE28 5BF |
| Blacksmiths Lane | PE28 0AG |
| Bream Close | PE28 5AU |
| Brington Road | PE28 5LP |
| Broadweir | PE28 0UB |
| Brookside | PE28 0QH |
| Burton Way | PE28 0YX PE28 0YY |
| Chapel Lane | PE28 0TX |
| Church End | PE28 0PB |
| Church Lane | PE28 0AL PE28 0TB PE28 0TN PE28 5AE PE28 5AX |
| Church Road | PE28 0PA PE28 0TU PE28 5AL |
| Church View | PE28 0RF |
| Church Walk | PE28 0TW |
| Clopton Road | PE28 5LT |
| Croxton Gardens | PE28 0SE |
| Easton Road | PE28 0TZ |
| Ferriman Road | PE28 0TQ |
| Fox Road | PE28 0PG |
| Fuller Close | PE28 0YU |
| Grafham Road | PE28 0AF PE28 0AN PE28 0AP PE28 0AW |
| Grange Croft | PE28 0WN |
| Green Lane | PE28 0AZ |
| Hamerton Road | PE28 5AJ |
| High Street | PE28 0AB PE28 0AD PE28 0PF PE28 0TD |
| Hillside Close | PE28 0AR |
| Ivy Way | PE28 0UN |
| Kimbolton Road | PE28 0TR |
| Leighton Road | PE28 5LW |
| Linden Grove | PE28 0RG |
| Littlecotes Close | PE28 0UL |
| Loop Road | PE28 0RE PE28 0RW |
| Main Street | PE28 5LL |
| Malting Lane | PE28 0AA |
| Molesworth Lodge Cottage | PE28 0PJ |
| Mount Pleasant | PE28 0TG |
| Old Weston Road | PE28 5AG |
| Parsons Drive | PE28 0AU |
| Pound Close | PE28 0UH |
| Royston Avenue | PE28 0TH |
| School Lane | PE28 0QS |
| Sheep Street | PE28 5AY |
| Spaldwick Road | PE28 0TL |
| Spinney Field | PE28 0AT |
| St Peters Way | PE28 0AX |
| Station Road | PE28 0PE |
| Staunch Hill | PE28 5BE |
| Stonely Road | PE28 0TS PE28 0TT |
| Stow Road | PE28 0TE |
| The Avenue | PE28 5AW |
| The Green | PE28 0AQ |
| The Lane | PE28 0TP PE28 0TY |
| The Park | PE28 0RD |
| The Village | PE28 5AB |
| Thrapston Road | PE28 0AE PE28 0PW PE28 0TA |
| Toll Bar Lane | PE28 0RB |
| Warren Lane | PE28 0QU |
| West Bank | PE28 5LJ |
| Windmill Close | PE28 0AJ |
| Woolley Road | PE28 5AA |
| Yeomans Close | PE28 0PL |
| PE28 0PD PE28 0QD PE28 0QF PE28 0QJ PE28 0QN PE28 0QP PE28 0QR PE28 0QT PE28 0RA PE28 0RQ PE28 5AD PE28 5AF PE28 5AR PE28 5AS PE28 5AT |
Transport near Ellington
- FAQ
- Price Paid By Year
- Property Type Price
Frequently asked questions about Ellington
What is the average price for a property for sale in Ellington?
The average price for a property for sale in Ellington is £554,132. This amount is 63% higher than the average price in Huntingdon. There are 838 property listings for sale in Ellington.
What streets have the most expensive properties for sale in Ellington?
The streets with the most expensive properties for sale in Ellington are Chapel Lane at an average of £1,037,500, Church Lane at an average of £840,833 and Spaldwick Road at an average of £796,250.
What streets have the most affordable properties for sale in Ellington?
The streets with the most affordable properties for sale in Ellington are The Lane at an average of £252,500, Windmill Close at an average of £258,000 and Brookside at an average of £348,000.
Which train stations are available in or near Ellington?
Some of the train stations available in or near Ellington are Huntingdon, St.Neots and Wellingborough.
Property Price Paid in Ellington by Year
The average sold property price by year was:
| Year | Average Sold Price | Price Change |
Sold Properties
|
|---|---|---|---|
| 2025 | £567,774 | 1% |
31 Properties |
| 2024 | £560,960 | 6% |
25 Properties |
| 2023 | £528,326 | 4% |
23 Properties |
| 2022 | £509,637 | -0,4% |
52 Properties |
| 2021 | £511,861 | 15% |
67 Properties |
| 2020 | £437,247 | 6% |
37 Properties |
| 2019 | £410,369 | -12% |
46 Properties |
| 2018 | £458,875 | 8% |
32 Properties |
| 2017 | £422,658 | 4% |
46 Properties |
| 2016 | £404,166 | 19% |
42 Properties |
| 2015 | £326,430 | -4% |
54 Properties |
| 2014 | £339,018 | -6% |
51 Properties |
| 2013 | £358,132 | 12% |
50 Properties |
| 2012 | £313,486 | -11% |
37 Properties |
| 2011 | £347,272 | 1% |
22 Properties |
| 2010 | £344,194 | 16% |
22 Properties |
| 2009 | £289,450 | -29% |
28 Properties |
| 2008 | £373,087 | 13% |
20 Properties |
| 2007 | £323,250 | -19% |
68 Properties |
| 2006 | £385,989 | 19% |
60 Properties |
| 2005 | £313,259 | 7% |
53 Properties |
| 2004 | £291,348 | 2% |
50 Properties |
| 2003 | £286,007 | 18% |
67 Properties |
| 2002 | £233,828 | 7% |
63 Properties |
| 2001 | £217,266 | 20% |
68 Properties |
| 2000 | £173,999 | 11% |
71 Properties |
| 1999 | £154,828 | 0,3% |
98 Properties |
| 1998 | £154,371 | 22% |
59 Properties |
| 1997 | £120,275 | 9% |
66 Properties |
| 1996 | £109,925 | 6% |
62 Properties |
| 1995 | £102,925 | - |
46 Properties |
Property Price per Property Type in Ellington
Here you can find historic sold price data in order to help with your property search.
The average Property Paid Price for specific property types in the last three years are:
| Property Type | Average Sold Price | Sold Properties |
|---|---|---|
| Semi Detached House | £384,083.00 | 18 Semi Detached Houses |
| Detached House | £611,627.00 | 59 Detached Houses |
| Terraced House | £388,500.00 | 2 Terraced Houses |

