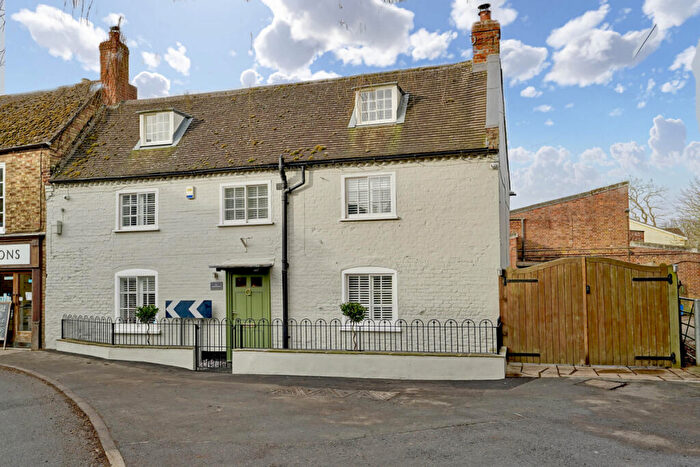
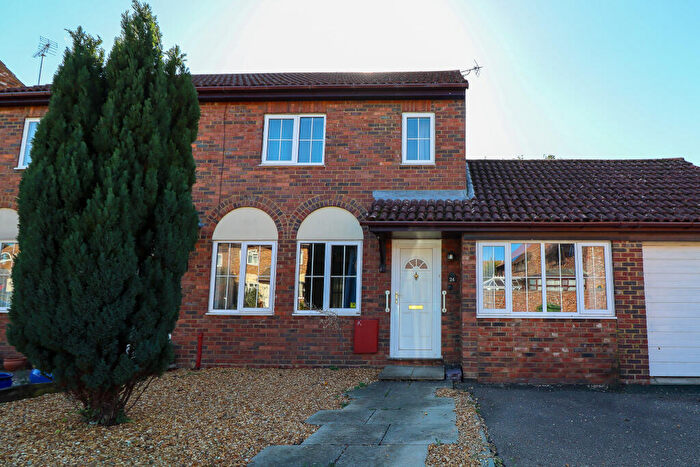
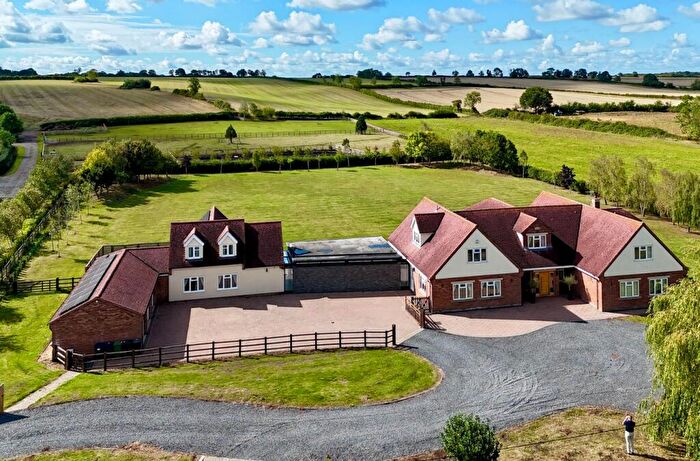
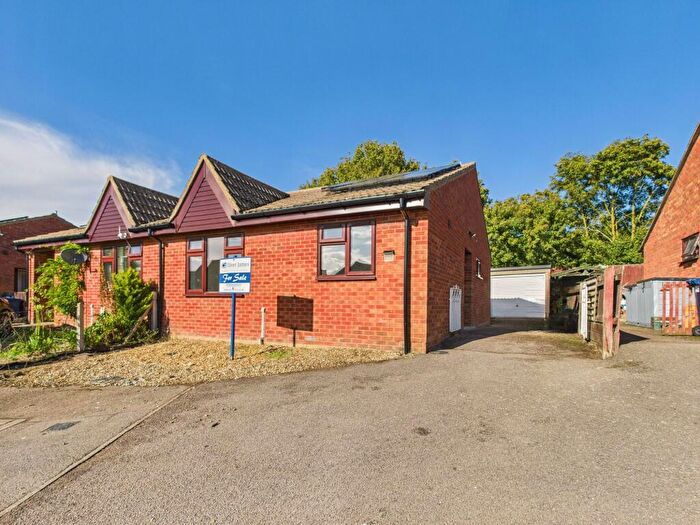
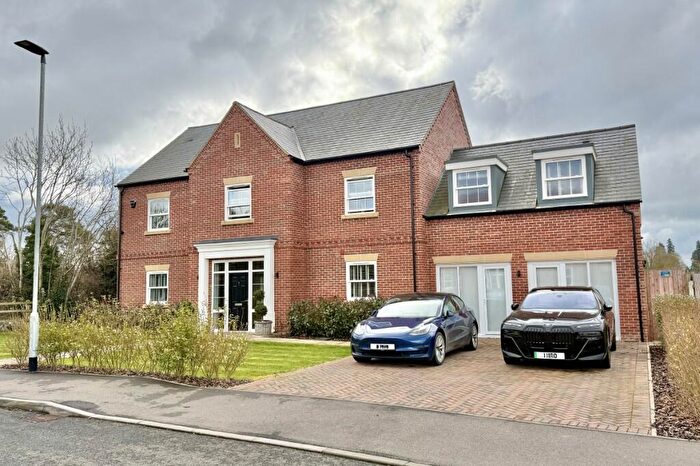
Houses for sale & to rent in Kimbolton And Staughton, Huntingdon
House Prices in Kimbolton And Staughton
Properties in Kimbolton And Staughton have an average house price of £428,948.00 and had 77 Property Transactions within the last 3 years¹.
Kimbolton And Staughton is an area in Huntingdon, Cambridgeshire with 576 households², where the most expensive property was sold for £1,500,000.00.
Properties for sale in Kimbolton And Staughton
Previously listed properties in Kimbolton And Staughton
Roads and Postcodes in Kimbolton And Staughton
Navigate through our locations to find the location of your next house in Kimbolton And Staughton, Huntingdon for sale or to rent.
| Streets | Postcodes |
|---|---|
| Aragon Place | PE28 0JD |
| Ashfield | PE28 0LD |
| Buskett Hill | PE28 0JX |
| Carnaby | PE28 0JB |
| Castle Gardens | PE28 0JE |
| Church Lane | PE28 0JS PE28 0RT |
| Church Yard | PE28 0HH |
| Constables Leys | PE28 0JG |
| Cross Street | PE28 0RS |
| Dukes Row | PE28 0JA |
| East Street | PE28 0HJ |
| Grass Yard | PE28 0HQ |
| High Street | PE28 0HA PE28 0HB PE28 0JP |
| Hunters Way | PE28 0JF |
| Keyston Road | PE28 0RR PE28 0RU |
| London Road | PE28 0HL |
| Montagu Gardens | PE28 0JL |
| Newtown | PE28 0HY |
| Newtown Lane | PE28 0HT |
| Pound Lane | PE28 0HR |
| St Andrew Lane | PE28 0HN |
| St Andrews Court | PE28 0BF |
| Station Road | PE28 0HS PE28 0JT PE28 0LB |
| Station Row | PE28 0JY |
| Stow Road | PE28 0HU |
| The Chestnuts | PE28 0EZ |
| The Pentelows | PE28 0RY |
| Thrapston Road | PE28 0HW |
| Tilbrook Road | PE28 0JW |
| Tollfield | PE28 0HP |
| Tudor Court | PE28 0LE |
| Valentine Gardens | PE28 0HX |
Transport near Kimbolton And Staughton
-
St.Neots Station
-
Huntingdon Station
-
Wellingborough Station
-
Bedford Midland Station
-
Bedford St.Johns Station
-
Sandy Station
- FAQ
- Price Paid By Year
- Property Type Price
Frequently asked questions about Kimbolton And Staughton
What is the average price for a property for sale in Kimbolton And Staughton?
The average price for a property for sale in Kimbolton And Staughton is £428,948. This amount is 25% higher than the average price in Huntingdon. There are 137 property listings for sale in Kimbolton And Staughton.
What streets have the most expensive properties for sale in Kimbolton And Staughton?
The streets with the most expensive properties for sale in Kimbolton And Staughton are Buskett Hill at an average of £1,200,000, Ashfield at an average of £504,166 and Station Road at an average of £499,000.
What streets have the most affordable properties for sale in Kimbolton And Staughton?
The streets with the most affordable properties for sale in Kimbolton And Staughton are Station Row at an average of £266,666, Thrapston Road at an average of £298,250 and High Street at an average of £319,541.
Which train stations are available in or near Kimbolton And Staughton?
Some of the train stations available in or near Kimbolton And Staughton are St.Neots, Huntingdon and Wellingborough.
Property Price Paid in Kimbolton And Staughton by Year
The average sold property price by year was:
| Year | Average Sold Price | Price Change |
Sold Properties
|
|---|---|---|---|
| 2025 | £420,676 | 12% |
13 Properties |
| 2024 | £371,944 | -9% |
18 Properties |
| 2023 | £403,600 | -18% |
15 Properties |
| 2022 | £477,782 | 4% |
31 Properties |
| 2021 | £457,763 | 16% |
36 Properties |
| 2020 | £384,676 | -12% |
25 Properties |
| 2019 | £429,666 | 21% |
15 Properties |
| 2018 | £341,434 | -3% |
23 Properties |
| 2017 | £353,289 | -8% |
28 Properties |
| 2016 | £380,325 | 11% |
36 Properties |
| 2015 | £338,890 | 2% |
33 Properties |
| 2014 | £331,249 | 10% |
50 Properties |
| 2013 | £299,666 | -11% |
21 Properties |
| 2012 | £332,972 | 20% |
20 Properties |
| 2011 | £264,968 | -17% |
16 Properties |
| 2010 | £309,470 | 14% |
25 Properties |
| 2009 | £267,659 | -28% |
22 Properties |
| 2008 | £341,812 | 24% |
16 Properties |
| 2007 | £258,628 | -5% |
27 Properties |
| 2006 | £271,806 | 10% |
39 Properties |
| 2005 | £244,574 | -11% |
31 Properties |
| 2004 | £272,196 | 14% |
29 Properties |
| 2003 | £233,307 | 23% |
25 Properties |
| 2002 | £180,627 | 4% |
29 Properties |
| 2001 | £173,742 | 7% |
34 Properties |
| 2000 | £162,101 | 20% |
38 Properties |
| 1999 | £129,468 | 18% |
33 Properties |
| 1998 | £105,955 | 24% |
38 Properties |
| 1997 | £80,216 | -20% |
37 Properties |
| 1996 | £96,356 | 25% |
52 Properties |
| 1995 | £72,398 | - |
38 Properties |
Property Price per Property Type in Kimbolton And Staughton
Here you can find historic sold price data in order to help with your property search.
The average Property Paid Price for specific property types in the last three years are:
| Property Type | Average Sold Price | Sold Properties |
|---|---|---|
| Semi Detached House | £377,907.00 | 20 Semi Detached Houses |
| Detached House | £522,465.00 | 40 Detached Houses |
| Terraced House | £296,821.00 | 14 Terraced Houses |
| Flat | £138,930.00 | 3 Flats |

