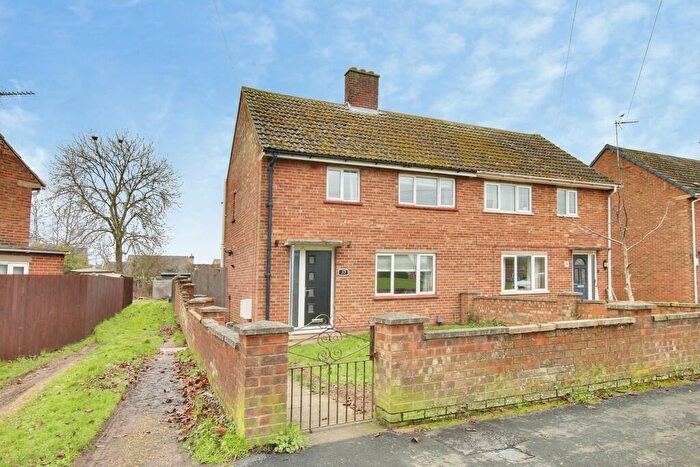
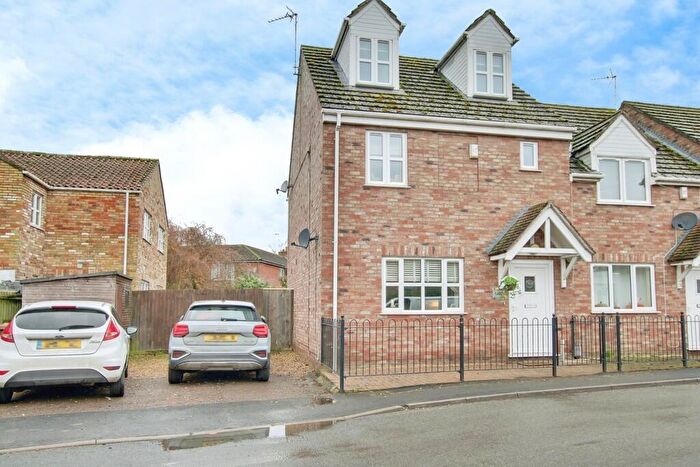
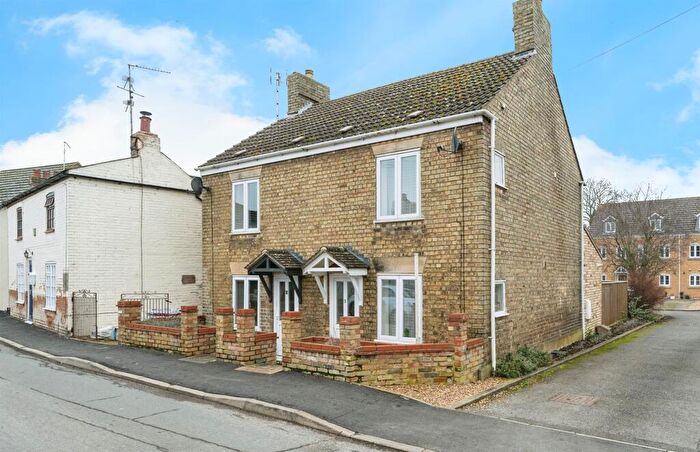
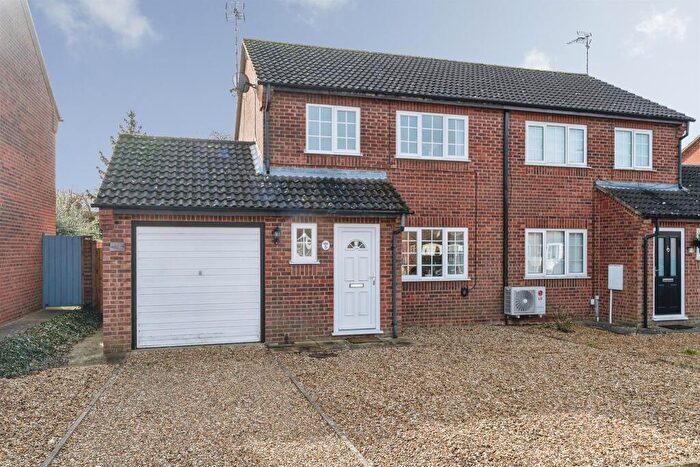
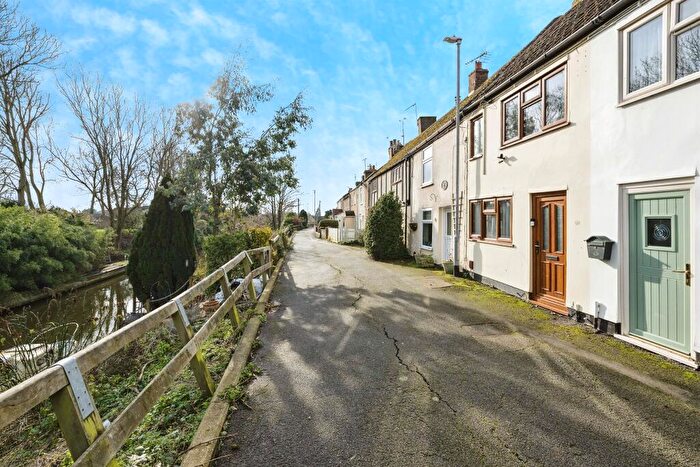
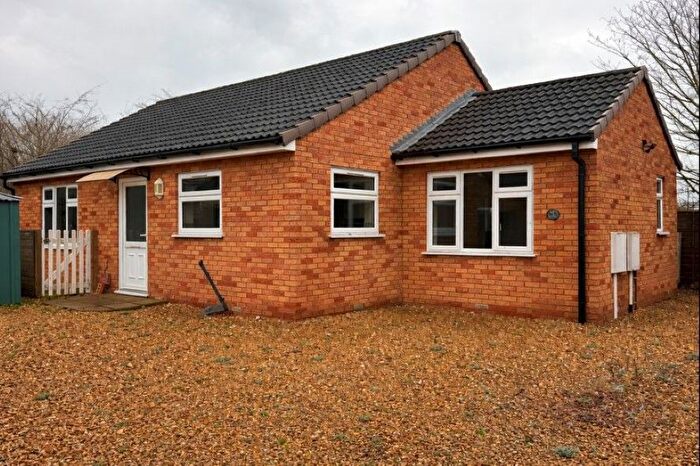
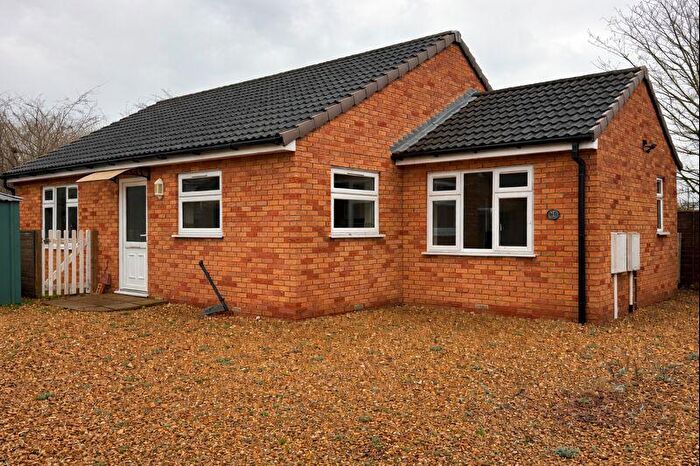
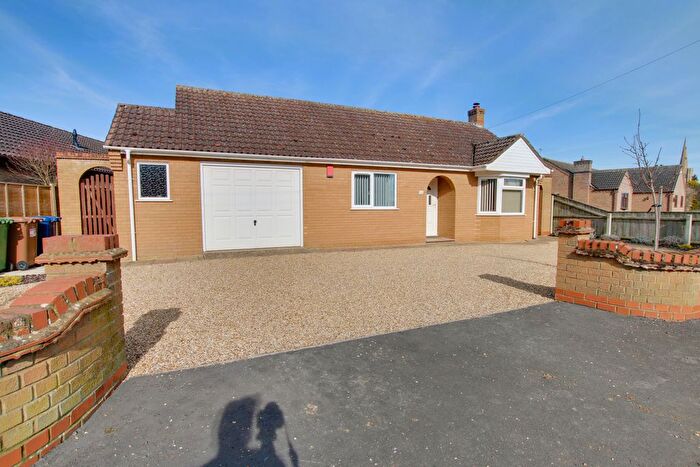
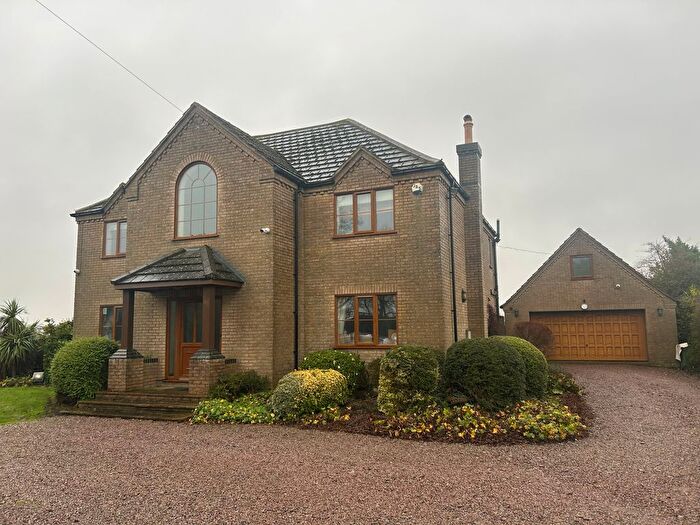
Houses for sale & to rent in Wimblington, March
House Prices in Wimblington
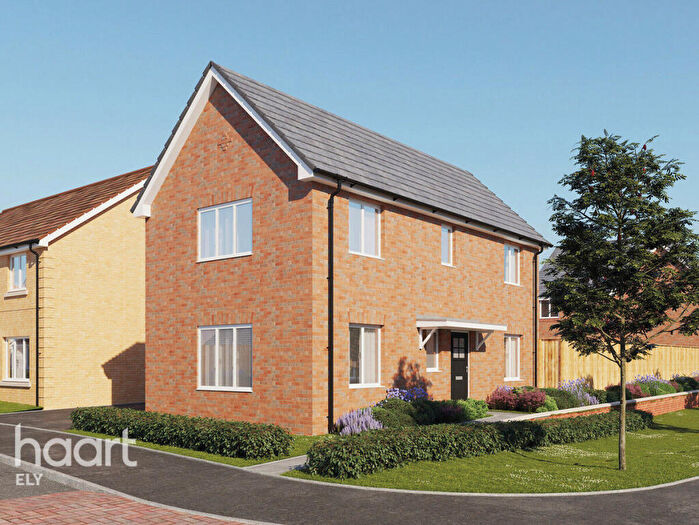
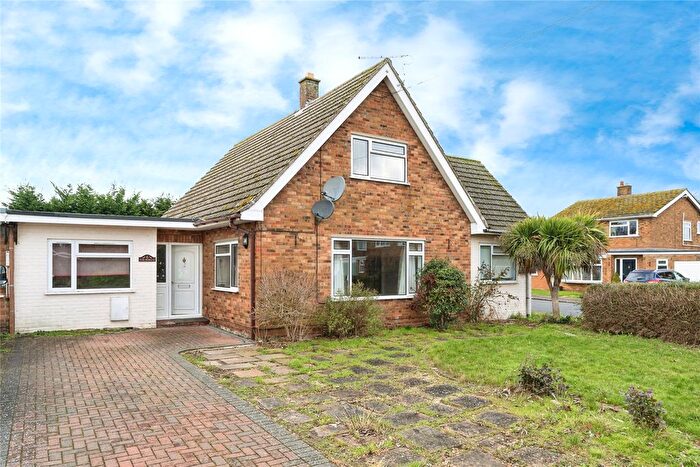
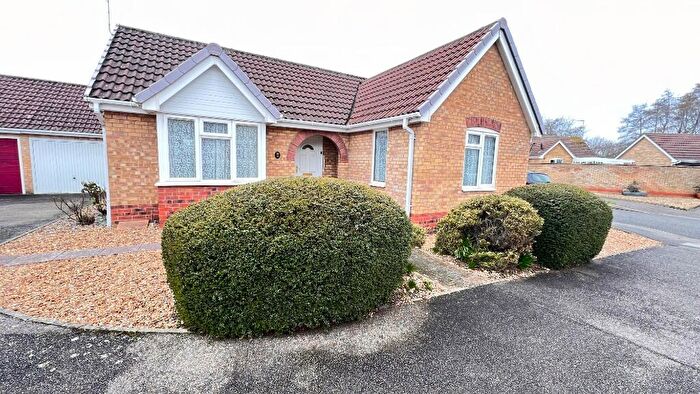
Properties in Wimblington have an average house price of £304,429.00 and had 85 Property Transactions within the last 3 years¹.
Wimblington is an area in March, Cambridgeshire with 892 households², where the most expensive property was sold for £717,500.00.
Properties for sale in Wimblington
Roads and Postcodes in Wimblington
Navigate through our locations to find the location of your next house in Wimblington, March for sale or to rent.
| Streets | Postcodes |
|---|---|
| Addison Road | PE15 0QT |
| Ash Tree Close | PE15 0RJ |
| Benwick Road | PE15 0UB |
| Blue Lane | PE15 0RQ |
| Bridge Lane | PE15 0RR PE15 0RS |
| Chapel Lane | PE15 0QX |
| Church Street | PE15 0QS |
| Coney Walk | PE15 0RH |
| Coneywood Road | PE15 0SH |
| Dobson Walk | PE15 0PN |
| Doddington Road | PE15 0RA PE15 0RB PE15 0RD |
| Dolby Close | PE15 0NS |
| Eastwood End | PE15 0QJ PE15 0QQ |
| Eaton Estate | PE15 0QE |
| Fenland Close | PE15 0RF |
| Fullers Lane | PE15 0QR |
| Governess Close | PE15 0QY |
| Greenwood Way | PE15 0NY |
| Honeymead Road | PE15 0NT |
| Hook Road | PE15 0QL |
| King Street | PE15 0QF |
| Manea Road | PE15 0PA PE15 0PD PE15 0PE |
| March Road | PE15 0RN PE15 0RW |
| Meadow Way | PE15 0QP |
| Meadow Way South | PE15 0QZ |
| Morley Way | PE15 0NR |
| Morton Way | PE15 0PQ |
| Norfolk Street | PE15 0QA |
| Old Bakery Close | PE15 0NA |
| Orchard Way | PE15 0QG |
| Parkfield Lane | PE15 0RE |
| Pond Close | PE15 0RL |
| Ray Court | PE15 0FE |
| Rhonda Park | PE15 0QD |
| Rose Cottage Gardens | PE15 0PP |
| Sixteen Foot Bank | PE15 0DU PE15 0DX PE15 0DY PE15 0DZ |
| St Peters Drive | PE15 0QU |
| The Paddocks | PE15 0RX |
| Tudor Place | PE15 0PX |
| Waggoners Way | PE15 0NQ |
| Walnut Tree Walk | PE15 0RT |
| Webb Gardens | PE15 0GS |
| Wimblington Road | PE15 0JR |
| Woodysfield | PE15 0PW |
| PE15 0FD |
Transport near Wimblington
- FAQ
- Price Paid By Year
- Property Type Price
Frequently asked questions about Wimblington
What is the average price for a property for sale in Wimblington?
The average price for a property for sale in Wimblington is £304,429. This amount is 20% higher than the average price in March. There are 1,948 property listings for sale in Wimblington.
What streets have the most expensive properties for sale in Wimblington?
The streets with the most expensive properties for sale in Wimblington are Addison Road at an average of £690,000, Walnut Tree Walk at an average of £458,500 and Bridge Lane at an average of £455,000.
What streets have the most affordable properties for sale in Wimblington?
The streets with the most affordable properties for sale in Wimblington are Fenland Close at an average of £170,000, Ash Tree Close at an average of £183,333 and Orchard Way at an average of £190,000.
Which train stations are available in or near Wimblington?
Some of the train stations available in or near Wimblington are March, Manea and Whittlesea.
Property Price Paid in Wimblington by Year
The average sold property price by year was:
| Year | Average Sold Price | Price Change |
Sold Properties
|
|---|---|---|---|
| 2025 | £276,310 | -4% |
29 Properties |
| 2024 | £287,314 | -29% |
35 Properties |
| 2023 | £371,785 | 20% |
21 Properties |
| 2022 | £296,770 | -11% |
37 Properties |
| 2021 | £328,007 | 19% |
58 Properties |
| 2020 | £266,135 | 2% |
50 Properties |
| 2019 | £260,900 | -1% |
25 Properties |
| 2018 | £263,444 | 9% |
36 Properties |
| 2017 | £238,756 | 7% |
42 Properties |
| 2016 | £223,108 | 12% |
41 Properties |
| 2015 | £195,880 | -4% |
56 Properties |
| 2014 | £204,317 | -1% |
47 Properties |
| 2013 | £206,938 | 20% |
34 Properties |
| 2012 | £164,777 | -6% |
41 Properties |
| 2011 | £174,487 | -10% |
55 Properties |
| 2010 | £191,680 | 18% |
33 Properties |
| 2009 | £158,064 | -37% |
30 Properties |
| 2008 | £217,144 | 13% |
34 Properties |
| 2007 | £188,876 | 6% |
57 Properties |
| 2006 | £177,889 | 1% |
66 Properties |
| 2005 | £175,707 | 3% |
45 Properties |
| 2004 | £170,098 | 11% |
62 Properties |
| 2003 | £150,693 | 17% |
145 Properties |
| 2002 | £125,169 | 10% |
88 Properties |
| 2001 | £112,642 | 29% |
43 Properties |
| 2000 | £80,472 | 7% |
42 Properties |
| 1999 | £74,910 | 18% |
37 Properties |
| 1998 | £61,103 | 8% |
53 Properties |
| 1997 | £55,995 | -0,4% |
49 Properties |
| 1996 | £56,217 | 0,4% |
29 Properties |
| 1995 | £55,985 | - |
28 Properties |
Property Price per Property Type in Wimblington
Here you can find historic sold price data in order to help with your property search.
The average Property Paid Price for specific property types in the last three years are:
| Property Type | Average Sold Price | Sold Properties |
|---|---|---|
| Semi Detached House | £211,769.00 | 26 Semi Detached Houses |
| Detached House | £368,489.00 | 48 Detached Houses |
| Terraced House | £243,909.00 | 11 Terraced Houses |

