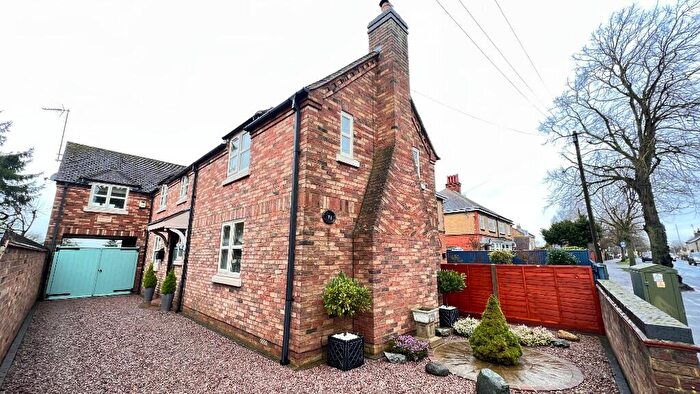
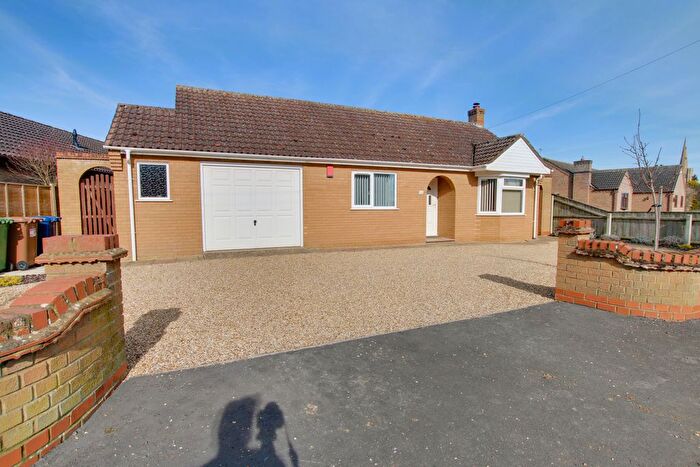
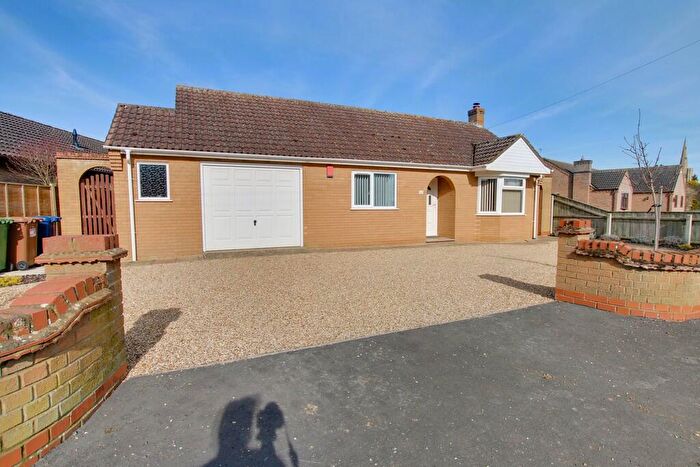
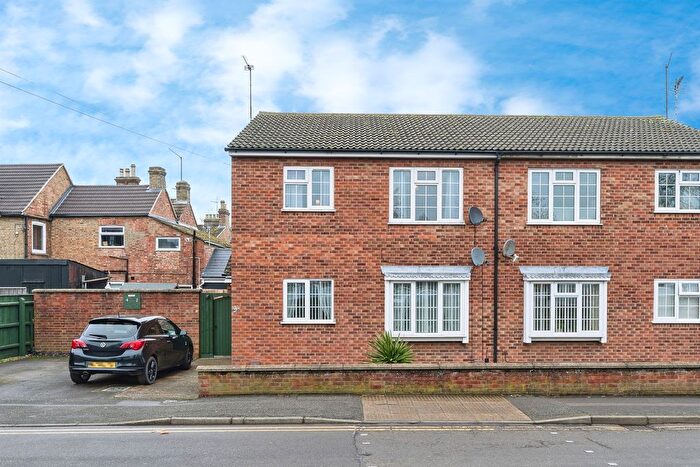
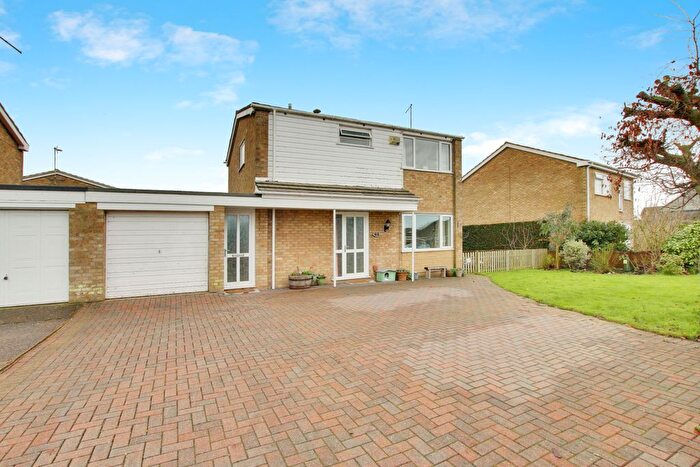
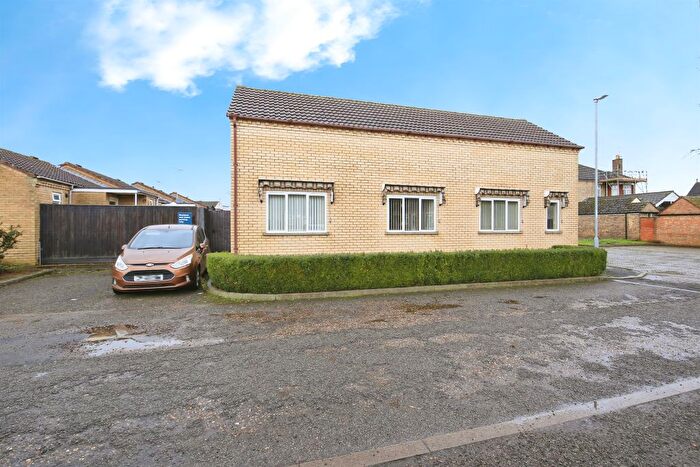
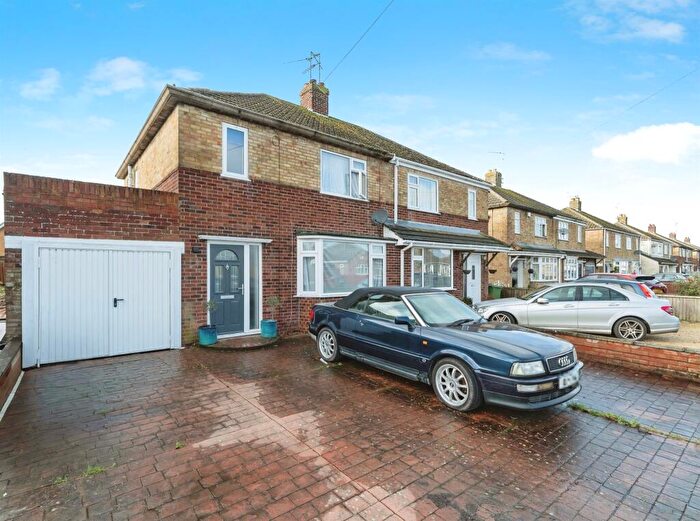
Houses for sale & to rent in March, Cambridgeshire
House Prices in March
Properties in March have an average house price of £254,461.00 and had 1,310 Property Transactions within the last 3 years.¹
March is an area in Cambridgeshire with 12,748 households², where the most expensive property was sold for £850,000.00.
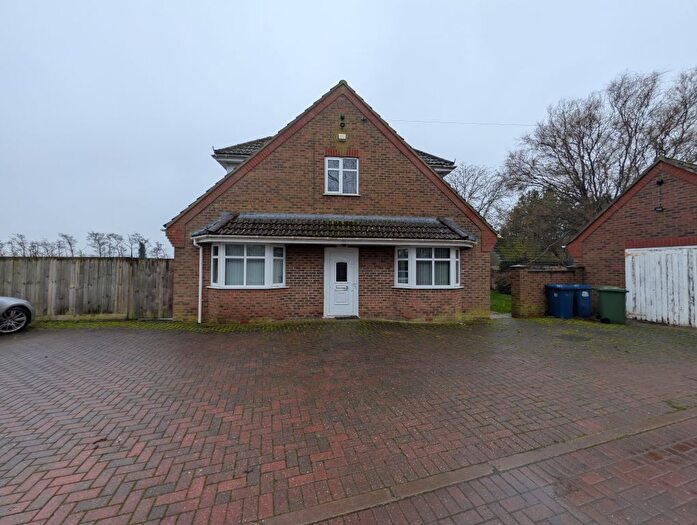
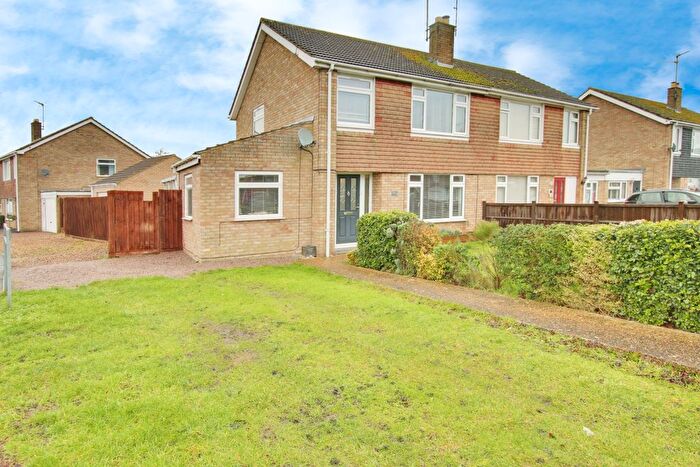
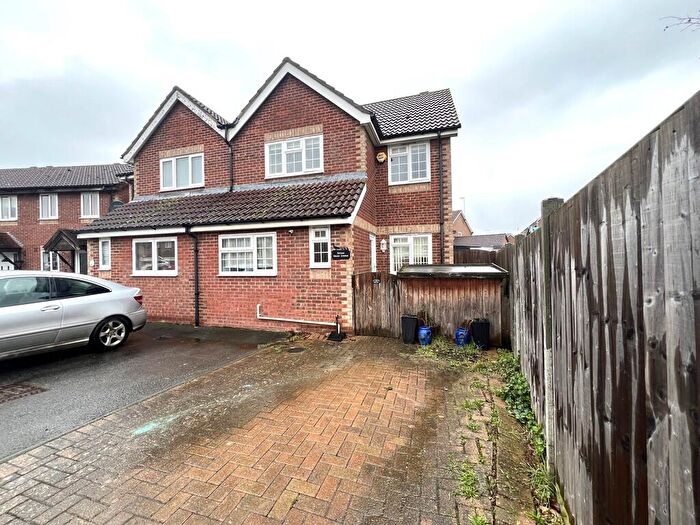
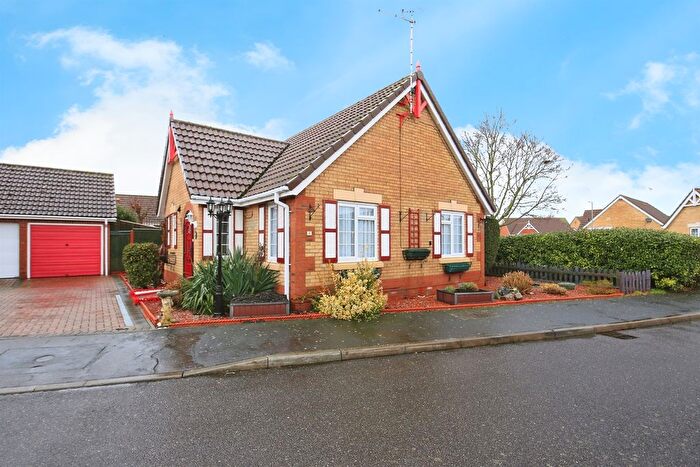
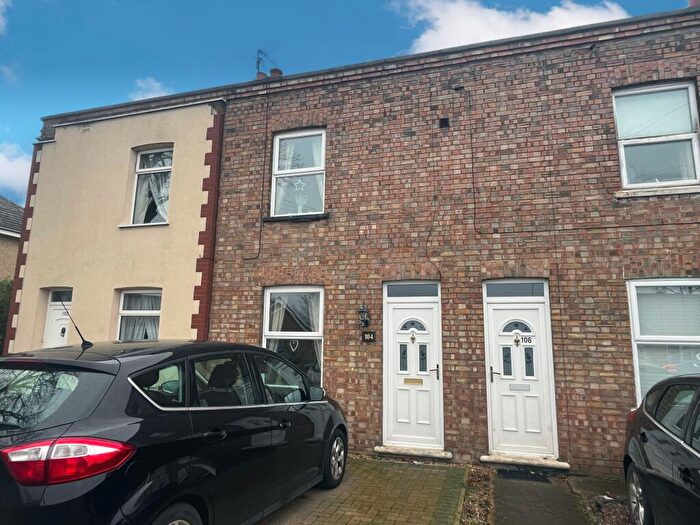
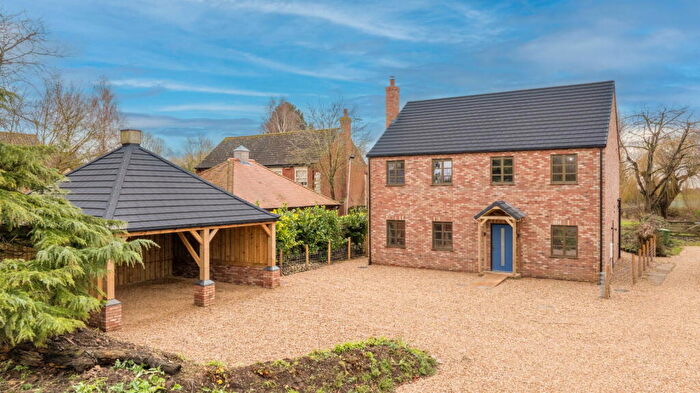
Properties for sale in March
Neighbourhoods in March
Navigate through our locations to find the location of your next house in March, Cambridgeshire for sale or to rent.
Transport in March
Please see below transportation links in this area:
- FAQ
- Price Paid By Year
- Property Type Price
Frequently asked questions about March
What is the average price for a property for sale in March?
The average price for a property for sale in March is £254,461. This amount is 35% lower than the average price in Cambridgeshire. There are 9,429 property listings for sale in March.
What locations have the most expensive properties for sale in March?
The locations with the most expensive properties for sale in March are Elm & Christchurch at an average of £580,000, Doddington & Wimblington at an average of £397,380 and Wimblington at an average of £304,429.
What locations have the most affordable properties for sale in March?
The locations with the most affordable properties for sale in March are March East at an average of £218,897, March North at an average of £232,499 and Benwick, Coates And Eastrea at an average of £253,329.
Which train stations are available in or near March?
Some of the train stations available in or near March are March, Manea and Whittlesea.
Property Price Paid in March by Year
The average sold property price by year was:
| Year | Average Sold Price | Price Change |
Sold Properties
|
|---|---|---|---|
| 2025 | £247,740 | -4% |
390 Properties |
| 2024 | £257,104 | -0,2% |
481 Properties |
| 2023 | £257,537 | 1% |
439 Properties |
| 2022 | £256,210 | 4% |
603 Properties |
| 2021 | £246,041 | 5% |
824 Properties |
| 2020 | £234,705 | 8% |
561 Properties |
| 2019 | £216,837 | 3% |
555 Properties |
| 2018 | £211,273 | 6% |
591 Properties |
| 2017 | £197,775 | 7% |
628 Properties |
| 2016 | £184,448 | 7% |
659 Properties |
| 2015 | £170,909 | 4% |
647 Properties |
| 2014 | £163,539 | 9% |
634 Properties |
| 2013 | £148,944 | 3% |
523 Properties |
| 2012 | £144,339 | -5% |
424 Properties |
| 2011 | £151,759 | 3% |
387 Properties |
| 2010 | £146,762 | 4% |
358 Properties |
| 2009 | £140,295 | -10% |
429 Properties |
| 2008 | £154,346 | -1% |
425 Properties |
| 2007 | £156,071 | 3% |
878 Properties |
| 2006 | £152,142 | 7% |
956 Properties |
| 2005 | £141,549 | 4% |
664 Properties |
| 2004 | £135,305 | 6% |
869 Properties |
| 2003 | £127,415 | 19% |
939 Properties |
| 2002 | £102,784 | 24% |
1,064 Properties |
| 2001 | £78,426 | 13% |
803 Properties |
| 2000 | £68,304 | 16% |
825 Properties |
| 1999 | £57,518 | 5% |
849 Properties |
| 1998 | £54,929 | 6% |
731 Properties |
| 1997 | £51,419 | 13% |
703 Properties |
| 1996 | £44,845 | - |
526 Properties |
| 1995 | £44,853 | - |
476 Properties |
Property Price per Property Type in March
Here you can find historic sold price data in order to help with your property search.
The average Property Paid Price for specific property types in the last three years are:
| Property Type | Average Sold Price | Sold Properties |
|---|---|---|
| Semi Detached House | £225,892.00 | 320 Semi Detached Houses |
| Detached House | £309,631.00 | 664 Detached Houses |
| Terraced House | £179,821.00 | 282 Terraced Houses |
| Flat | £108,050.00 | 44 Flats |

