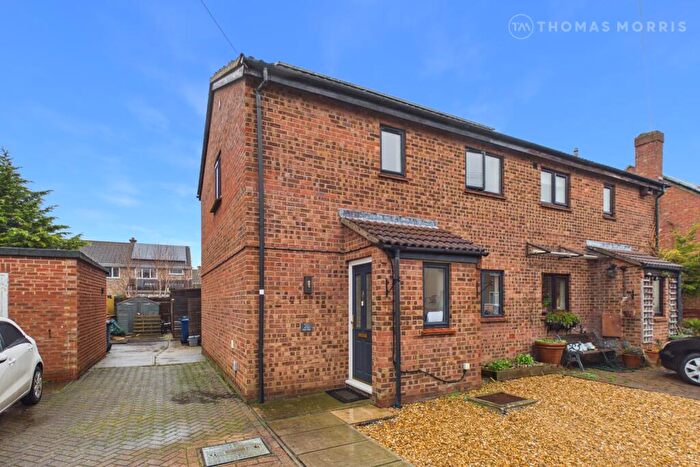
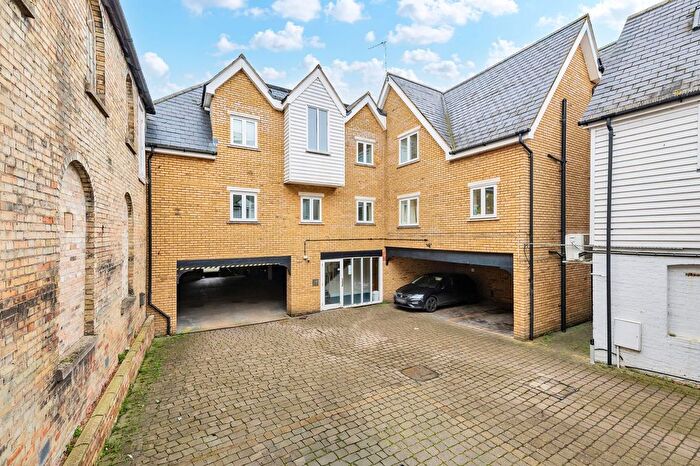
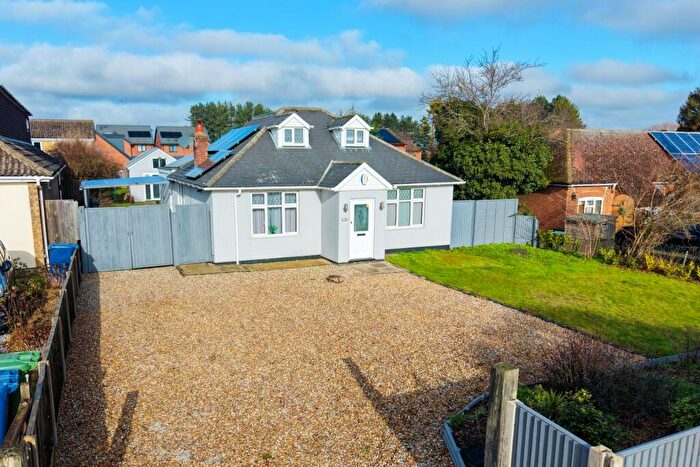
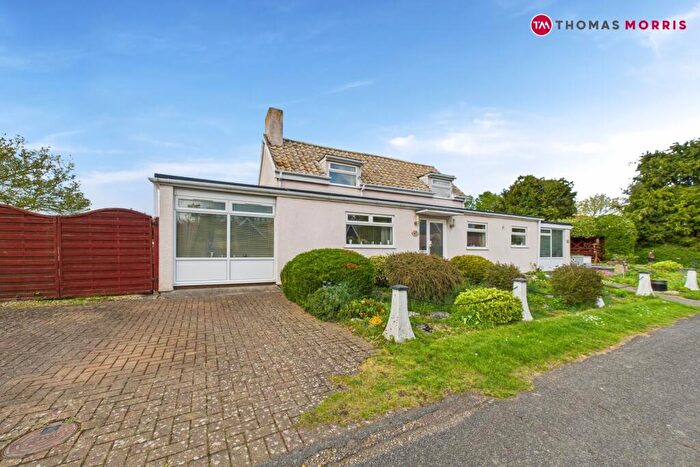
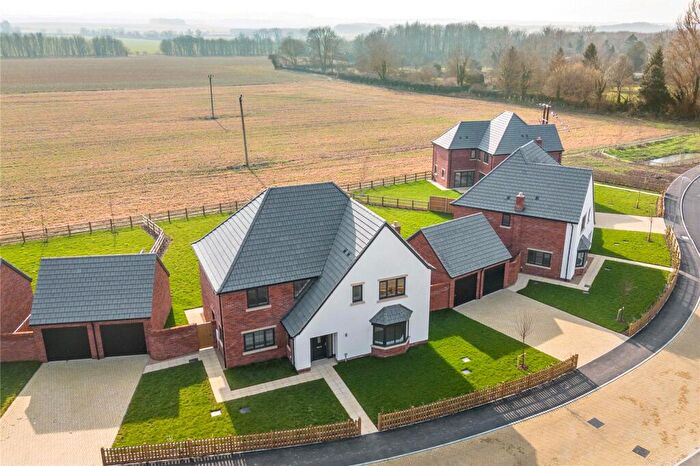
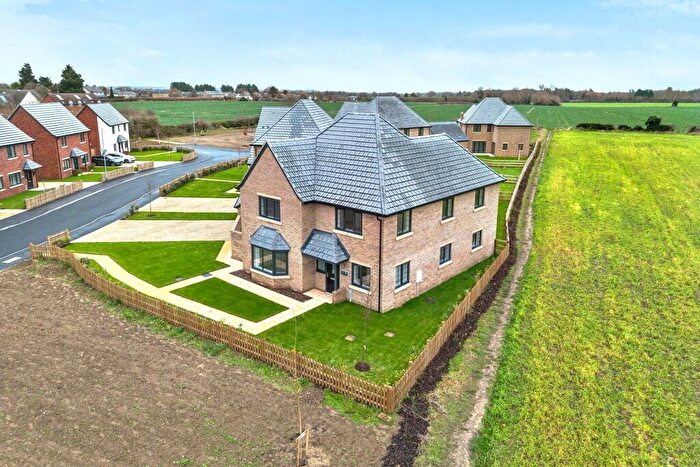
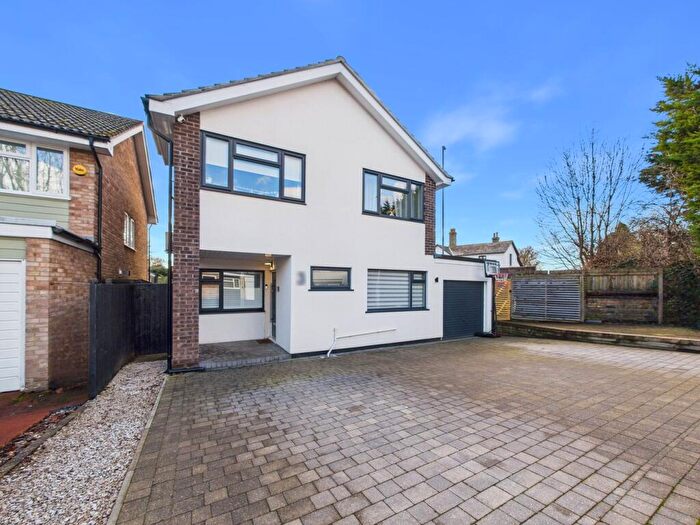
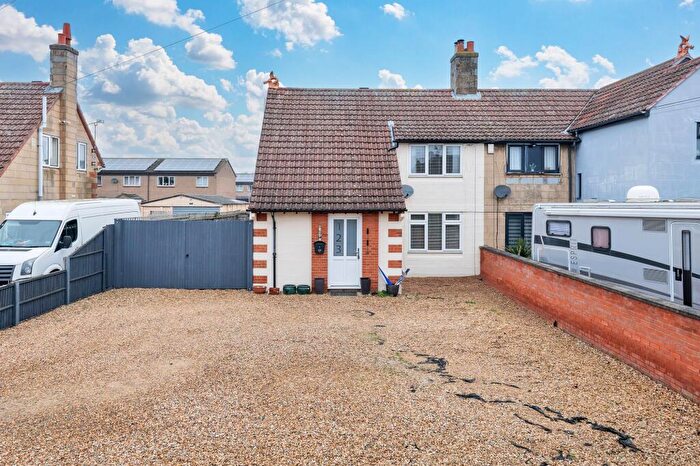
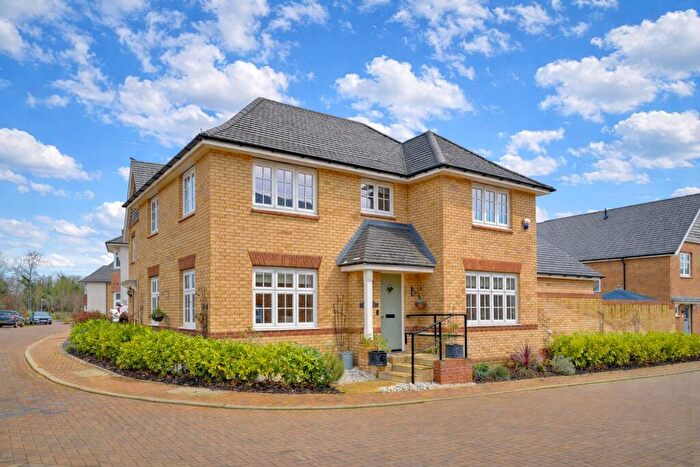
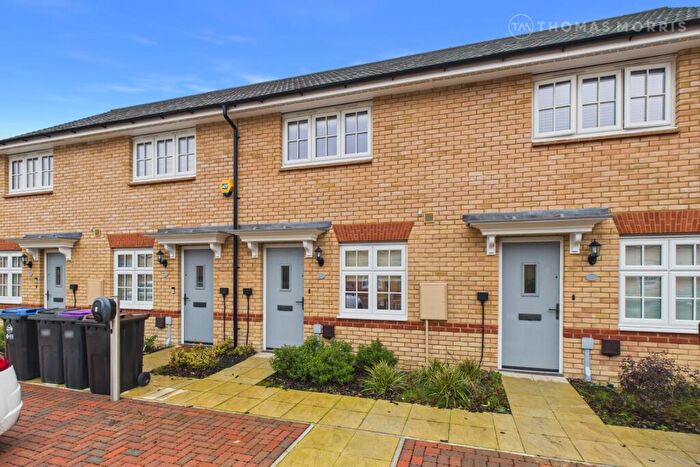
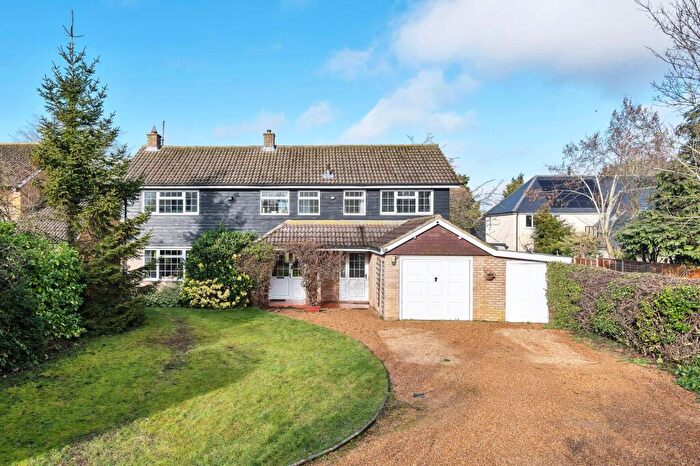
Houses for sale & to rent in Bassingbourn, Royston
House Prices in Bassingbourn
Properties in Bassingbourn have an average house price of £463,722.00 and had 123 Property Transactions within the last 3 years¹.
Bassingbourn is an area in Royston, Cambridgeshire with 1,868 households², where the most expensive property was sold for £1,400,000.00.
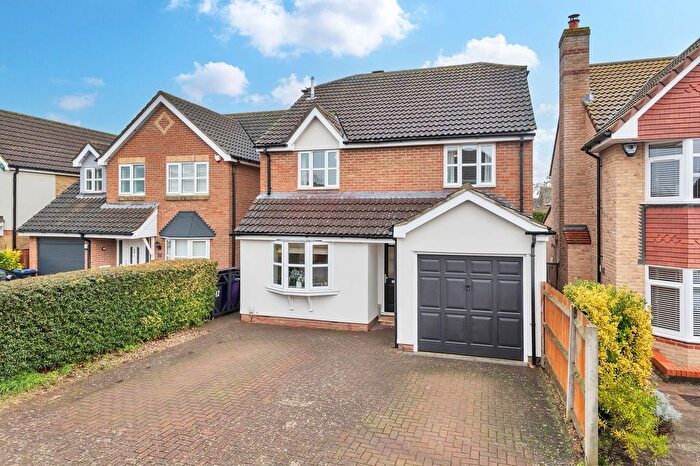
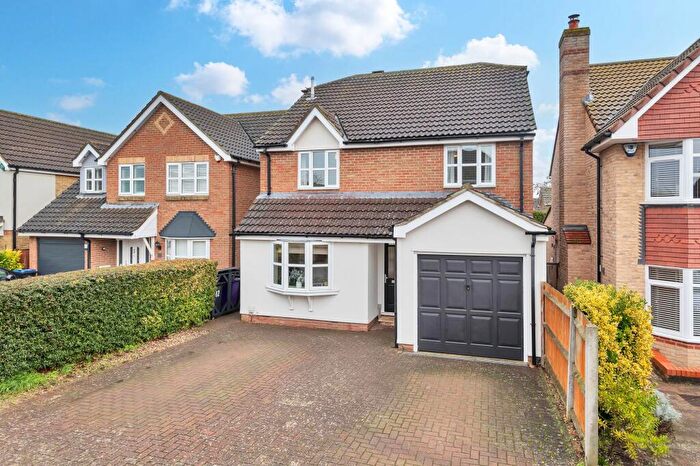
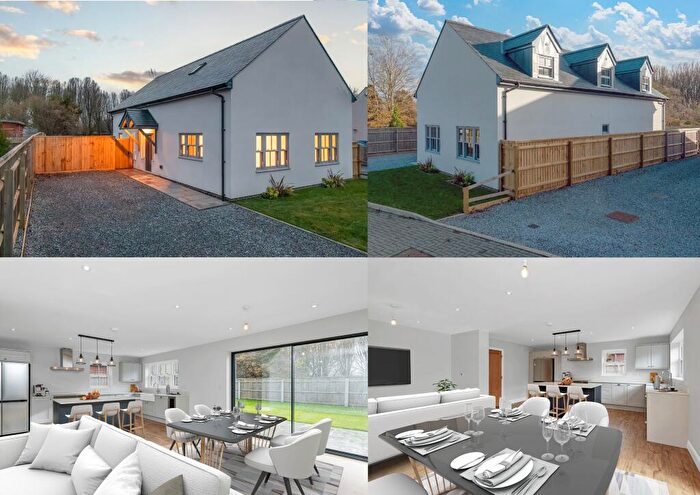
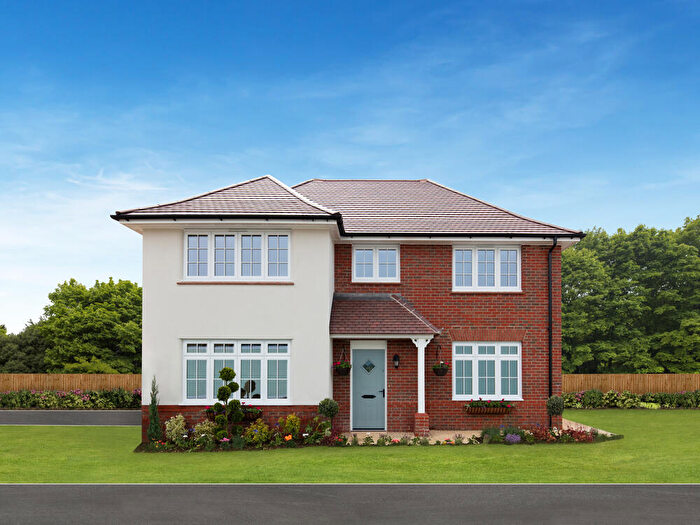
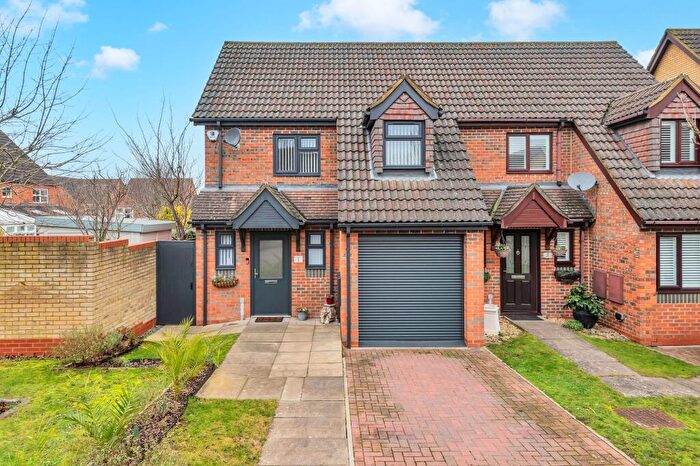
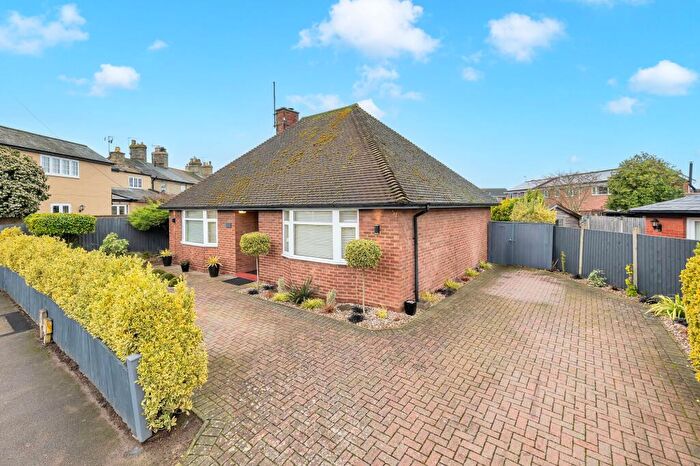
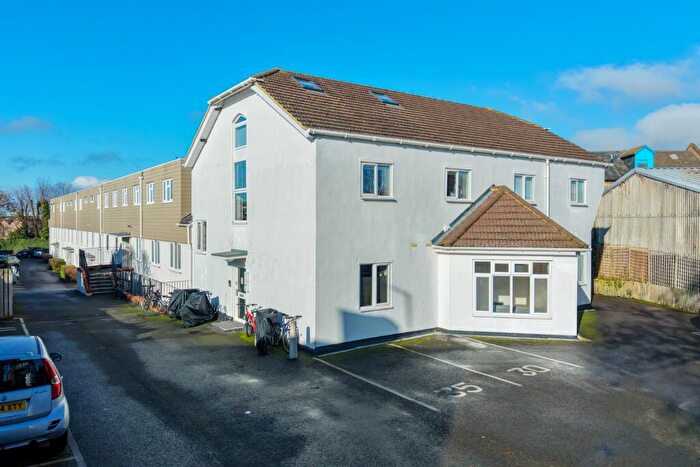
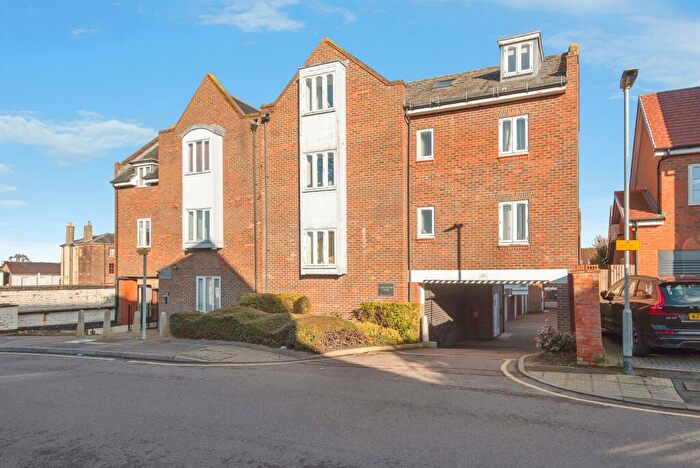
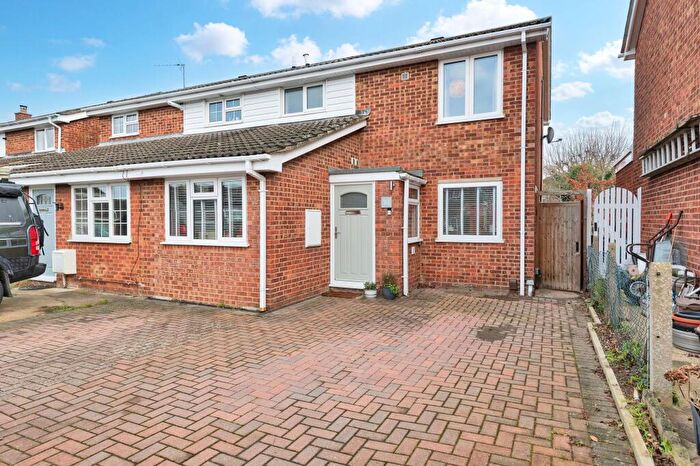
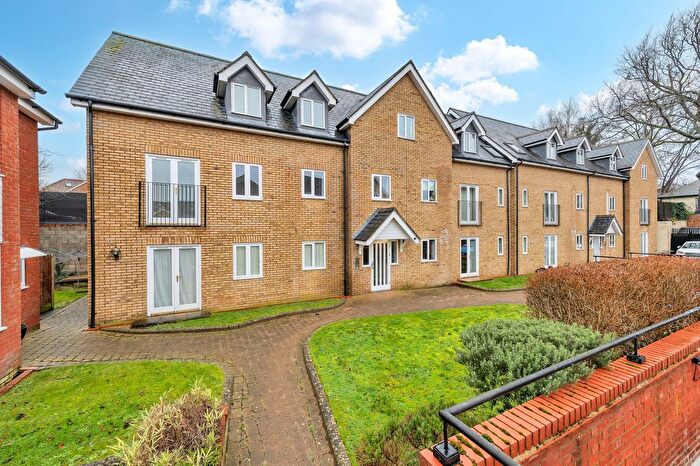
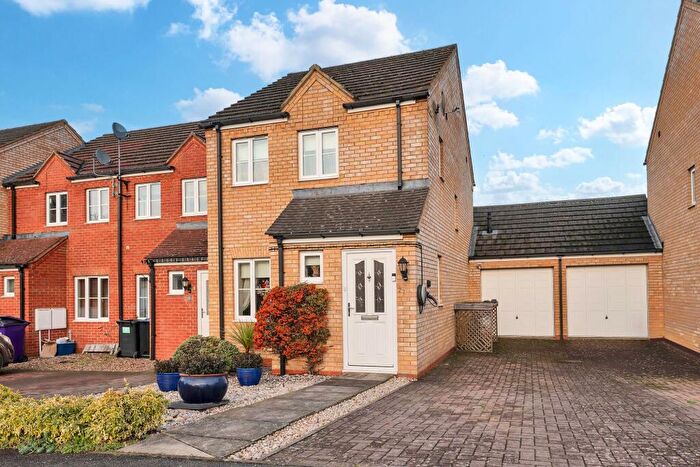
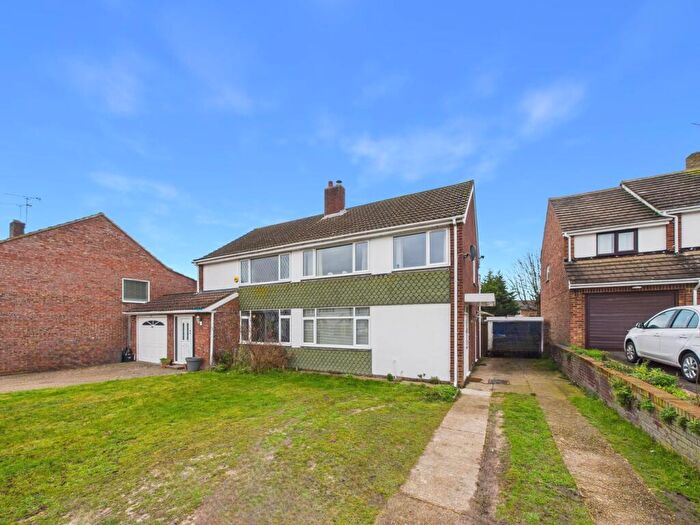
Properties for sale in Bassingbourn
Roads and Postcodes in Bassingbourn
Navigate through our locations to find the location of your next house in Bassingbourn, Royston for sale or to rent.
| Streets | Postcodes |
|---|---|
| Abbotts Close | SG8 0QQ |
| Abington Road | SG8 0RT SG8 0QZ SG8 0RU |
| Anvil Avenue | SG8 0RA |
| Appletree Row | SG8 5GZ |
| Ashwell Street | SG8 0RP |
| Bassingbourn Road | SG8 0QN SG8 0SS |
| Bridge Street | SG8 5SG SG8 5SN SG8 5SP SG8 5SQ |
| Brook Road | SG8 5NP SG8 5NR SG8 5NS SG8 5NT |
| Burrs Lane | SG8 0QH |
| Butterfield Drive | SG8 5FL |
| Cambridge Crescent | SG8 5LP |
| Canberra Close | SG8 5JF |
| Cardiff Place | SG8 5LR |
| Chapel Close | SG8 0QJ |
| Cherry Tree Close | SG8 0RQ |
| Chestnut Lane | SG8 5JH SG8 5JJ |
| Church Close | SG8 5NW |
| Church Street | SG8 0QB SG8 0RD SG8 5RX SG8 5RY SG8 0QA |
| Clarkes Way | SG8 5LT |
| Cockhall Close | SG8 0RB |
| Cockhall Lane | SG8 0RE |
| Edinburgh Square | SG8 5LH SG8 5LJ |
| Elbourn Way | SG8 5UJ |
| Elm Tree Drive | SG8 5LS SG8 5LU |
| Fen Road | SG8 5PG SG8 5PQ |
| Fortune Way | SG8 5YR |
| Garden Place | SG8 5NU |
| Guise Lane | SG8 5PJ |
| High Street | SG8 5LD SG8 5LE SG8 5LF SG8 5NE SG8 5NF |
| Kefford Close | SG8 5UL |
| Knutsford Road | SG8 5HR SG8 5HS |
| Limes Close | SG8 5XP |
| Litlington Road | SG8 9NJ |
| Malting Lane | SG8 0QT SG8 0QU |
| Meeting Lane | SG8 0QF |
| Meldreth Road | SG8 5RP SG8 5RS |
| Middle Street | SG8 0QX |
| Mill Lane | SG8 5PP SG8 5PR |
| New Close | SG8 0QP |
| New Shingay | SG8 0HP |
| Nightingale Avenue | SG8 5JE |
| Nightingale Close | SG8 5YH |
| North End | SG8 5NX SG8 5NY SG8 5NZ SG8 5PA SG8 5PD SG8 5PE |
| Old North Road | SG8 5JG SG8 5JL SG8 5JR SG8 5JS SG8 5SR SG8 5JP SG8 5JT SG8 5JU |
| Orchard Close | SG8 5JY |
| Oxford Close | SG8 5LL |
| Park Close | SG8 5PZ |
| Park View | SG8 5PS |
| Pepper Close | SG8 5HX |
| Playles Yard | SG8 5XW |
| Poplar Farm Close | SG8 5NA |
| Ridgeway Close | SG8 5SA |
| Robinson Gardens | SG8 5GY |
| Royston Road | SG8 0RG SG8 0RH SG8 0RJ SG8 0RL SG8 0RR SG8 0RS |
| Saddleback Lane | SG8 5NQ |
| Saggers Close | SG8 5PL |
| Shedbury Lane | SG8 5PH |
| Silver Street | SG8 0QE |
| South End | SG8 5NG SG8 5NJ SG8 5NL |
| South Street | SG8 0QR SG8 0QS |
| Spring Lane | SG8 5HT SG8 5HY SG8 5HZ SG8 5HU |
| St Catherines Court | SG8 0QL |
| Swinnell Close | SG8 5JN |
| The Causeway | SG8 5JB SG8 5JD SG8 5LG SG8 5LQ SG8 5JA |
| The Fillance | SG8 5PN |
| The Limes | SG8 5ND |
| The Mount | SG8 0QG |
| The Tanyard | SG8 5NH |
| Tower Close | SG8 5JX |
| Town Farm Close | SG8 5RT |
| Tudor Court | SG8 5LA |
| Walnut Tree Close | SG8 5PB |
| Wellington Place | SG8 5JQ |
| Willmott Road | SG8 5LW |
| Windmill Close | SG8 5FJ |
| Wortham Grove | SG8 5RJ |
| SG8 0HG SG8 0HH SG8 0HJ SG8 0HL SG8 0HN SG8 5LX SG8 5RE |
Transport near Bassingbourn
- FAQ
- Price Paid By Year
- Property Type Price
Frequently asked questions about Bassingbourn
What is the average price for a property for sale in Bassingbourn?
The average price for a property for sale in Bassingbourn is £463,722. This amount is 10% lower than the average price in Royston. There are 2,516 property listings for sale in Bassingbourn.
What streets have the most expensive properties for sale in Bassingbourn?
The streets with the most expensive properties for sale in Bassingbourn are Meeting Lane at an average of £860,000, Spring Lane at an average of £658,750 and Mill Lane at an average of £628,000.
What streets have the most affordable properties for sale in Bassingbourn?
The streets with the most affordable properties for sale in Bassingbourn are Ridgeway Close at an average of £219,950, The Limes at an average of £225,000 and Knutsford Road at an average of £260,000.
Which train stations are available in or near Bassingbourn?
Some of the train stations available in or near Bassingbourn are Royston, Meldreth and Ashwell and Morden.
Property Price Paid in Bassingbourn by Year
The average sold property price by year was:
| Year | Average Sold Price | Price Change |
Sold Properties
|
|---|---|---|---|
| 2025 | £484,903 | 8% |
32 Properties |
| 2024 | £446,210 | -4% |
45 Properties |
| 2023 | £466,119 | 1% |
46 Properties |
| 2022 | £461,372 | -3% |
60 Properties |
| 2021 | £474,897 | 10% |
93 Properties |
| 2020 | £429,438 | -5% |
62 Properties |
| 2019 | £449,193 | 12% |
51 Properties |
| 2018 | £396,064 | 0,3% |
68 Properties |
| 2017 | £394,767 | 3% |
59 Properties |
| 2016 | £382,669 | 6% |
78 Properties |
| 2015 | £359,864 | 14% |
56 Properties |
| 2014 | £309,984 | 6% |
77 Properties |
| 2013 | £290,212 | 0,5% |
65 Properties |
| 2012 | £288,845 | -2% |
46 Properties |
| 2011 | £294,856 | 4% |
64 Properties |
| 2010 | £282,095 | 1% |
56 Properties |
| 2009 | £278,366 | 4% |
49 Properties |
| 2008 | £266,446 | -20% |
39 Properties |
| 2007 | £319,857 | 22% |
108 Properties |
| 2006 | £250,305 | 14% |
93 Properties |
| 2005 | £214,218 | -6% |
77 Properties |
| 2004 | £226,263 | -5% |
62 Properties |
| 2003 | £237,493 | 21% |
76 Properties |
| 2002 | £187,540 | 20% |
99 Properties |
| 2001 | £149,564 | -6% |
107 Properties |
| 2000 | £158,118 | 20% |
66 Properties |
| 1999 | £126,386 | 9% |
134 Properties |
| 1998 | £114,722 | -0,4% |
94 Properties |
| 1997 | £115,231 | 19% |
94 Properties |
| 1996 | £92,838 | 5% |
81 Properties |
| 1995 | £88,064 | - |
56 Properties |
Property Price per Property Type in Bassingbourn
Here you can find historic sold price data in order to help with your property search.
The average Property Paid Price for specific property types in the last three years are:
| Property Type | Average Sold Price | Sold Properties |
|---|---|---|
| Semi Detached House | £404,884.00 | 44 Semi Detached Houses |
| Detached House | £614,312.00 | 48 Detached Houses |
| Terraced House | £314,062.00 | 31 Terraced Houses |

