Houses for sale & to rent in The Mordens, Royston
House Prices in The Mordens
Properties in The Mordens have an average house price of £660,396.00 and had 77 Property Transactions within the last 3 years¹.
The Mordens is an area in Royston, Cambridgeshire with 964 households², where the most expensive property was sold for £2,750,000.00.
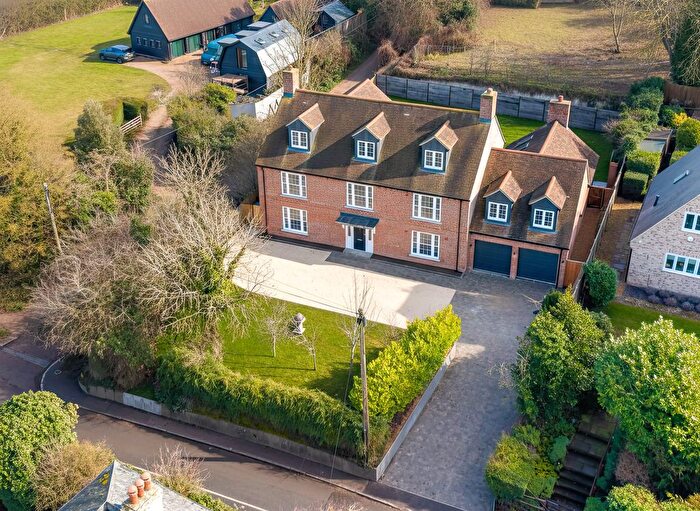
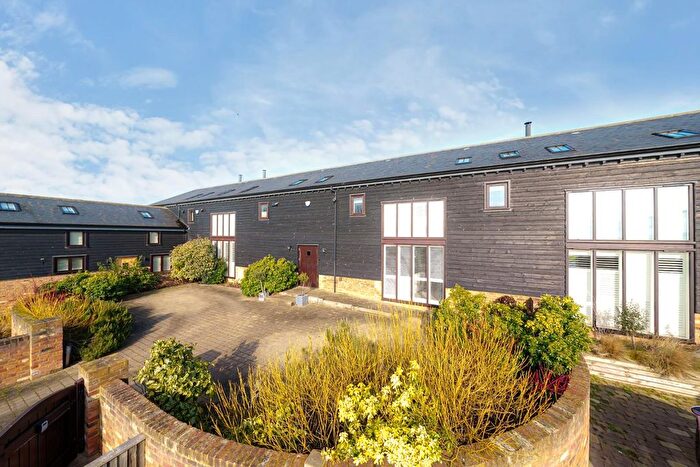
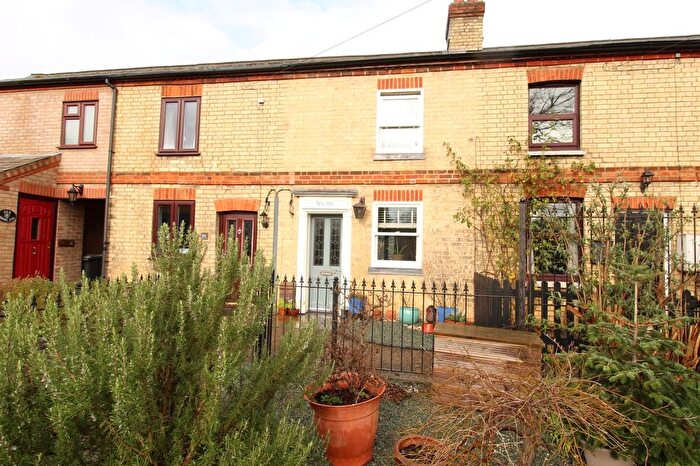
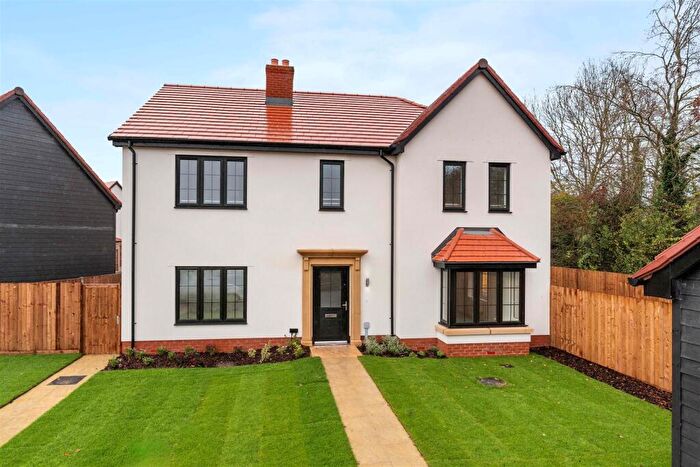
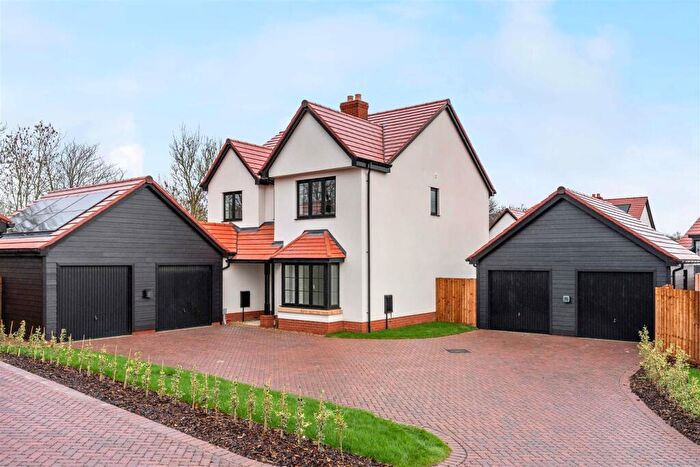
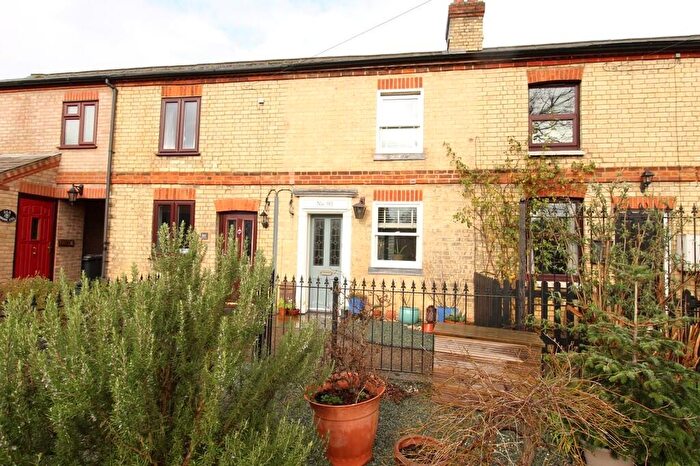
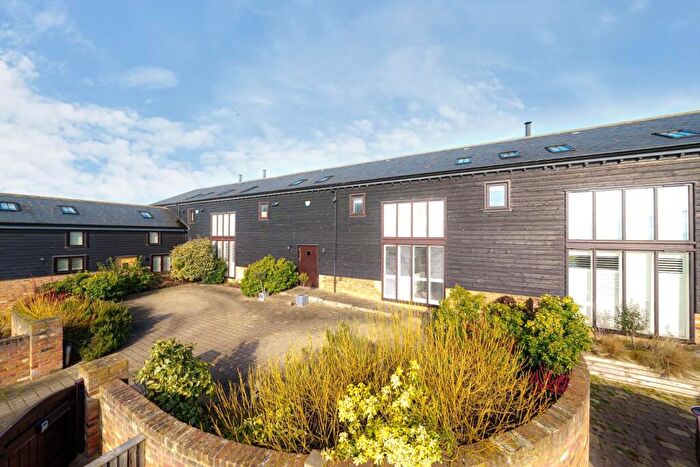
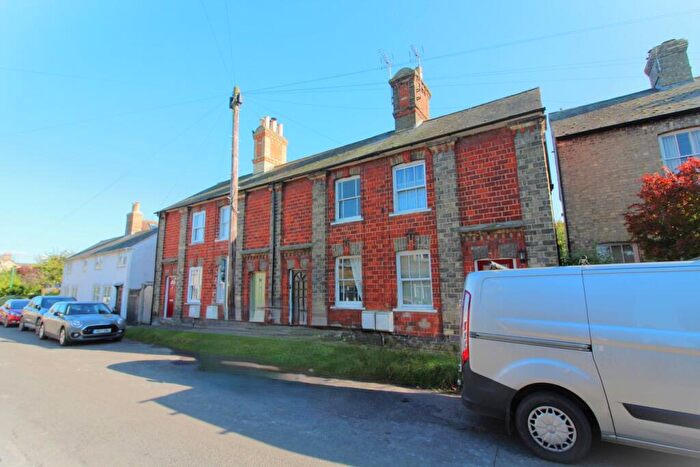
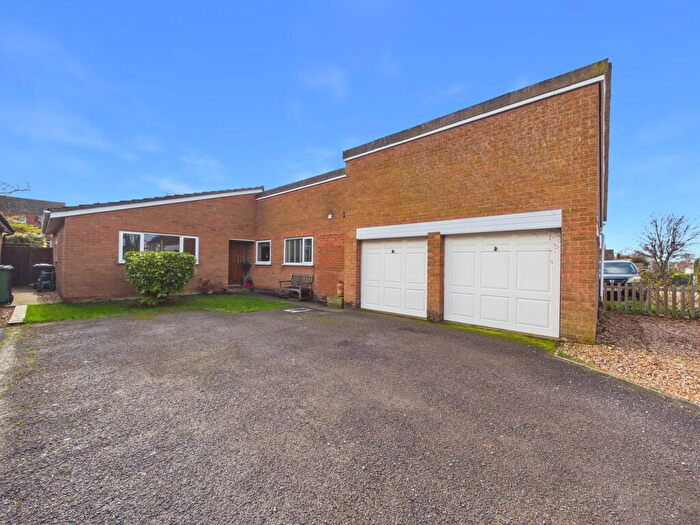
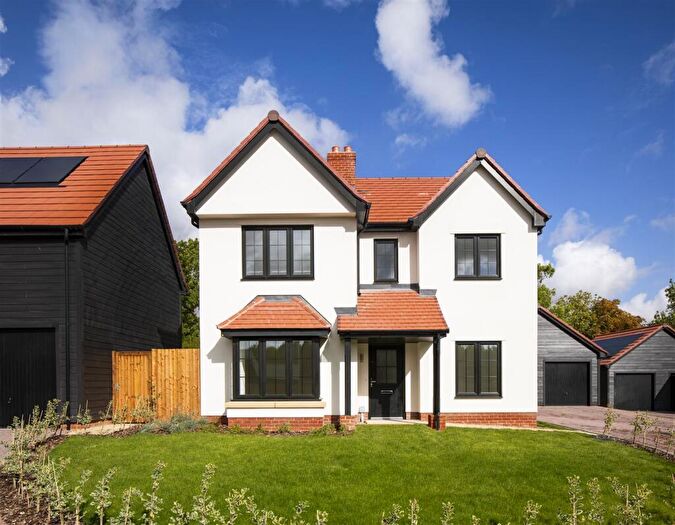
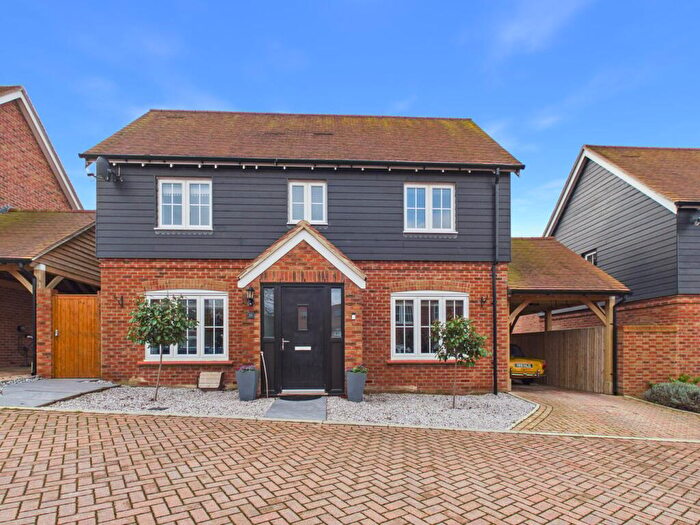
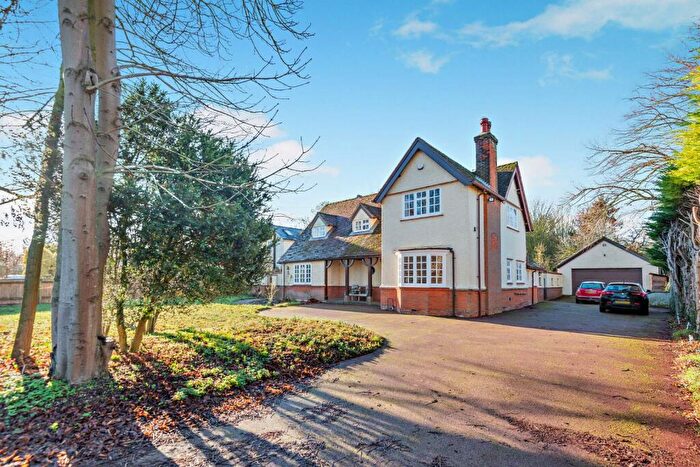
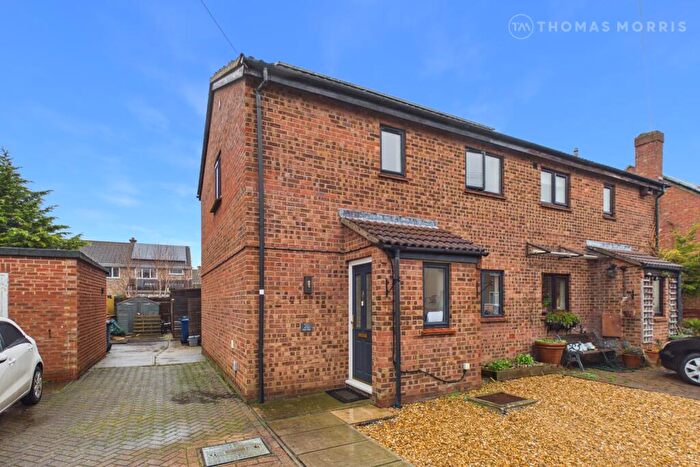
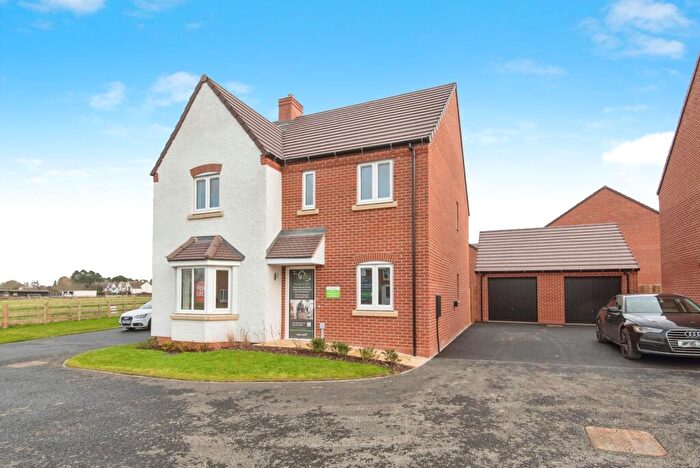
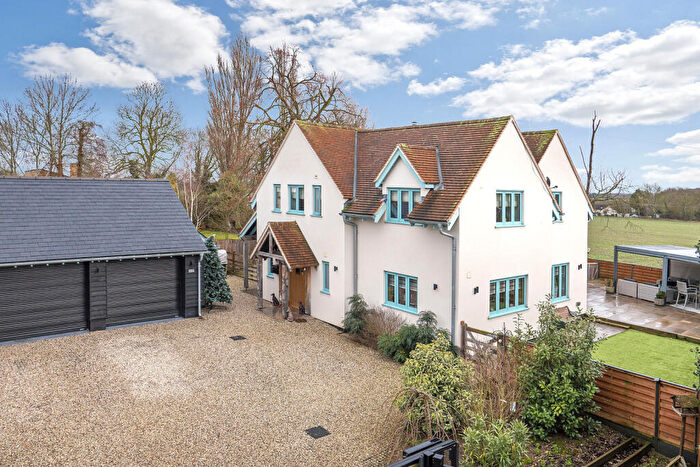
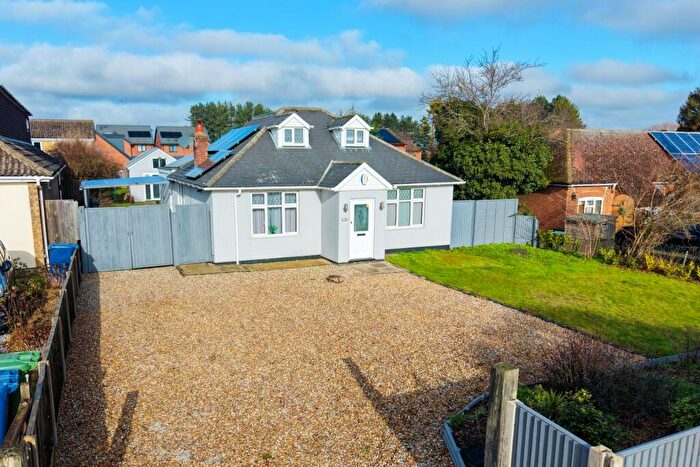
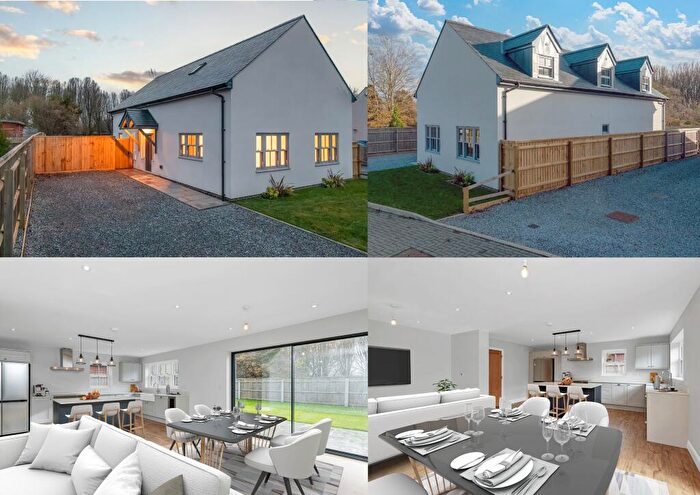
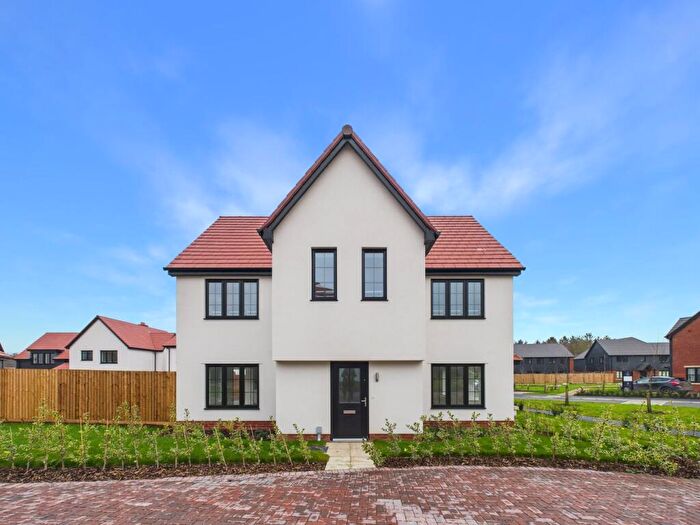
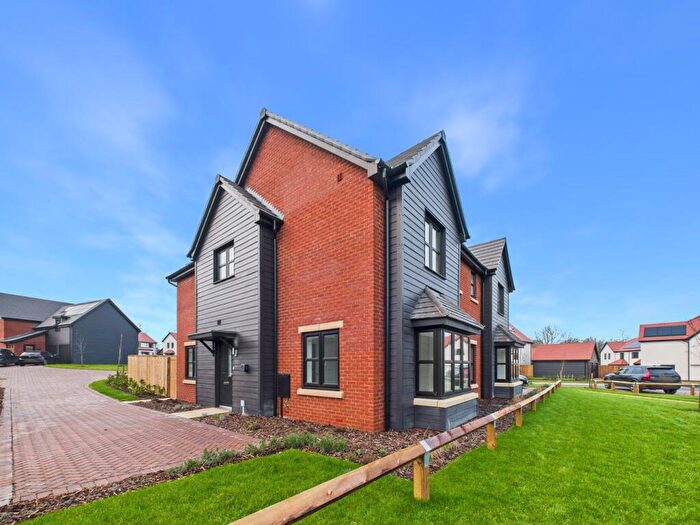
Properties for sale in The Mordens
Roads and Postcodes in The Mordens
Navigate through our locations to find the location of your next house in The Mordens, Royston for sale or to rent.
| Streets | Postcodes |
|---|---|
| Ashwell Road | SG8 0JX SG8 0JY SG8 0NZ SG8 0PB |
| Baldock Road | SG8 9NS SG8 9NR |
| Bells Meadow | SG8 0JB |
| Bogs Gap Lane | SG8 0PN SG8 0PW |
| Brook End | SG8 0PP SG8 0PR |
| Buxtons Lane | SG8 0JU |
| Cannons Close | SG8 0JL |
| Cheyney Close | SG8 0LT |
| Cheyney Street | SG8 0LP SG8 0LR SG8 0LS |
| Church Farm Lane | SG8 0NL |
| Church Lane | SG8 0LH SG8 0SG SG8 0SQ SG8 0SH |
| Church Street | SG8 0JD SG8 0NJ |
| Connors Close | SG8 0PT |
| Craft Way | SG8 0PF |
| Croydon Hill | SG8 0DZ SG8 0EA |
| Croydon Road | SG8 0BG |
| Dubbs Knoll Road | SG8 0LA |
| Ermine Way | SG8 0AA SG8 0AX |
| Flecks Drive | SG8 0BQ |
| Fox Corner | SG8 0JA |
| Fox Hill | SG8 0JJ |
| Fox Hill Road | SG8 0JF SG8 0JG SG8 0JH |
| Gatley End | SG8 0NT |
| Guilden Morden Road | SG8 0PJ |
| Hay Street | SG8 0PD SG8 0PE |
| High Road | SG8 0EP SG8 0BE |
| High Street | SG8 0ES SG8 0ET SG8 0EU SG8 0EX SG8 0JP SG8 0JR SG8 0JS SG8 0SN SG8 0EY |
| Jubilee End | SG8 0NG |
| Jubilee Way | SG8 0NF |
| Litlington Road | SG8 0LX SG8 0LY |
| Little Green | SG8 0LG |
| Lower Road | SG8 0EH SG8 0HA SG8 0HB SG8 0HD SG8 0HF SG8 0BF |
| Manor Farm Business Park | SG8 0HW |
| Mill Courtyard | SG8 0NH |
| New Road | SG8 0JN |
| North Brook End | SG8 0PG SG8 0PH |
| Plough Close | SG8 0UB |
| Potton Road | SG8 0LB SG8 0LE |
| Pound Green | SG8 0JZ |
| Russell Close | SG8 0NE |
| Russell End | SG8 0NQ |
| Shingay Road | SG8 0PL |
| Silver Street | SG8 0JT |
| Station Road | SG8 0NN SG8 0NP SG8 0NS SG8 0NU SG8 0NW SG8 0NX SG8 0NR SG8 0RN |
| Swan Lane | SG8 0JW |
| Swanns Close | SG8 0TP |
| Tadlow Gate | SG8 0ER |
| The Green | SG8 0NA SG8 0NB SG8 0ND |
| Thompsons Meadow | SG8 0UA |
| Town Farm Close | SG8 0PU |
| Trap Road | SG8 0JE |
| Westbrook Close | SG8 0NY |
| Windmill View | SG8 0BB |
| SG8 0EJ SG8 0EN SG8 0HT SG8 0SB SG8 0SD SG8 0SJ SG8 0EL SG8 0HR SG8 0HS SG8 0HU SG8 0SA SG8 0SL |
Transport near The Mordens
-
Ashwell and Morden Station
-
Royston Station
-
Meldreth Station
-
Biggleswade Station
-
Shepreth Station
-
Baldock Station
-
Arlesey Station
-
Sandy Station
-
Foxton Station
-
Letchworth Station
- FAQ
- Price Paid By Year
- Property Type Price
Frequently asked questions about The Mordens
What is the average price for a property for sale in The Mordens?
The average price for a property for sale in The Mordens is £660,396. This amount is 28% higher than the average price in Royston. There are 1,414 property listings for sale in The Mordens.
What streets have the most expensive properties for sale in The Mordens?
The streets with the most expensive properties for sale in The Mordens are Station Road at an average of £992,166, Dubbs Knoll Road at an average of £762,500 and Potton Road at an average of £742,500.
What streets have the most affordable properties for sale in The Mordens?
The streets with the most affordable properties for sale in The Mordens are Thompsons Meadow at an average of £212,500, Jubilee Way at an average of £327,500 and Church Lane at an average of £330,000.
Which train stations are available in or near The Mordens?
Some of the train stations available in or near The Mordens are Ashwell and Morden, Royston and Meldreth.
Property Price Paid in The Mordens by Year
The average sold property price by year was:
| Year | Average Sold Price | Price Change |
Sold Properties
|
|---|---|---|---|
| 2025 | £662,686 | 2% |
19 Properties |
| 2024 | £650,718 | -3% |
32 Properties |
| 2023 | £670,634 | -3% |
26 Properties |
| 2022 | £689,506 | 33% |
36 Properties |
| 2021 | £464,131 | -17% |
44 Properties |
| 2020 | £542,466 | -5% |
18 Properties |
| 2019 | £572,267 | 13% |
28 Properties |
| 2018 | £495,660 | -15% |
28 Properties |
| 2017 | £571,558 | 19% |
27 Properties |
| 2016 | £464,537 | 6% |
27 Properties |
| 2015 | £435,983 | 9% |
33 Properties |
| 2014 | £398,027 | 3% |
37 Properties |
| 2013 | £384,454 | 15% |
22 Properties |
| 2012 | £325,523 | -8% |
21 Properties |
| 2011 | £350,638 | -15% |
26 Properties |
| 2010 | £403,329 | 8% |
25 Properties |
| 2009 | £371,109 | 13% |
29 Properties |
| 2008 | £322,377 | -33% |
33 Properties |
| 2007 | £428,566 | 19% |
30 Properties |
| 2006 | £346,594 | 13% |
61 Properties |
| 2005 | £302,733 | -4% |
30 Properties |
| 2004 | £316,217 | 6% |
55 Properties |
| 2003 | £296,301 | 14% |
40 Properties |
| 2002 | £255,895 | 20% |
41 Properties |
| 2001 | £203,863 | -3% |
32 Properties |
| 2000 | £210,617 | 13% |
28 Properties |
| 1999 | £183,837 | -5% |
55 Properties |
| 1998 | £192,759 | 31% |
25 Properties |
| 1997 | £133,940 | 7% |
56 Properties |
| 1996 | £124,033 | -0,2% |
31 Properties |
| 1995 | £124,303 | - |
27 Properties |
Property Price per Property Type in The Mordens
Here you can find historic sold price data in order to help with your property search.
The average Property Paid Price for specific property types in the last three years are:
| Property Type | Average Sold Price | Sold Properties |
|---|---|---|
| Semi Detached House | £484,196.00 | 17 Semi Detached Houses |
| Detached House | £802,812.00 | 48 Detached Houses |
| Terraced House | £365,211.00 | 8 Terraced Houses |
| Flat | £290,625.00 | 4 Flats |

