
Houses for sale in Mobberley, Altrincham
House Prices in Mobberley
Properties in Mobberley have an average house price of £795k and had 5 Property Transactions within the last 3 years¹.
Mobberley is an area in Altrincham, Cheshire with 137 households², where the most expensive property was sold for £1.09M.
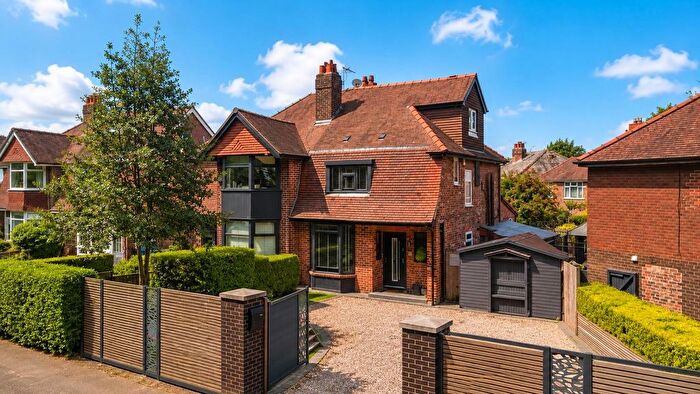
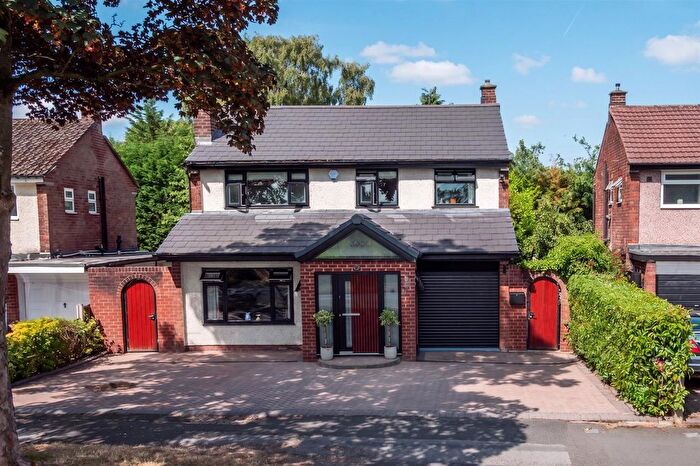
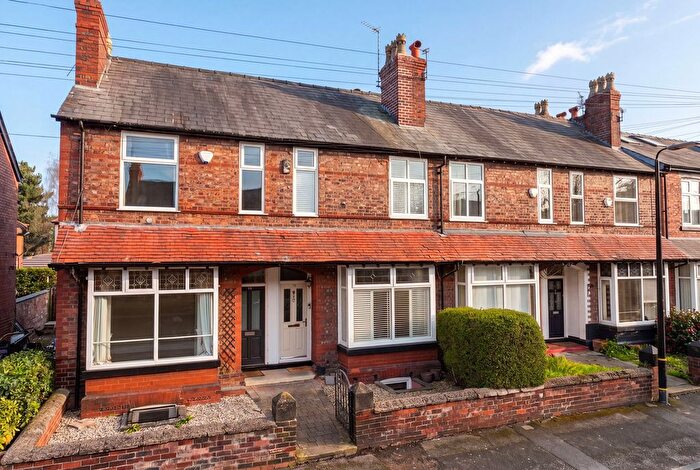
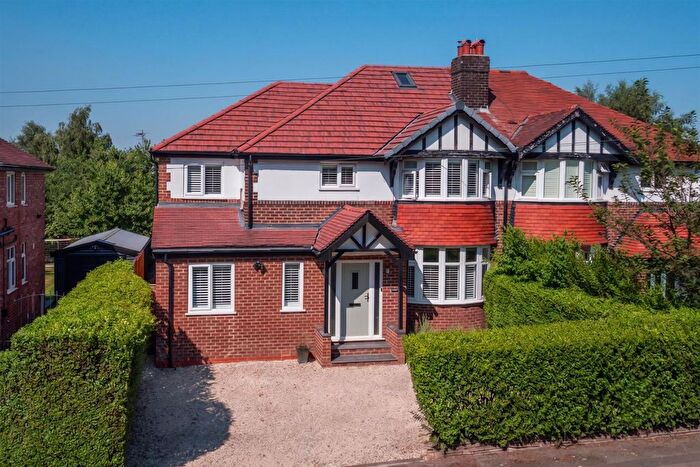
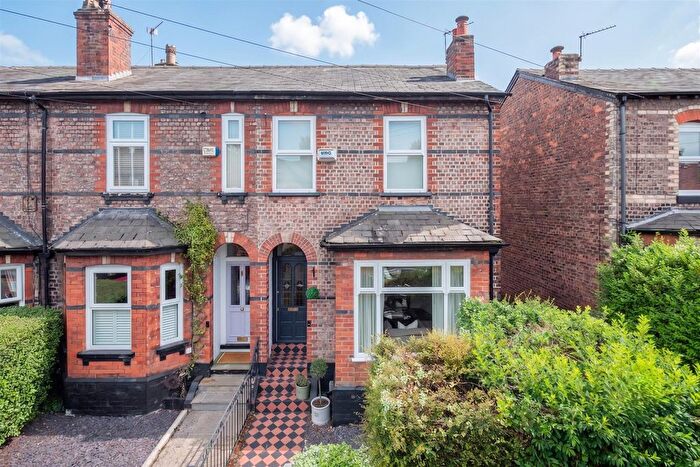
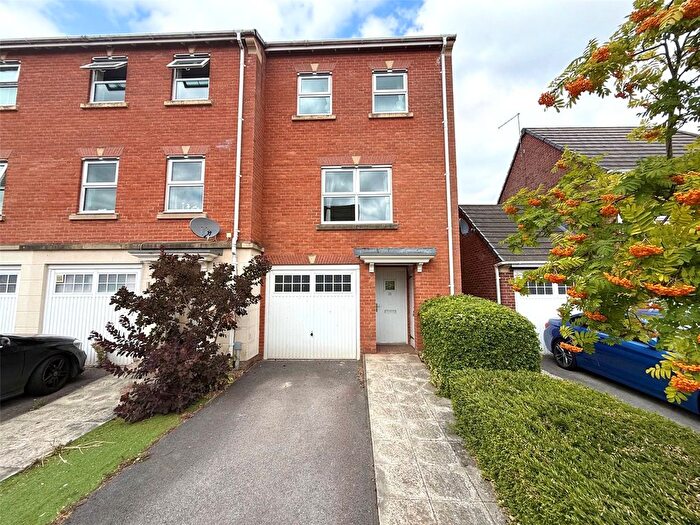
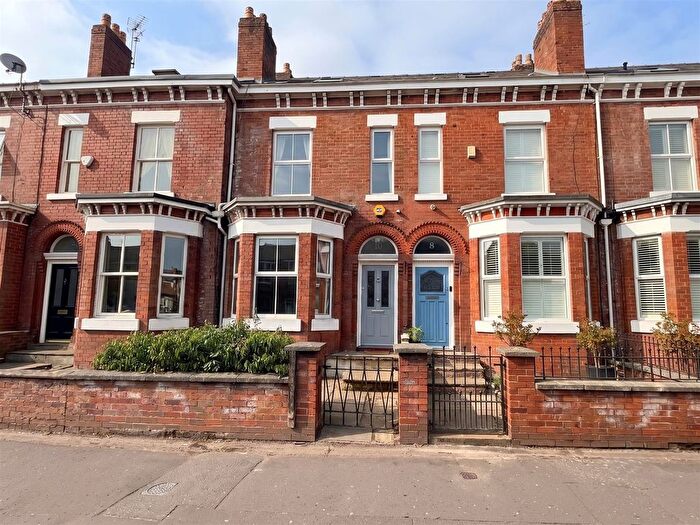
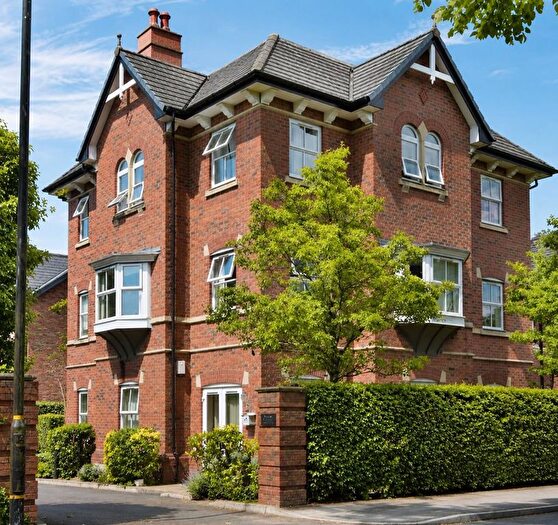
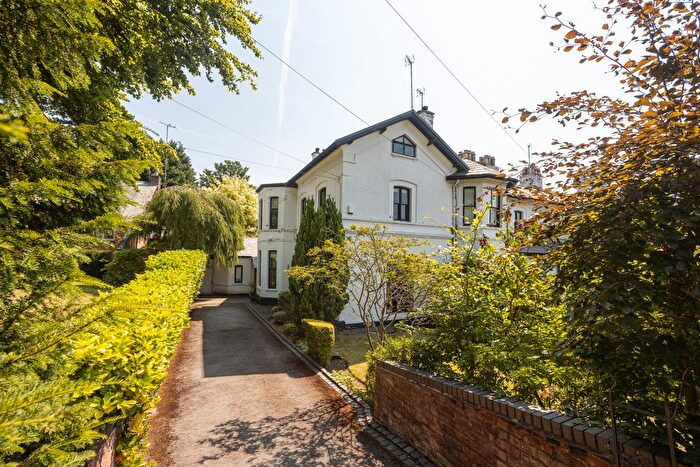
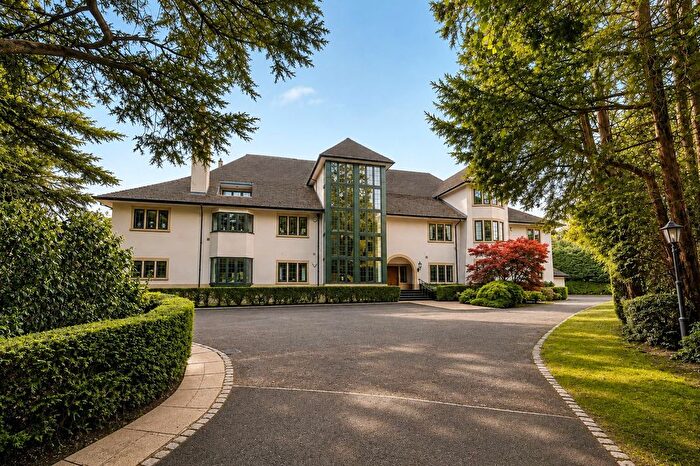
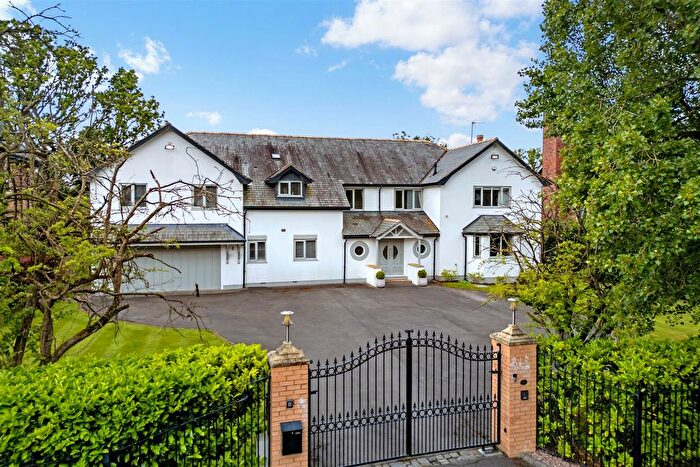
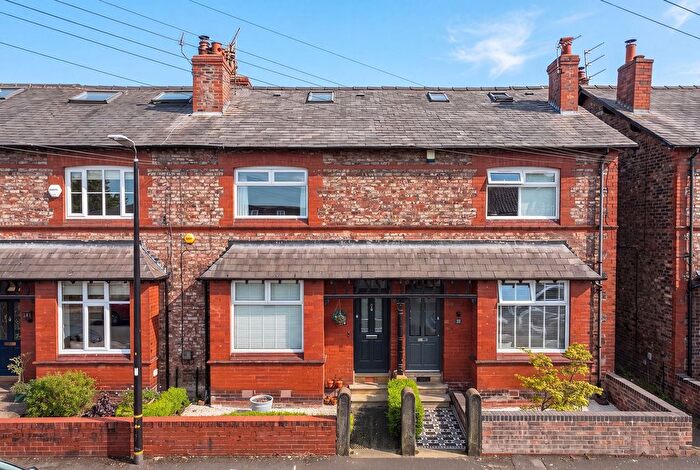
Properties for sale in Mobberley
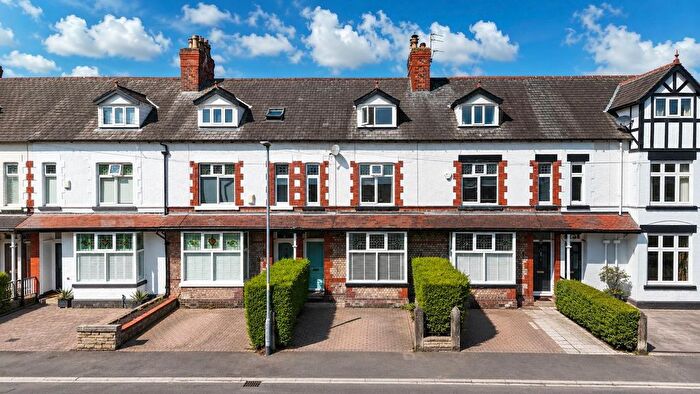
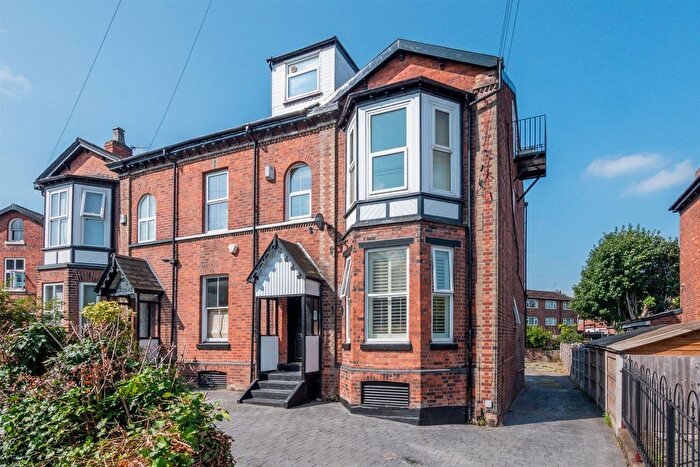
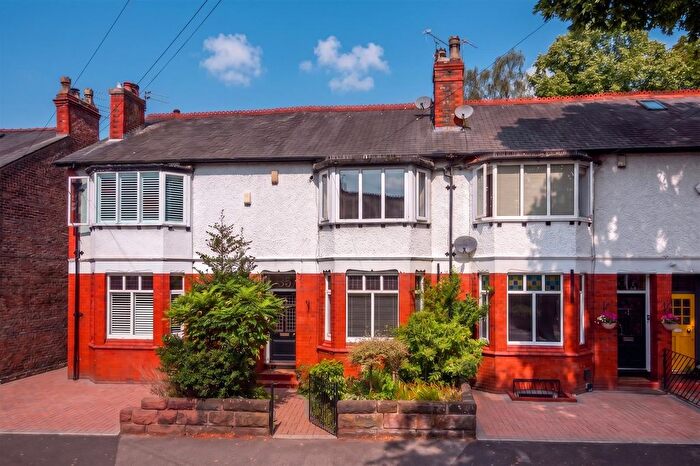
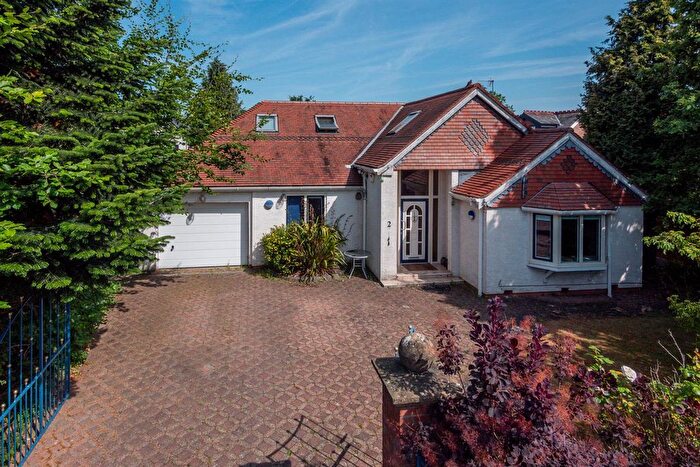
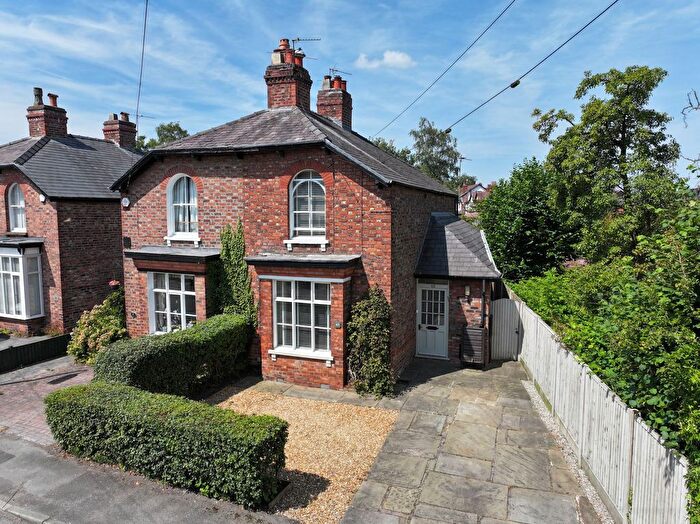
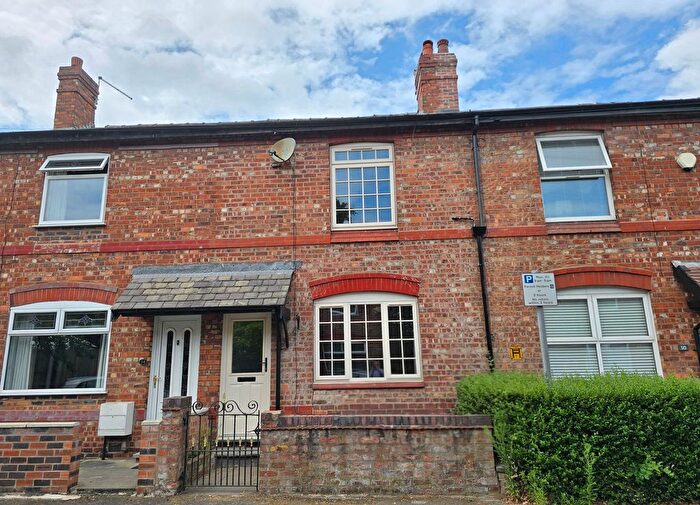
![]()
If you are looking to sell your house, let it out, or receive a property valuation, an expert can help you.
Click the button below to get started.
Roads and Postcodes in Mobberley
Navigate through our locations to find the location of your next house in Mobberley, Altrincham for sale or to rent.
| Streets | Postcodes |
|---|---|
| Ashley Mill Lane | WA14 3PX WA14 3PU WA14 3PY |
| Ashley Road | WA14 3QA WA14 3PT WA14 3PZ WA14 3QD WA14 3QE WA14 3QF WA14 3QH WA14 3QN WA14 3QQ WA15 0QG WA15 0QP |
| Back Lane | WA15 0QH WA15 0QJ WA15 0QX |
| Birkinheath Lane | WA14 3QL |
| Brickhill Lane | WA15 0QF |
| Castle Mill Lane | WA15 0QT WA15 0QU WA15 0QY WA15 0QZ WA15 0RA |
| Cherry Tree Lane | WA14 3QW WA14 3RZ WA14 3SA |
| Cow Lane | WA15 0QQ WA15 0QR |
| Egerton Moss | WA15 0QE |
| Hough Green | WA15 0QS |
| Lamb Lane | WA14 3QG |
| Mill Lane | WA15 0RD |
| Mobberley Road | WA15 0QW WA14 3QB WA14 3SF WA15 0QL WA15 0QN |
| Yarwoodheath Lane | WA14 3SB |
Property price trends in Mobberley
According to the latest Land Registry data, the average home in Mobberley sold for £778,725 in 2025. That figure comes from 88 sales logged over the past 29 years.
Prices have fallen back over the last three years. Compared with 2022, when the typical sale came in around £997,500, that's a fall of roughly 21.9%.
Looking back five years, average prices are down about 4.1% since 2020, a drop of around £33,275 in cash terms.
Zoom out to the past decade for the fuller picture. Back in 2015, homes here averaged £633,000, so the typical sold price has climbed about 23% since then, roughly 2.1% a year. Stretch the view to fifteen years and that annual pace holds at about 2%.
Frequently asked questions about Mobberley
What is the average price for a property for sale in Mobberley?
The average price for a property for sale in Mobberley is £794,990. This amount is 12% higher than the average price in Altrincham. There are 2,606 property listings for sale in Mobberley.
What streets have the most expensive properties for sale in Mobberley?
The street with the most expensive properties for sale in Mobberley is Cow Lane at an average of £957,500.
What streets have the most affordable properties for sale in Mobberley?
The street with the most affordable properties for sale in Mobberley is Castle Mill Lane at an average of £672,483.
Which train stations are available in or near Mobberley?
Some of the train stations available in or near Mobberley are Ashley, Hale and Mobberley.
Property Price Paid in Mobberley by Year
The average sold property price by year was:
| Year | Average Sold Price | Price Change |
Sold Properties
|
|---|---|---|---|
| 2025 | £778,725 | -3% |
2 Properties |
| 2023 | £805,833 | -24% |
3 Properties |
| 2022 | £997,500 | 48% |
2 Properties |
| 2021 | £521,862 | -56% |
4 Properties |
| 2020 | £812,000 | -1% |
3 Properties |
| 2019 | £822,500 | 12% |
4 Properties |
| 2018 | £720,000 | 30% |
2 Properties |
| 2017 | £506,250 | 26% |
4 Properties |
| 2016 | £375,000 | -69% |
1 Property |
| 2015 | £633,000 | 13% |
1 Property |
Property Price per Property Type in Mobberley
Here you can find historic sold price data in order to help with your property search.
The average Property Paid Price for specific property types in the last three years are:
| Property Type | Average Sold Price | Sold Properties |
|---|---|---|
| Semi Detached House | £462,475.00 | 2 Semi Detached Houses |
| Terraced House | £957,500.00 | 1 Terraced House |
| Detached House | £1,046,250.00 | 2 Detached Houses |
