
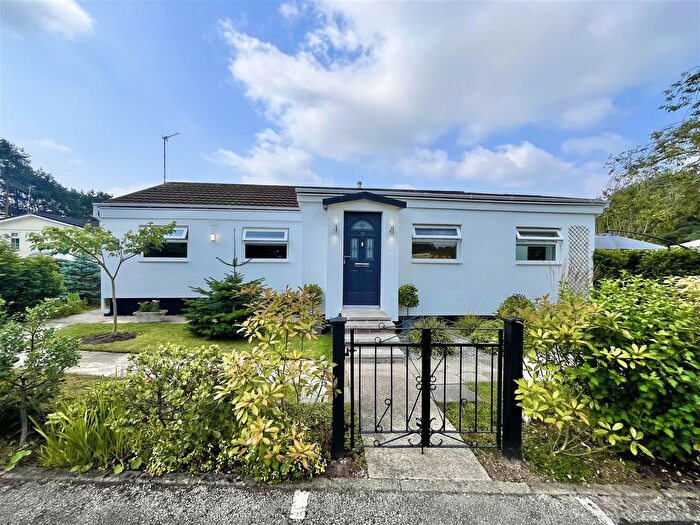
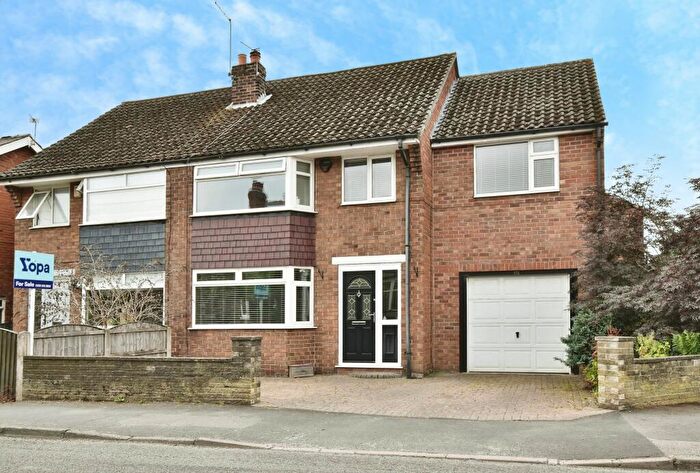
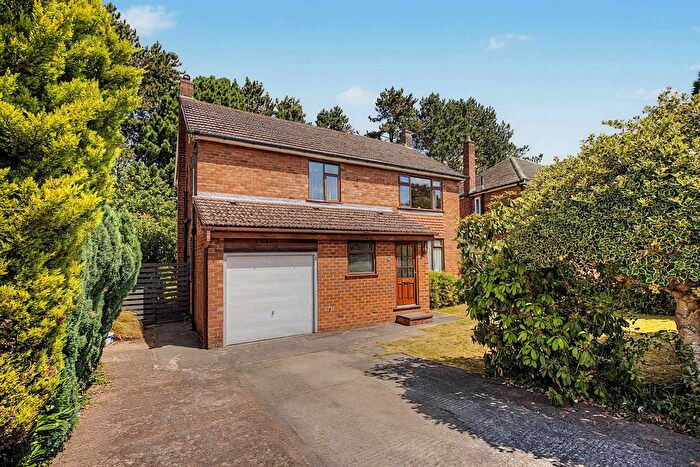
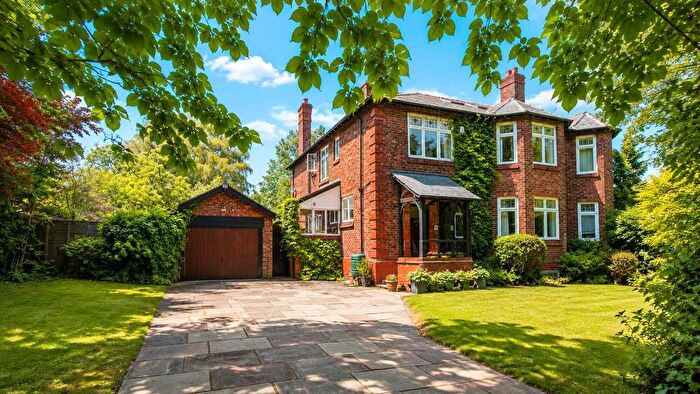
Houses for sale in Mobberley, Knutsford
House Prices in Mobberley
Properties in Mobberley have an average house price of £544k and had 150 Property Transactions within the last 3 years¹.
Mobberley is an area in Knutsford, Cheshire with 1,515 households², where the most expensive property was sold for £2.5M.
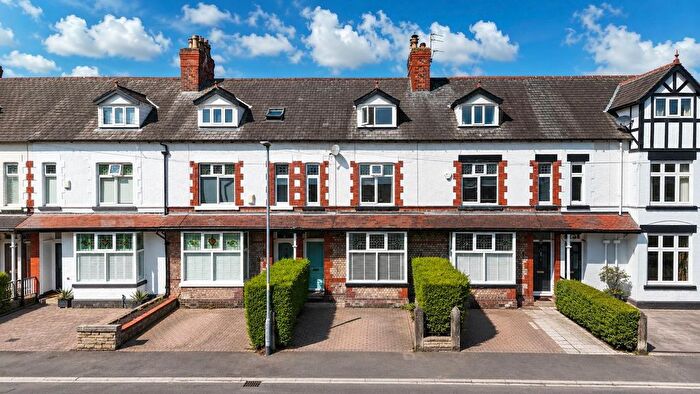
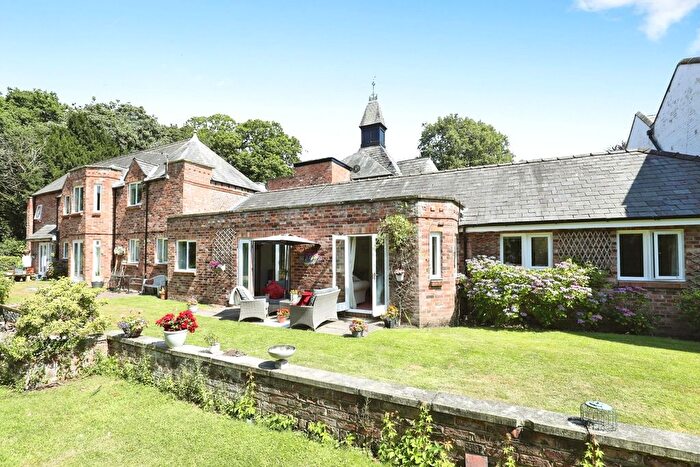
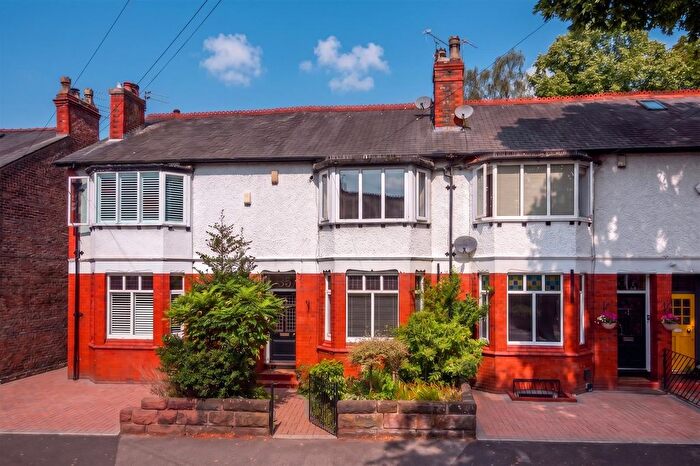
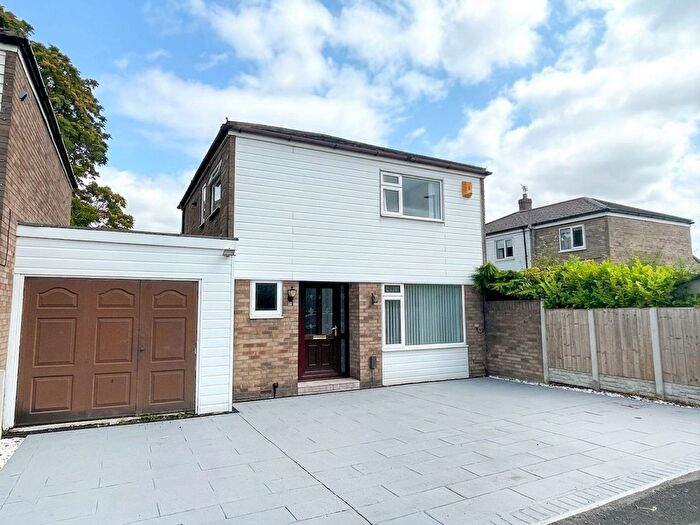
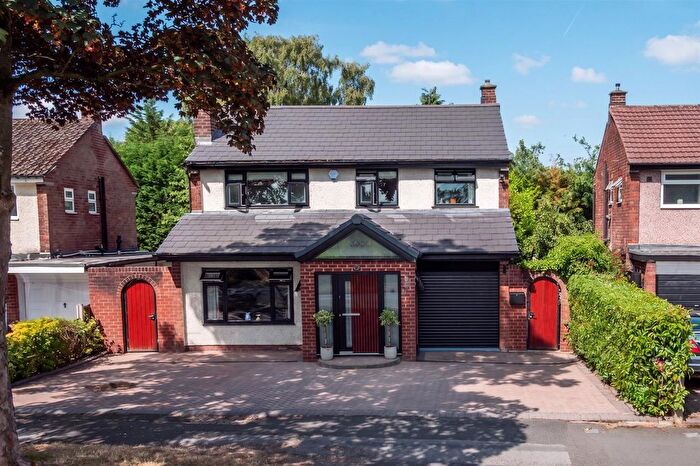
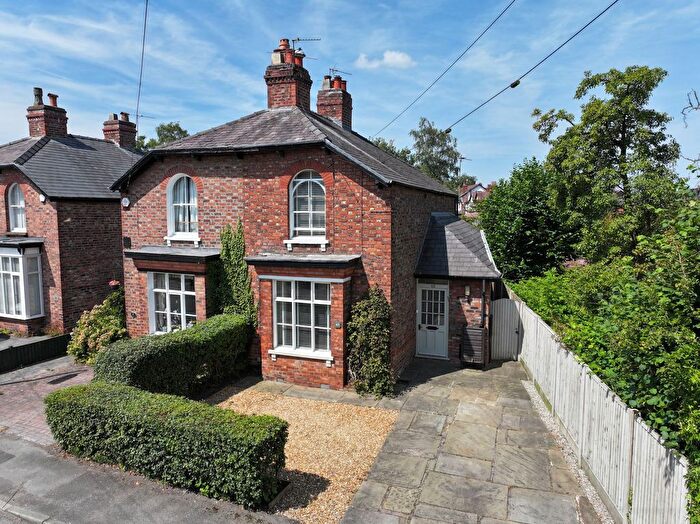
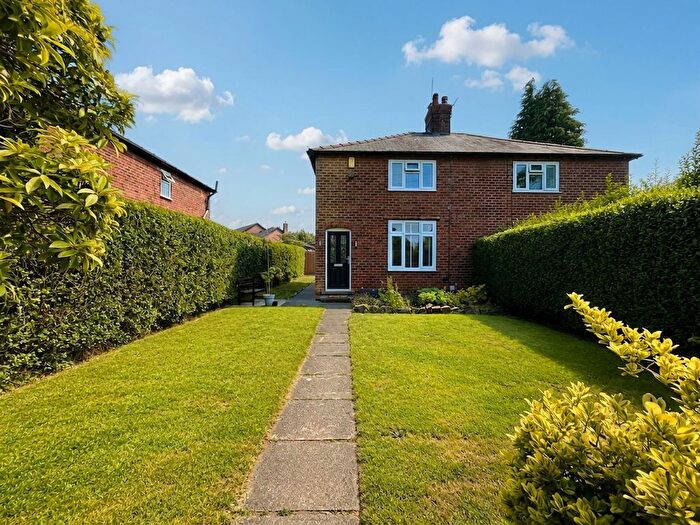
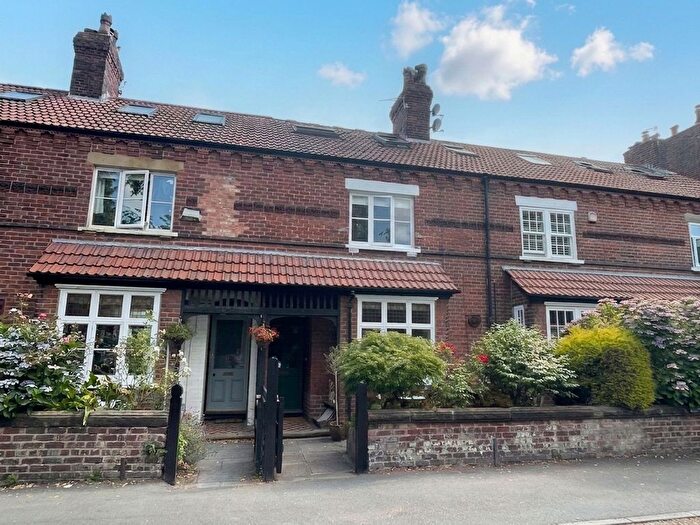
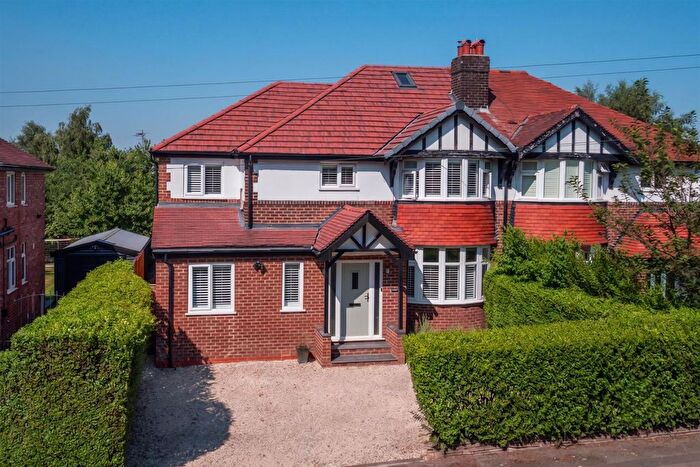
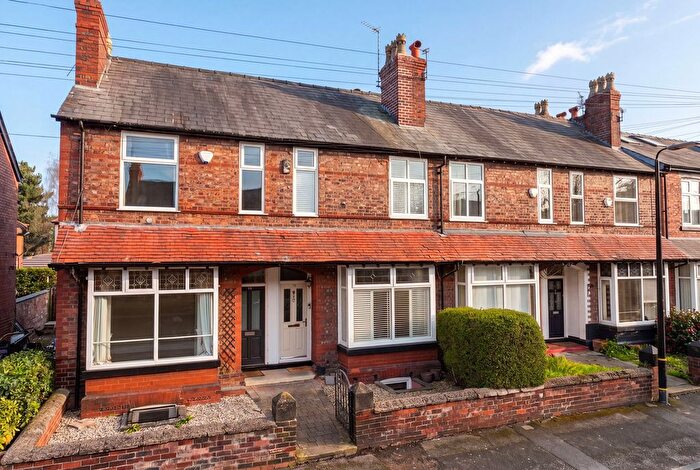
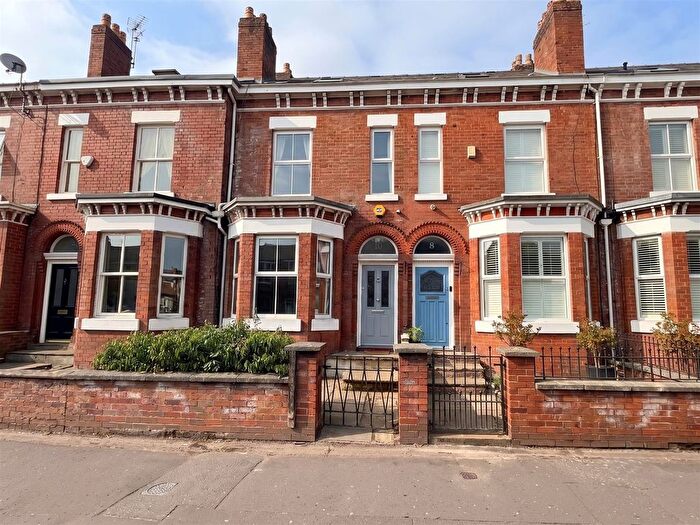
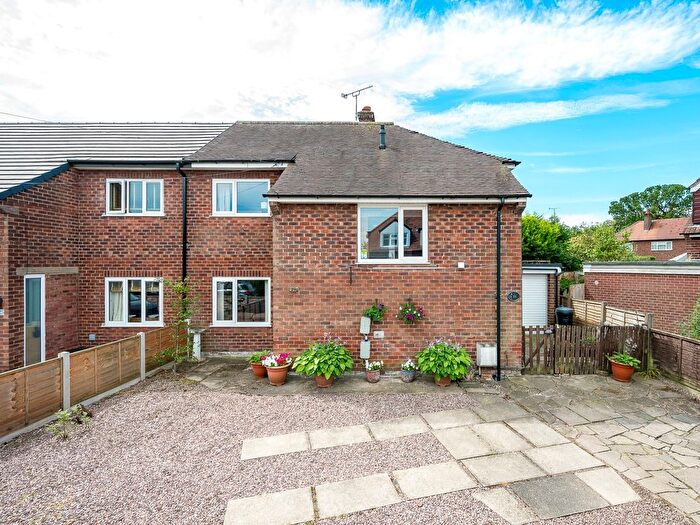
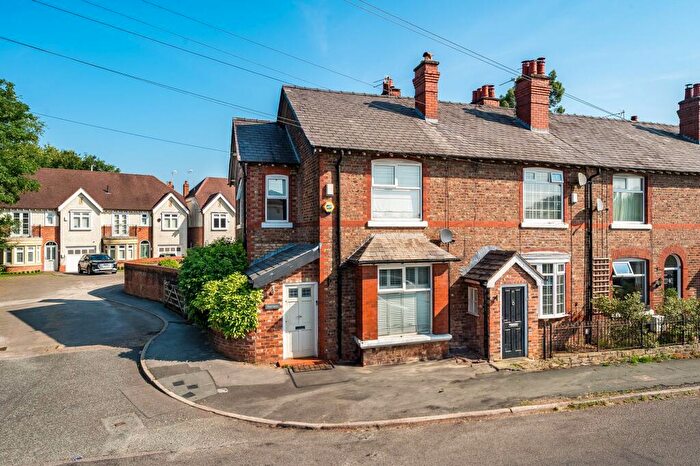
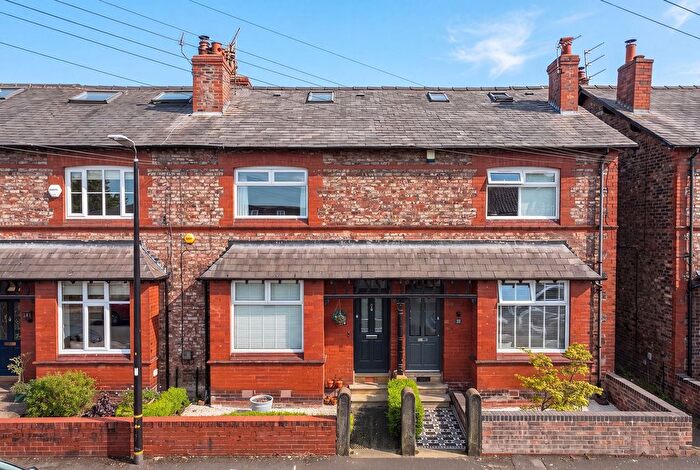
Properties for sale in Mobberley
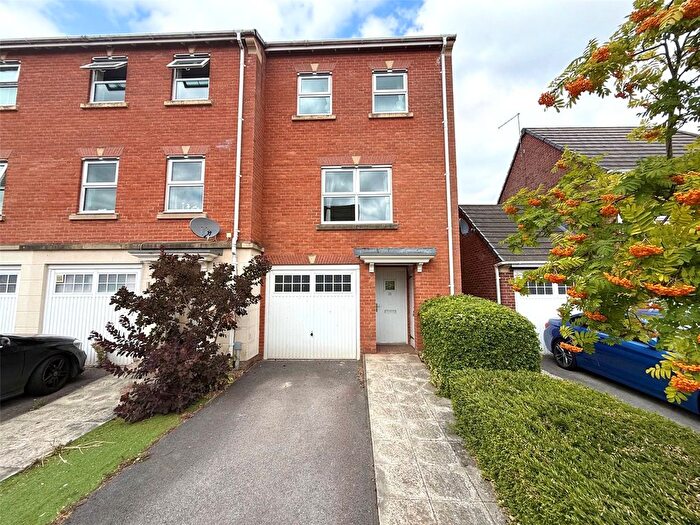
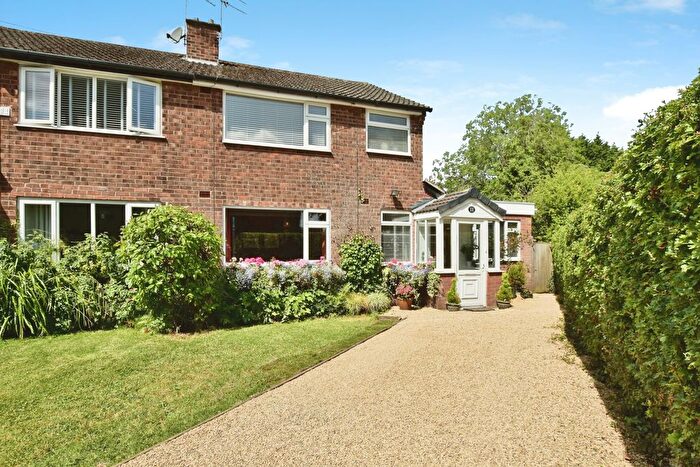
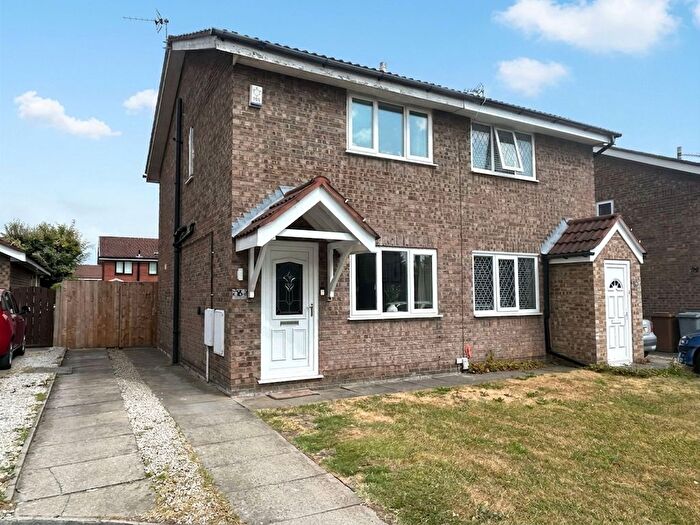
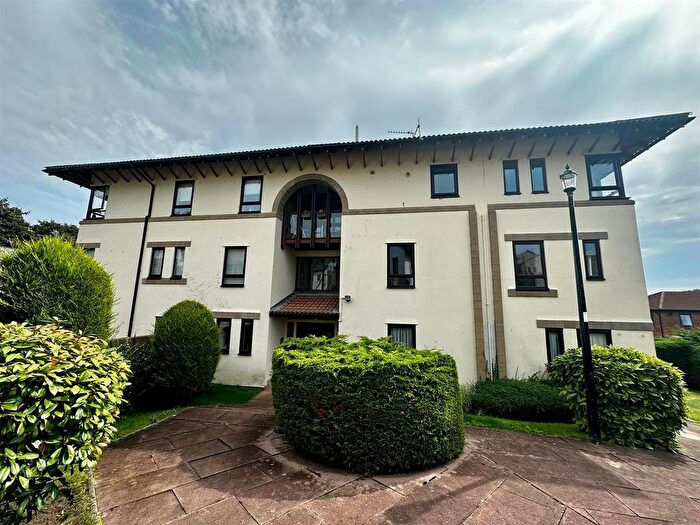
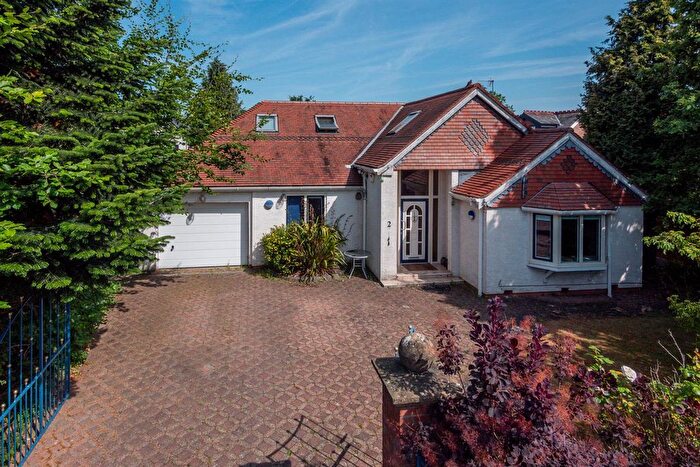
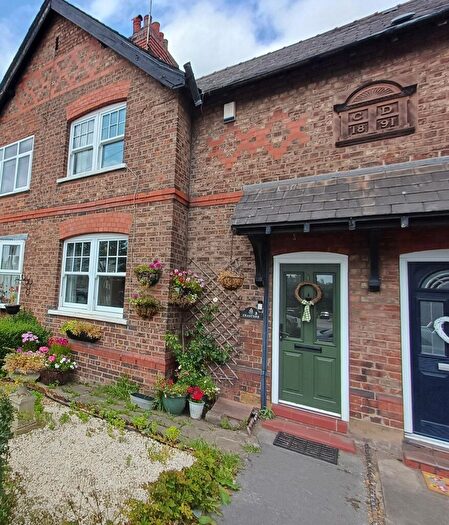
![]()
If you are looking to sell your house, let it out, or receive a property valuation, an expert can help you.
Click the button below to get started.
Roads and Postcodes in Mobberley
Navigate through our locations to find the location of your next house in Mobberley, Knutsford for sale or to rent.
Property price trends in Mobberley
According to the latest Land Registry data, the average home in Mobberley sold for £608,950 in 2026. That figure comes from 2,225 sales logged over the past 31 years.
Prices have moved up over the last three years. Compared with 2023, when the typical sale came in around £581,453, that's a rise of roughly 4.7%.
Looking back five years, average prices are up about 37.7% since 2021, a gain of around £166,685 in cash terms.
Zoom out to the past decade for the fuller picture. Back in 2016, homes here averaged £427,278, so the typical sold price has climbed about 42.5% since then, roughly 3.6% a year. Stretch the view to fifteen years and that annual pace edges up closer to 5.5%.
Frequently asked questions about Mobberley
What is the average price for a property for sale in Mobberley?
The average price for a property for sale in Mobberley is £543,838. This amount is 11% lower than the average price in Knutsford. There are 3,119 property listings for sale in Mobberley.
What streets have the most expensive properties for sale in Mobberley?
The streets with the most expensive properties for sale in Mobberley are Davenport Lane at an average of £1,450,000, Damson Lane at an average of £1,412,500 and Smith Lane at an average of £1,242,500.
What streets have the most affordable properties for sale in Mobberley?
The streets with the most affordable properties for sale in Mobberley are Rajar Walk at an average of £160,802, Barclay Park at an average of £173,700 and Great Oak Square at an average of £216,625.
Which train stations are available in or near Mobberley?
Some of the train stations available in or near Mobberley are Mobberley, Knutsford and Ashley.
Property Price Paid in Mobberley by Year
The average sold property price by year was:
| Year | Average Sold Price | Price Change |
Sold Properties
|
|---|---|---|---|
| 2026 | £608,950 | 6% |
5 Properties |
| 2025 | £571,794 | 20% |
48 Properties |
| 2024 | £454,880 | -28% |
42 Properties |
| 2023 | £581,453 | 10% |
55 Properties |
| 2022 | £526,043 | 16% |
62 Properties |
| 2021 | £442,265 | 5% |
99 Properties |
| 2020 | £421,001 | 3% |
59 Properties |
| 2019 | £409,541 | 11% |
54 Properties |
| 2018 | £366,118 | -5% |
67 Properties |
| 2017 | £385,522 | -11% |
51 Properties |
Property Price per Property Type in Mobberley
Here you can find historic sold price data in order to help with your property search.
The average Property Paid Price for specific property types in the last three years are:
| Property Type | Average Sold Price | Sold Properties |
|---|---|---|
| Flat | £202,315.00 | 32 Flats |
| Semi Detached House | £515,060.00 | 29 Semi Detached Houses |
| Detached House | £880,003.00 | 52 Detached Houses |
| Terraced House | £389,319.00 | 37 Terraced Houses |
