
Houses for sale in CH1 5JS, Elmuir, Blacon, Chester
House Prices in CH1 5JS, Elmuir, Blacon
Properties in CH1 5JS have no sales history available within the last 3 years. CH1 5JS is a postcode in Elmuir located in Blacon, an area in Chester, Cheshire, with 6 households².
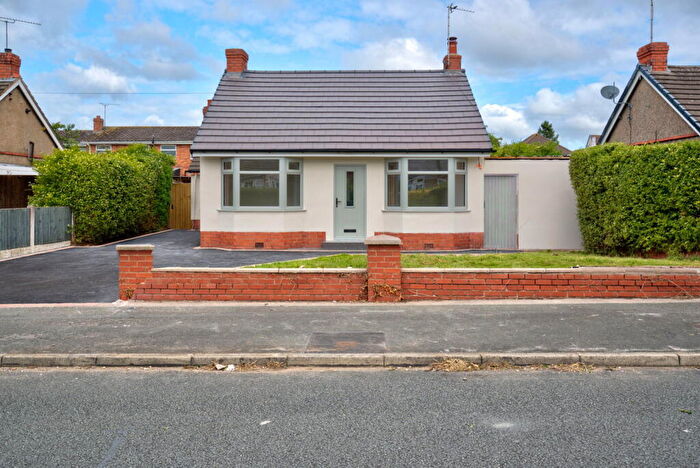
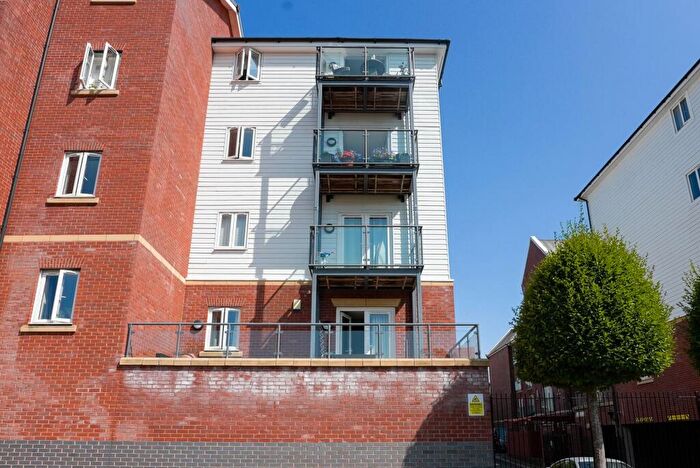
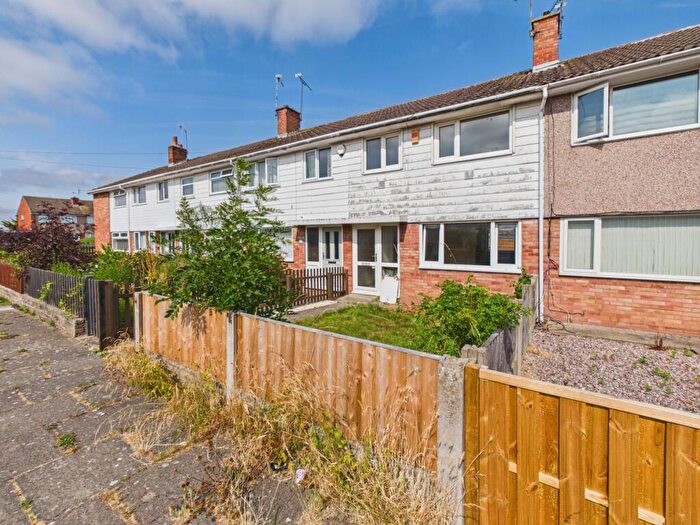
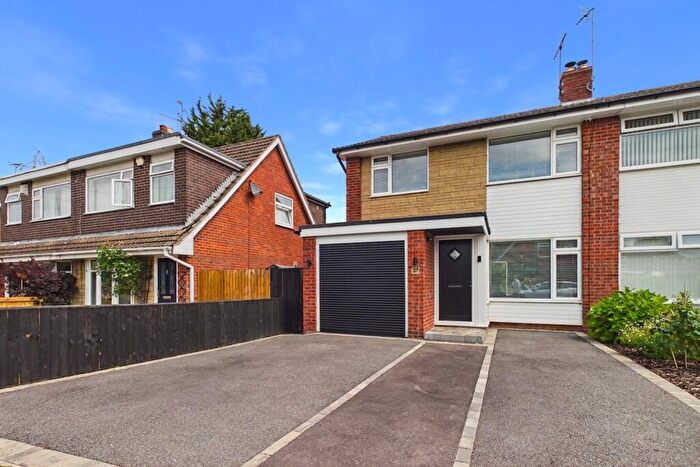
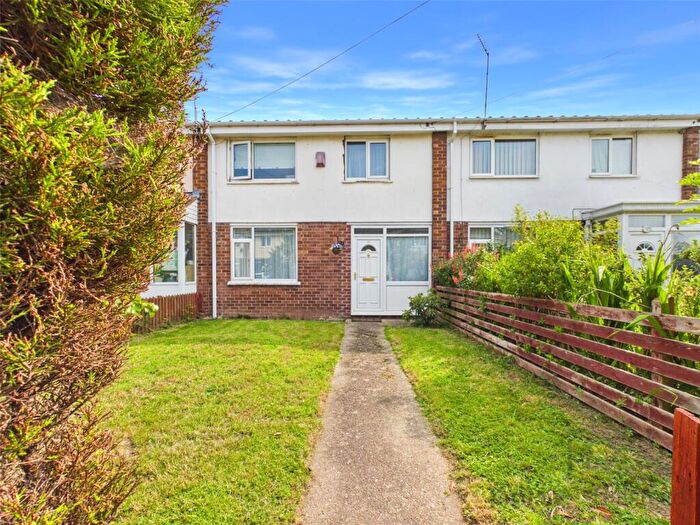
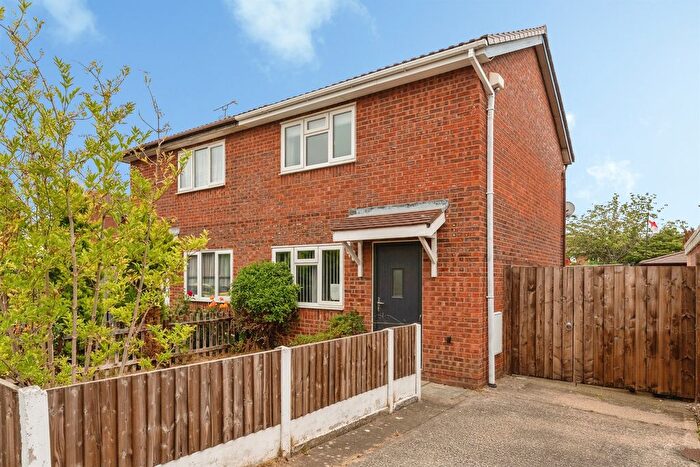
Properties for sale near CH1 5JS, Elmuir
![]()
If you are looking to sell your house, let it out, or receive a property valuation, an expert can help you.
Click the button below to get started.
Price Paid in Elmuir, CH1 5JS, Blacon
2 Elmuir, CH1 5JS, Blacon Chester
Property 2 has been sold 2 times. The last time it was sold was in 06/10/2017 and the sold price was £90,000.00.
This terraced house, sold as a freehold on 06/10/2017, is a 60 sqm end-terrace bungalow with an EPC rating of G.
| Date | Price | Property Type | Tenure | Classification |
|---|---|---|---|---|
| 06/10/2017 | £90,000.00 | Terraced House | freehold | Established Building |
| 08/04/2005 | £115,000.00 | Terraced House | freehold | Established Building |
5 Elmuir, CH1 5JS, Blacon Chester
Property 5 has been sold 1 time. The last time it was sold was in 06/01/2015 and the sold price was £70,000.00.
This terraced house, sold as a freehold on 06/01/2015, is a 38 sqm end-terrace bungalow with an EPC rating of D.
| Date | Price | Property Type | Tenure | Classification |
|---|---|---|---|---|
| 06/01/2015 | £70,000.00 | Terraced House | freehold | Established Building |
1 elmuir, CH1 5JS, Blacon Chester
This is a 55 square meter End-terrace Bungalow with an EPC rating of F. Currently, there is no transaction history available for this property.
Property price trends in CH1 5JS, Elmuir
According to the latest Land Registry data, the average home in CH1 5JS, Elmuir sold for £90,000 in 2017. That figure comes from 3 sales logged over the past 12 years.
Prices have continued to climb over the last three years. Compared with 2015, when the typical sale came in around £70,000, that's a rise of roughly 28.6%.
Zoom out to the past decade for the fuller picture. Back in 2005, homes here averaged £115,000, so the typical sold price has fallen about 21.7% since then, around 2% a year lower.
Property Price Paid in CH1 5JS, Elmuir by Year
The average sold property price by year was:
| Year | Average Sold Price | Price Change |
Sold Properties
|
|---|---|---|---|
| 2017 | £90,000 | 22% |
1 Property |
| 2015 | £70,000 | -64% |
1 Property |
| 2005 | £115,000 | - |
1 Property |
