
Houses for sale in Whitby, Chester
House Prices in Whitby
Properties in Whitby have no sales history available within the last 3 years.
Whitby is an area in Chester, Cheshire with 23 households².
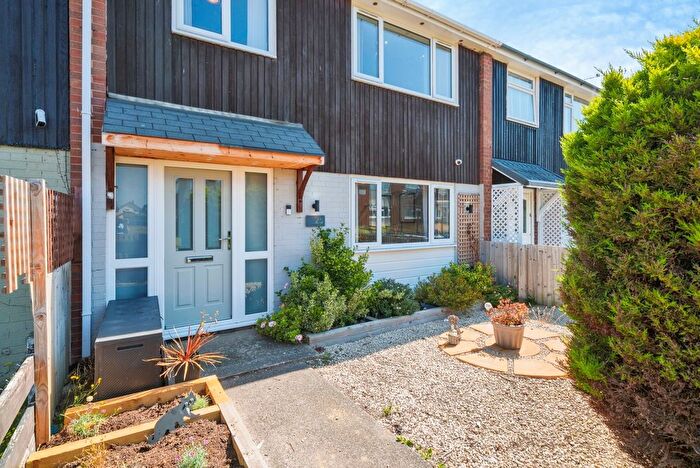
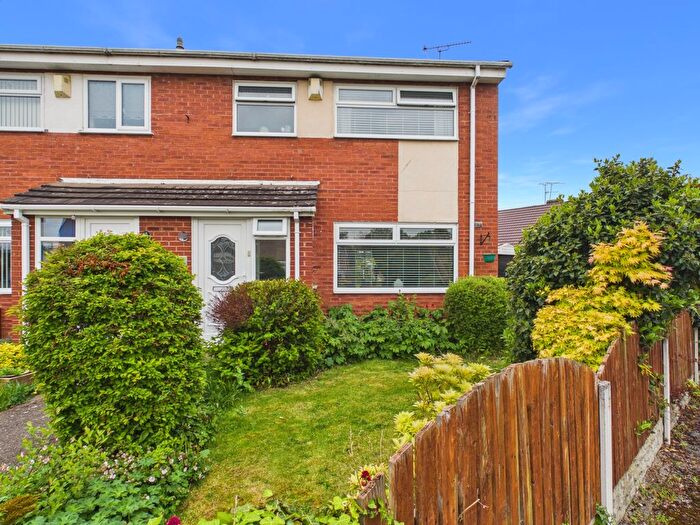
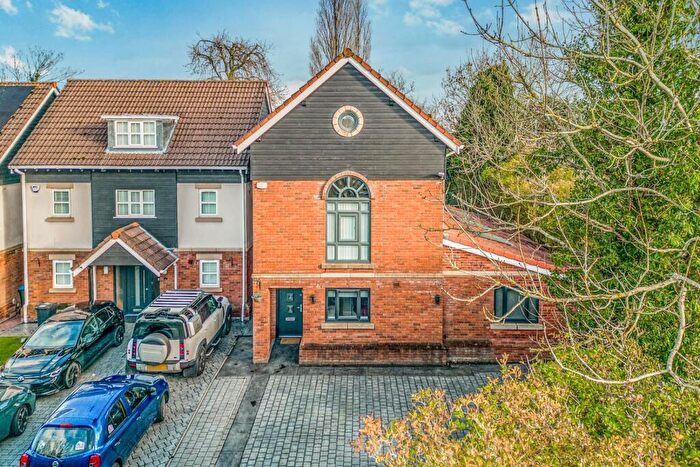
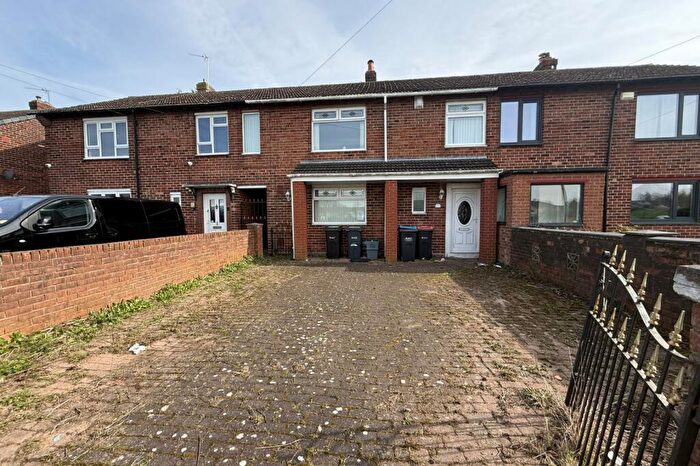
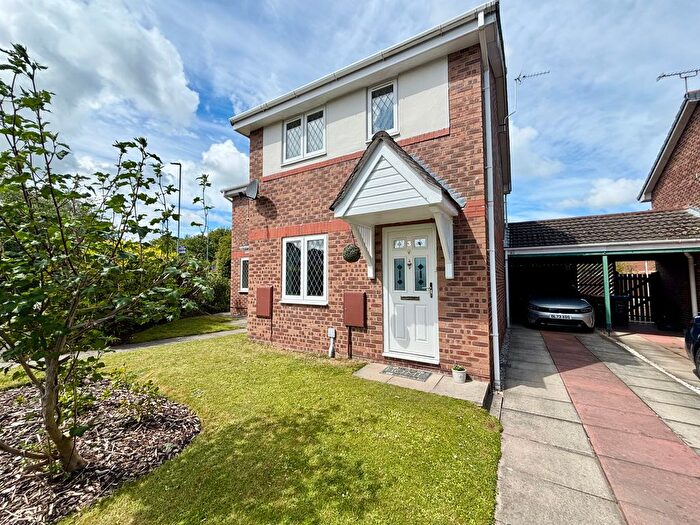
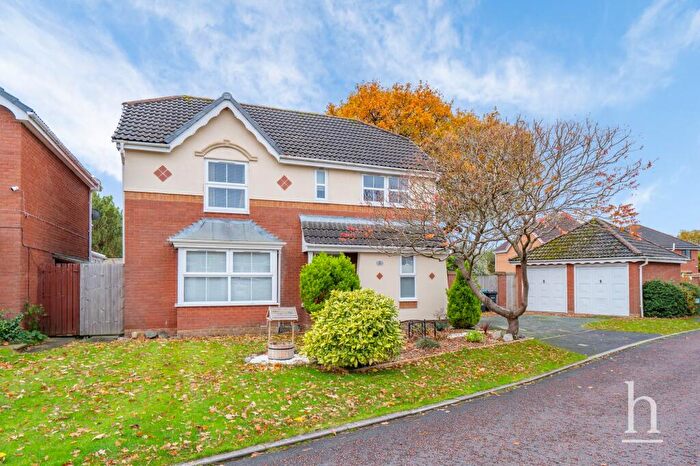
Properties for sale in Whitby
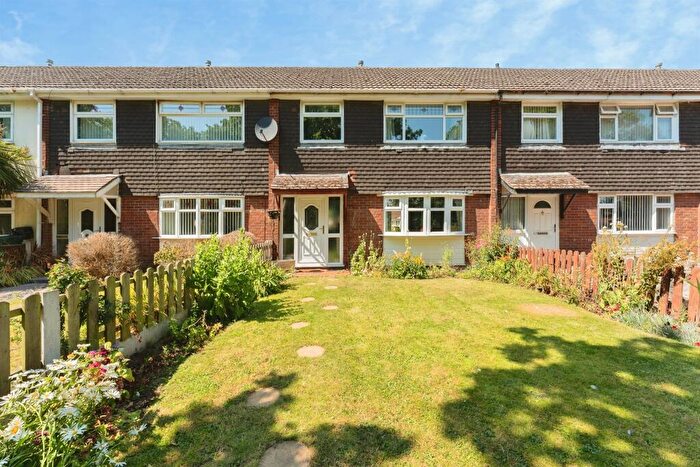
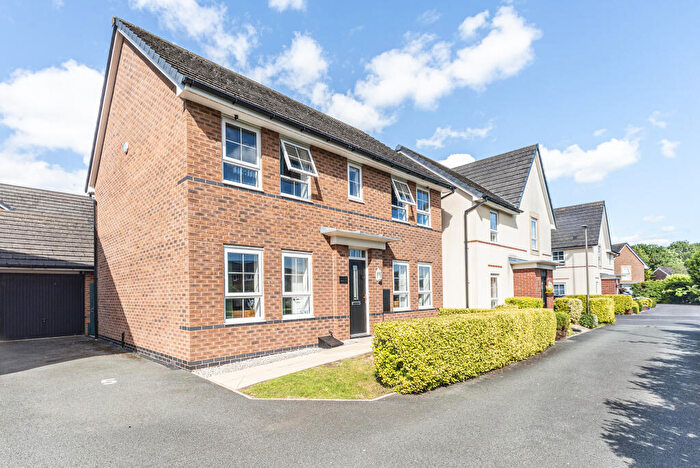
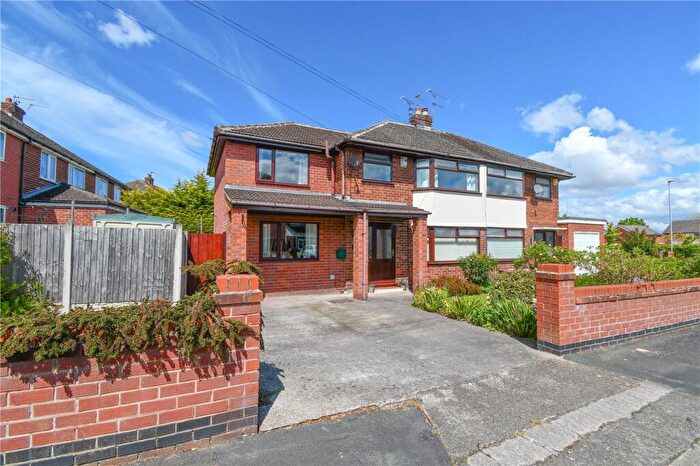
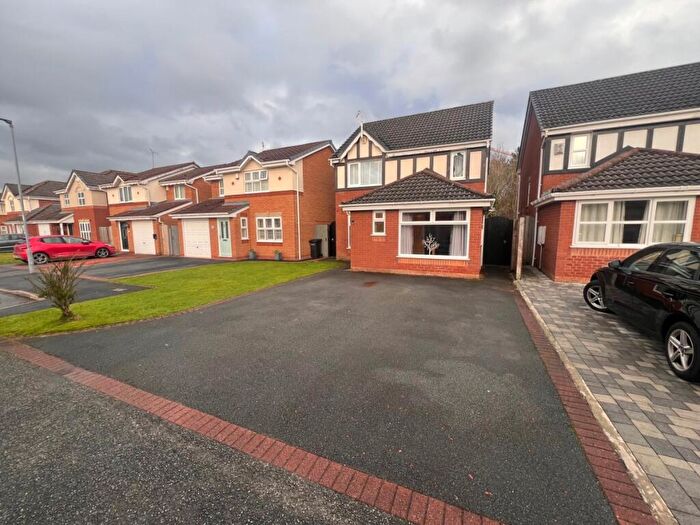
![]()
If you are looking to sell your house, let it out, or receive a property valuation, an expert can help you.
Click the button below to get started.
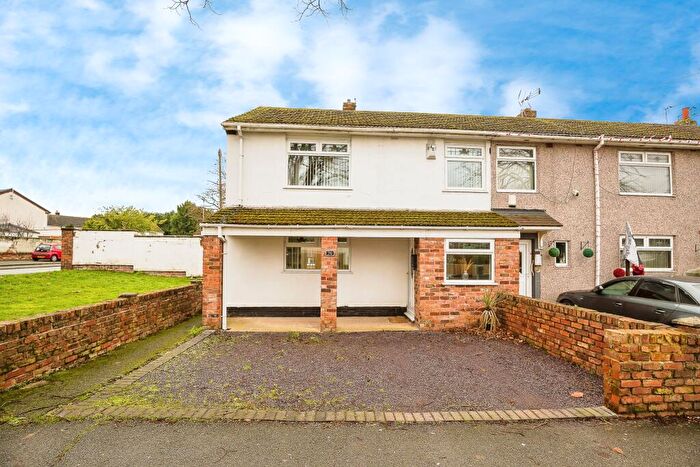
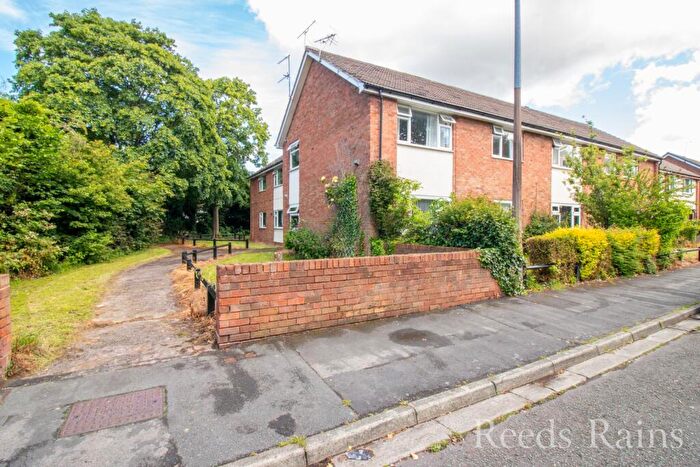
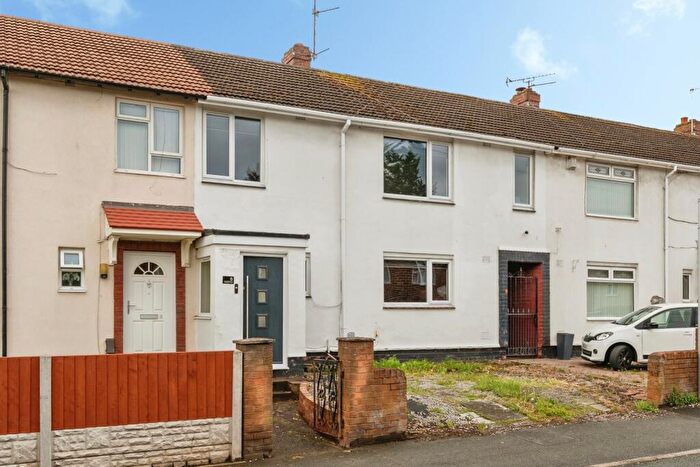
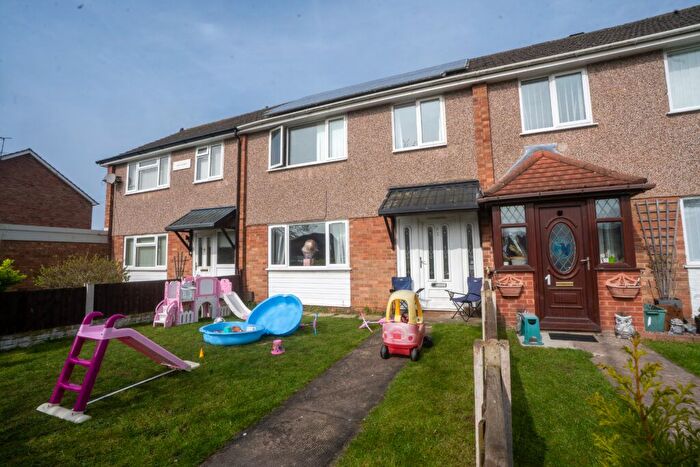
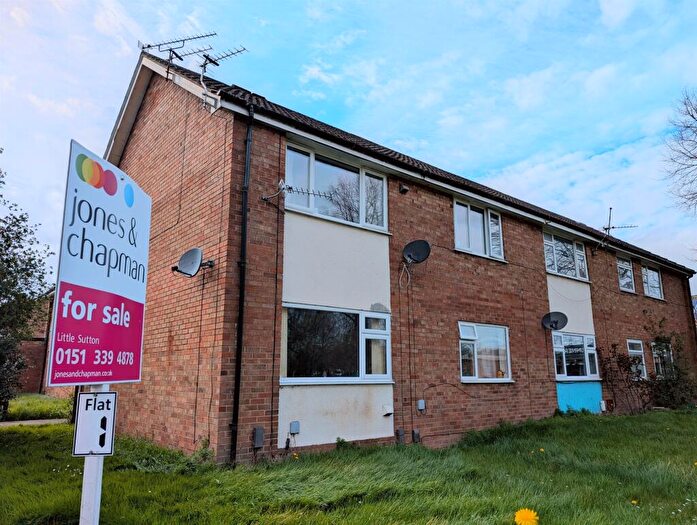
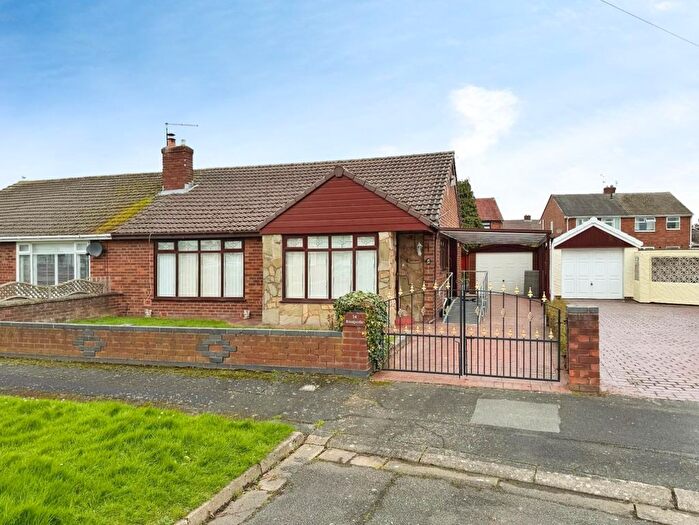
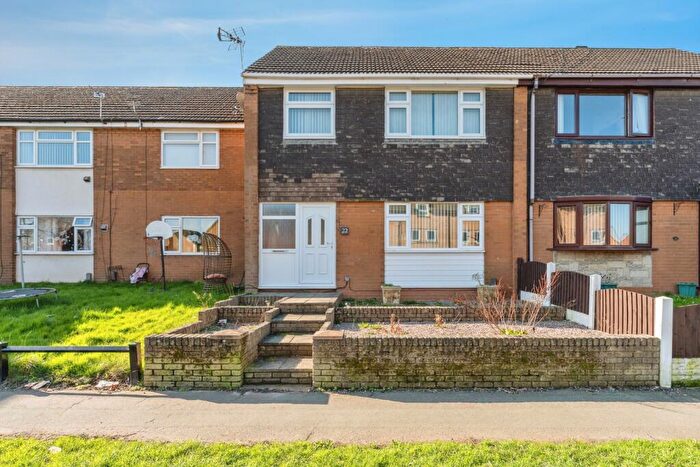
Previously listed properties in Whitby
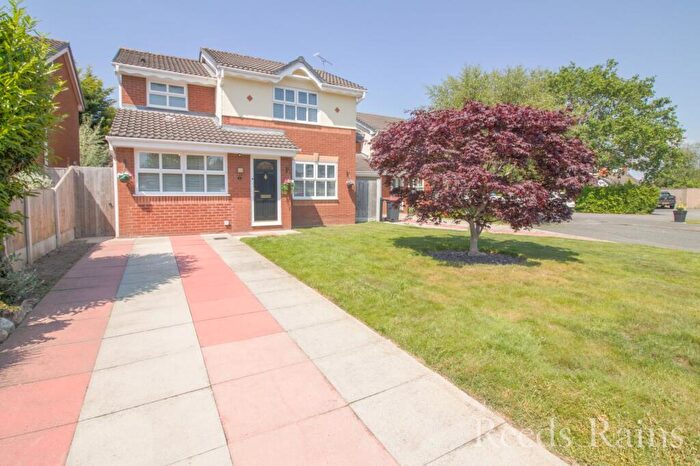
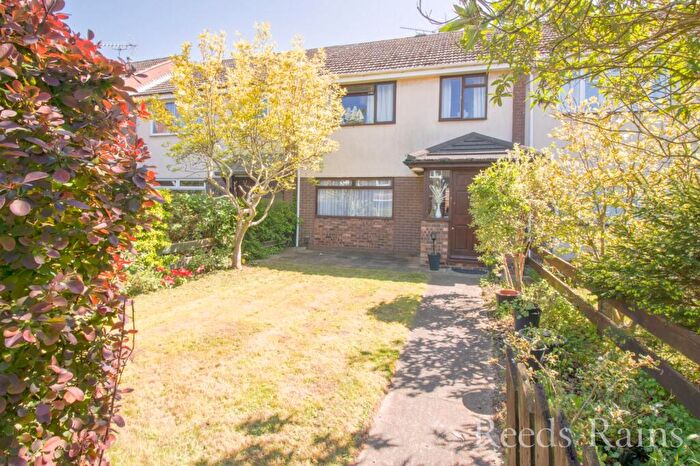
![]()
If you are looking to sell your house, let it out, or receive a property valuation, an expert can help you.
Click the button below to get started.


Roads and Postcodes in Whitby
Navigate through our locations to find the location of your next house in Whitby, Chester for sale or to rent.
| Streets | Postcodes |
|---|---|
| Stanney Lane | CH2 4HT |
Property price trends in Whitby
According to the latest Land Registry data, the average home in Whitby sold for £162,000 in 2019. That figure comes from 12 sales logged over the past 23 years.
Prices have fallen back over the last three years. Compared with 2017, when the typical sale came in around £247,000, that's a fall of roughly 34.4%.
Looking back five years, average prices are down about 3.6% since 2014, a drop of around £6,000 in cash terms.
Zoom out to the past decade for the fuller picture. Back in 2009, homes here averaged £120,000, so the typical sold price has climbed about 35% since then, roughly 3% a year. Stretch the view to fifteen years and that annual pace eases back to about -0.8%.
Frequently asked questions about Whitby
Which train stations are available in or near Whitby?
Some of the train stations available in or near Whitby are Ellesmere Port, Stanlow and Thornton and Overpool.
Property Price Paid in Whitby by Year
The average sold property price by year was:
| Year | Average Sold Price | Price Change |
Sold Properties
|
|---|---|---|---|
| 2019 | £162,000 | -52% |
1 Property |
| 2017 | £247,000 | 32% |
1 Property |
| 2014 | £168,000 | 29% |
1 Property |
| 2009 | £120,000 | -304% |
1 Property |
| 2007 | £484,500 | 62% |
1 Property |
| 2003 | £183,000 | 51% |
1 Property |
| 2002 | £90,000 | -38% |
1 Property |
| 2001 | £124,000 | 53% |
1 Property |
| 2000 | £58,750 | -92% |
1 Property |
| 1999 | £113,000 | 20% |
2 Properties |
